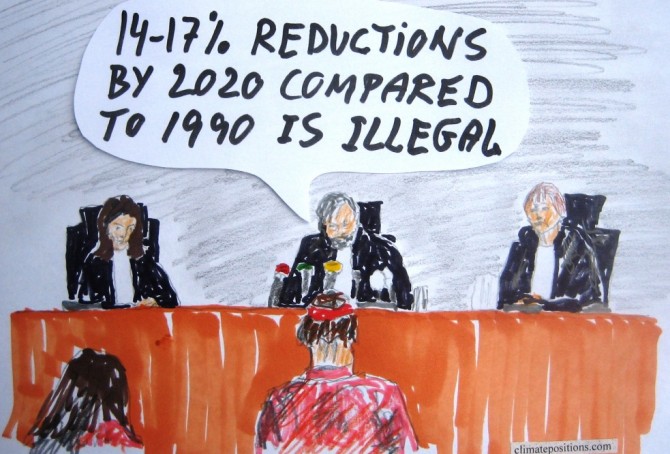
Court has ordered Netherlands to reduce carbon emissions by 25% within five years in the world’s first climate change liability lawsuit
2015
In the first climate change liability lawsuit brought under human rights and tort law, a court in Hague today concluded that the threat posed by global warming was severe and acknowledged by the government of Netherland in international treaties. Therefore the government’s climate policy was ruled illegal and the three judges ordered the government to reduce carbon emissions by at least 25% within five years. Government’s plans to reduce carbon emissions by just 14-17% by 2020 compared to 1990 were rejected as inadequate to protect the citizens from the effects of climate change.
The lawsuit was brought by The Dutch ‘Urgenda’ Foundation. Read the article ‘Dutch government ordered to cut carbon emissions in landmark ruling’ from The Guardian and the article ‘Oslo Principles on obligations to reduce climate change (time for legal sanctions)‘. A similar lawsuit is underway in the neighboring country of Belgium.
Historic use of phrases such as Climate Change, Biodiversity, Renewable Energy, Fracking, etc. (Google Books Ngram Viewer)
2015
‘Ngram Viewer’ is a Google search service showing graphs of historic use of words and phrases in books published in the United States (until 2008). The diagram below shows the trend of the phrases: Climate Change, Biodiversity, Global Warming, Deforestation, Renewable Energy, Greenhouse Effect, Invasive Species and Fracking. The corpus search is in “English” (case-insensitive), between 1980 and 2008. Read the comments below the diagram.
Nuclear Power updates 2014
2015
The world’s Nuclear Power generation increased by 2.2% in 2014 compared to 2013. The six largest nuclear producers United States, France, Russia, South Korea, China and Canada increased generation by 4.0%, while the rest of the world reduced generation by 3.9%.
The same six Nuclear Power countries, representing 28% of the world’s population, are responsible for 54% of the global CO2 Emissions from fossil fuels and 60% of the global Climate Debt (see the ‘ranking’).
The last five years of generated global nuclear electricity was:
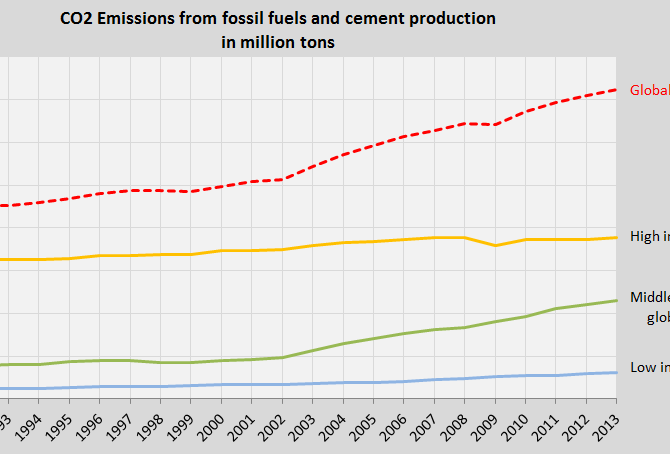
Global CO2 Emissions 1990-2013 (three country groups by income)
2015
The first diagram shows the global CO2 Emissions from fossil fuels and cement production between 1990 and 2013 (the red dotted line). The trend is of cause outrageous and irresponsible towards future generations.
The other three lines in the diagram show the CO2 Emission trends of three country groups among 147 countries with full data in ClimatePositions, representing 97% of the global population. The three groups are divided by national income per capita in 2012:

Climate change performance of Turkmenistan, Uzbekistan, Kyrgyzstan and Tajikistan
2015
0.7% of the global population lives in Turkmenistan, Uzbekistan, Kyrgyzstan or Tajikistan, and together they emitted 0.6% of the global CO2 from fossil fuels in 2012. Turkmenistan’s updated Climate Debt per capita is $1,394 and Uzbekistan’s is $84. Kyrgyzstan and Tajikistan are both Contribution Free (no Climate Debt). See the ‘ranking’ of 147 countries by November 2014. The following examines the CO2 Emissions (carbon dioxide from fossil fuels), GDP(ppp-$) and Climate Debt as a percentage of GDP.
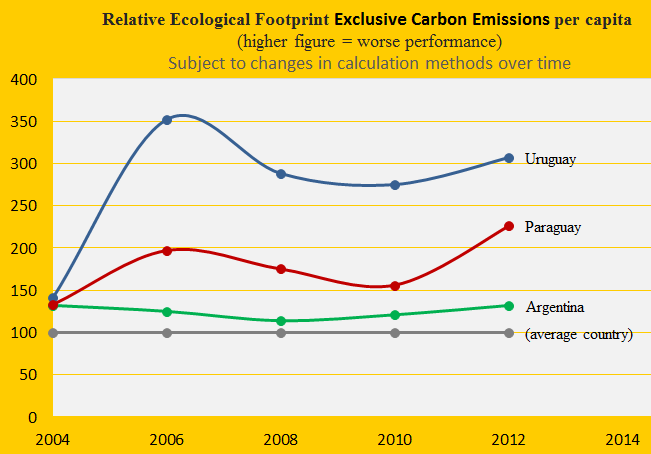
Climate change performance of Uruguay, Paraguay and Argentina
2015
Due to livestock Uruguay has the world’s 2nd largest Ecological Footprint (without carbon emissions) per capita and Paraguay is 5th. Argentina is ranked 37th among 154 countries. The first diagram shows the development since 2004, with the world average set at 100. The footprint is one of several ‘indicators’ in the calculation of Climate Debt in ClimatePositions.
The Climate Debt of Uruguay, accumulated since 2000, is $124 per capita and Paraguay is Contribution Free (no Climate Debt). Due to lack of data of GDP Argentina is excluded from the ranking – however if the GDP(ppp-$) were to be set at the level of Uruguay, then the Argentine Climate Debt would be $405 per capita. The following examines the indicators of CO2 Emissions (carbon dioxide from fossil fuels), Forests, Ecological Footprint and GDP(ppp-$).