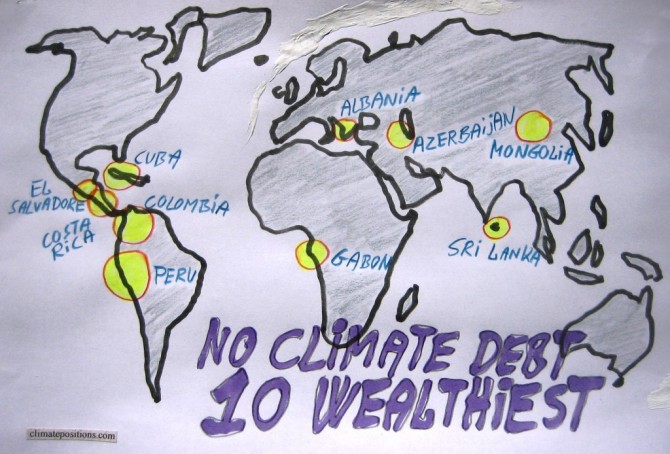
The ten wealthiest countries without any Climate Debt
2015
Among the 147 countries with full data in ClimatePositions 65 are Contribution Free (no Climate Debt). See the ‘ranking’. The table in this article ranks (from 1 to 10) the ten wealthiest Contribution Free countries by the following eight indicators:
- Per capita GDP(ppp-$) (1 = wealthiest)
- Income Equality (1 = most equal)
- Per capita CO2 Emissions from fossil fuels (1 = lowest emissions)
- Democracy Index (1 = most democracy)
- Environmental Performance (1 = best performance)
- Life Expectancy by birth (1 = longest lives)
- Per capita Ecological Footprint without carbon (1 = smallest footprint)
- Primary Forests as a percentage of the total land area (1 = largest percentage)
Read the comments below the table.

Climate change performance and religious beliefs
2014
Nothing suggests that religiosity is a brake on the ongoing climate destruction caused by humans – simply because 84% of the global population is considered more or less religious. The following looks at the possible correlation between Climate Contribution (climate debt) and the world religions: Christianity, Islam, Hinduism and Buddhism – and Other Religions and the Residual Group (including non-religious). All figures must be interpreted with great caution due to uncertainties and dilemmas in the compilation methods.
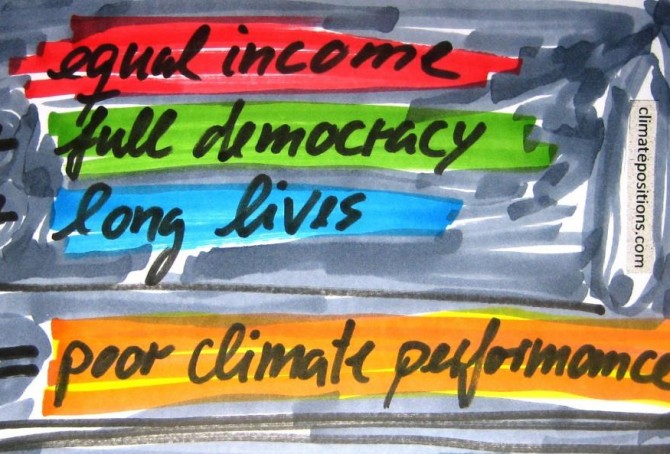
Income Equality, Life Expectancy, Democracy Index … and Climate Contributions
2014
123 out of 145 countries with full data in ClimatePositions are included in an inventory of Income Equality (see the source at the bottom), which shows how much the 10% poorest earns compared to the 10% richest. 53 out of the 123 countries are Contribution Free (no climate debt) in ClimatePositions 2010 and 70 countries are not.
The table below shows the difference between the two groups of countries in terms of Income Equality, Life Expectancy, number of Full Democracies and number of Authoritarian Regimes. To clarify the trend the 20 countries with the largest Climate Contributions appear at the top of the table. The 123 countries represent 95% of the world population.

Five Eyes Alliance is watching you
2013
Australia, Canada, New Zealand, United Kingdom and United States are secretly watching private mails, phone calls etc. worldwide – secretly until Snowden whistled. All five countries’ are defined as Full Democracies but the self-righteous surveillance activities take place in the closed Five Eyes Alliance (see ‘UKUSA Agreement‘ and ‘Echelon‘) with United States (read NSA) as Big Brother.
Is Singapore a climate change scoundrel?
2013
The island of Singapore was the 2nd worst performing country in ClimatePositions 2010 with a contribution (climate debt) of $9,924 per capita and there are no signs of improvement since. In the updated calculation the amount has increased to $12,364. The diagram shows the small hybrid regime’s outrageous annual CO2 Emissions (the green bars show the Contribution Free Level). Note that a large proportion of the emissions is due to marine bunkers.

Australia perform worst of democratic countries
2013
Australia was the 6th worst performing country in the world in ClimatePositions 2010 with a Climate Contribution of $4,387 per capita. In the latest calculation it had increased to $5,081. The total national Contribution (climate debt) is now 109 billion US$. Since no country in top 5 is Full Democracies, Australia is the worst performing democratic country. It can be assumed that the majority of the Australian voters are pleased with this destructive approach to the planet.

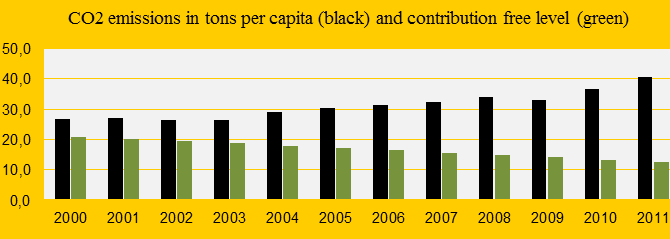
Impressive performance by Costa Rica
2013
In 2010 ‘Costa Rica‘ was the only Contribution Free, full democratic country with a GDP(ppp-$) above the global average. The diagram above shows the national CO2 Emissions per capita (the black bars) and the Contribution Free Levels of CO2 Emissions (the green bars) in 2000-2011. Note that Costa Rica could have increased CO2 Emissions (carbon dioxide) from 1.2 ton CO2 per capita in 2000 to 1.9 tons in 2011 and still be Contribution free, due to other fine indicator values.
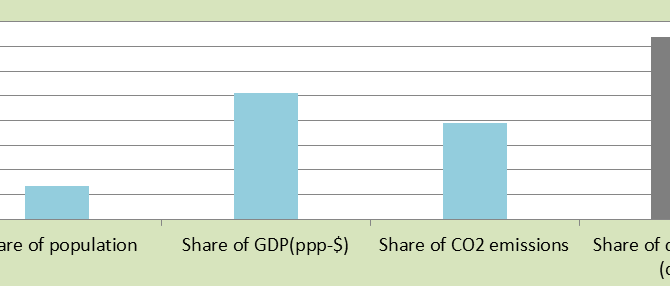
Full Democracies means large Climate Contributions (climate debt)
2013
The diagram shows 23 Full Democracy countries’ total share of the global: 1) Population (13%), 2) GDP(ppp-$) (51%), 3) CO2 Emissions (39%) and 4) Contributions (debt) (74%). Only 1/8 of the people on the planet live in other words in Full Democracies and they are accountable for 3/4 of the global Contributions (climate debt) in ClimatePositions 2010. Also the ecological footprint (excluding CO2 Emissions) of a majority of these 23 countries is very large, with an average of 2.7 EPI. Obviously democracies in general are still flawed when it comes to planet responsibility and climate change response. Costa Rica is the only Contribution Free country on the Full Democracy list (more about Costa Rica soon).