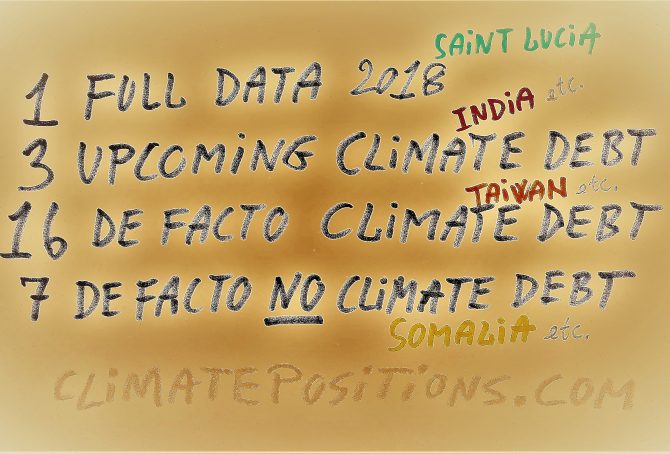
Countries with upcoming or de facto Climate Debts
2018
Among 164 countries with full data in ClimatePositions 91 have Climate Debts. Note that Saint Lucia is new on the full data country-list with an accumulated per capita Climate Debt of $287. India, Lithuania and Latvia are likely to have small Climate Debts soon … by 2018 or 2019.
In addition to the full data country-list, 16 countries with lack of indicator data would have Climate Debts with roughly estimated data¹. The estimated per capita Climate Debts of these countries are:

Estimated Climate Debt of 24 countries or regions with incomplete data
2017
24 countries or administrative regions with populations larger than 100,000 are excluded from ClimatePositions due to incomplete ‘Indicator‘ data. However, approximate Climate Debts can be calculated by using assumptions of the missing values of: 1) GDP(ppp-$), 2) Environmental Performance, 3) Ecological Footprint (without Carbon Footprint), 4) Forest Cover, Primary Forest and Protected Waters.
First, the table below shows the estimated Climate Debt of the 24 countries or regions. Together, they represent 1.3% of the Population and 2.5% of the total Climate Debt of the 163 countries with full data in ClimatePositions (see the ‘Ranking‘). The estimated average Climate Debt of the 24 countries is $1,765 per capita compared to $905 of the 163 countries with full data.
New at COP21: The Vulnerable Twenty Group (V20)
2015
Prior to COP21 in Paris in December twenty countries most at risk from the effects of global warming has formed ‘The Vulnerable Twenty Group (V20)’. Unified, the new group hopes for greater access to climate finance for adaptation and mitigation. The twenty countries representing almost one-tenth of the world’s population are: Bangladesh, Philippines, Ethiopia, Vietnam, Tanzania, Kenya, Afghanistan, Nepal, Ghana, Madagascar, Rwanda, Costa Rica, Bhutan, Timor-Leste, Maldives, Barbados, Vanuatu, Saint Lucia, Kiribati and Tuvalu. The first thirteen on the list have full data in ClimatePositions and they are all Contribution Free (no Climate Debt) among 147 countries (see the ‘ranking’). The last seven are examined below in terms of climate change performance.
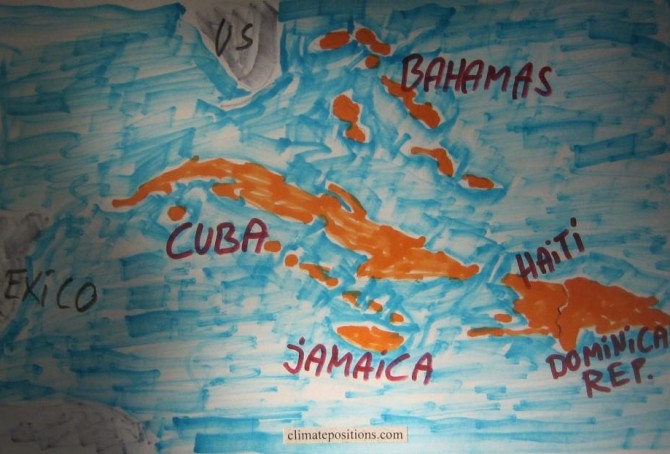
Climate change performance of Jamaica, Cuba, Haiti, the Dominican Republic and the Bahamas
2015
Jamaica’s updated Climate Debt per capita is $181 and the one of the Dominican Republic is $67. Cuba and Haiti are both Contribution Free (no Climate Debt). See the ‘ranking’ of 147 countries by November 2014. The Bahamas are not included due to lack of data on Ecological Footprint – however, if this indicator it is set at world’s average, then the per capita Climate Debt of the Bahamas would be $2,982 (ranked 17). The following examines CO2 Emissions from fossil fuels, GDP(ppp-$), Environmental Performance and Forest Cover.
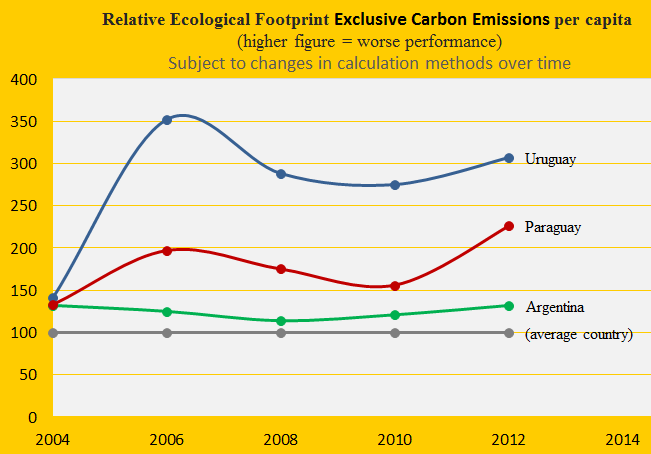
Climate change performance of Uruguay, Paraguay and Argentina
2015
Due to livestock Uruguay has the world’s 2nd largest Ecological Footprint (without carbon emissions) per capita and Paraguay is 5th. Argentina is ranked 37th among 154 countries. The first diagram shows the development since 2004, with the world average set at 100. The footprint is one of several ‘indicators’ in the calculation of Climate Debt in ClimatePositions.
The Climate Debt of Uruguay, accumulated since 2000, is $124 per capita and Paraguay is Contribution Free (no Climate Debt). Due to lack of data of GDP Argentina is excluded from the ranking – however if the GDP(ppp-$) were to be set at the level of Uruguay, then the Argentine Climate Debt would be $405 per capita. The following examines the indicators of CO2 Emissions (carbon dioxide from fossil fuels), Forests, Ecological Footprint and GDP(ppp-$).

65 Contribution Free countries…GDP-ranked (with Income Equality, Life Expectancy and Environmental Performance)
2014
65 out of 147 countries with full data in ClimatePositions are Contribution Free (no climate debt). 41% of the world’s population lives in these Contribution Free countries and they emitted only 9% of the global carbon dioxide from fossil fuels in 2012 – without India the corresponding figures are 24% of the global population and 3% of the emissions.
The table below shows the 65 Contribution Free countries ranked by GDP(ppp-$) per capita, with Income Equality (‘Atkinson Index‘), Life Expectancy and Environmental Performance. The world’s average GDP(ppp-$) per capita was $13.791 in 2012. Analysis and comments see below the table – the color codes are explained in the bottom.
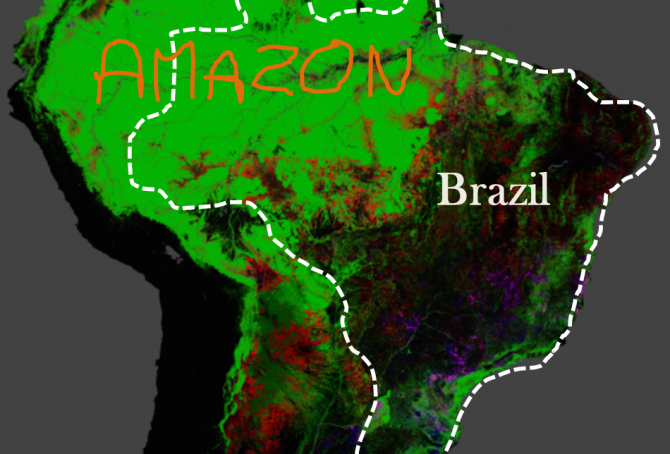
Brazil’s rainforests and climate change performance
2014
The Google map of the Amazon is from the new interactive ‘Global Forest Change‘ developed by The University of Maryland (read ‘more’). The red is Forest Loss from 2000 to 2012, the blue is Forest Gain and the green is Forest Extent (unchanged). The purple is areas of mixed Forest Loss and Forest Gain. According to Brazil’s environment minister the lowest recorded deforestation of Brazil since 1988, was in 2012. Furthermore, up to a third of the cleared rainforest over the past decades may be on the way back (regrowth).
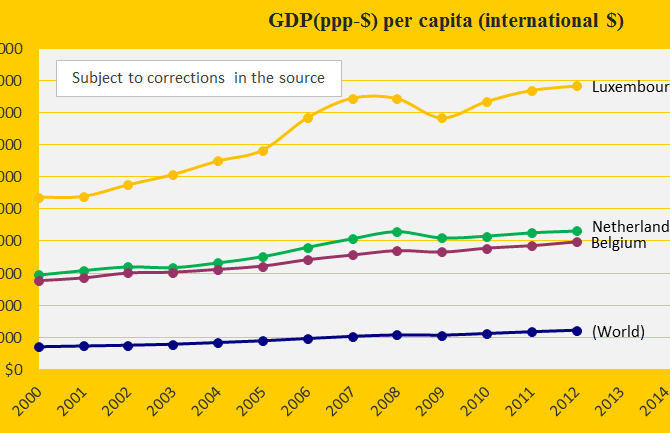
Miserable climate performance of Netherlands, Belgium and Luxembourg
2014
Netherlands and Belgium are rich countries and the little tax haven Luxembourg is extremely rich – see the diagram with the GDP(ppp) since 2000 compared with the world average. Netherlands and Belgium were 9th and 10th worst performing countries out of 145 in Climate Positions 2010. See the full ranking in the menu “Contributions / Per Capita US$ Rank”. Due to lack of data on Ecological Footprint Luxembourg is not included in the ranking. However, if the missing data is estimated at the same level as the neighboring countries, then Luxembourg would be 4th on the list. Together, the three countries are the vanguard of climate destruction in the European Union (EU).

Climate performance of Israel, Occupied Palestinian Territories and neighboring countries
2014
Israel was the 16th worst performing country out of 145 in ClimatePositions 2010 with a Climate Contribution of $1,790 per capita (see the ranking in the menu “Calculation”). The Palestinian Territories (Gaza Strip and West Bank, both occupied by Israel) were in reality Contribution Free (though excluded from the inventory due to lack of indicator data¹). The following examines the statistics of Israel, the Occupied Palestinian Territories, Lebanon, Jordan, Syria and Egypt.
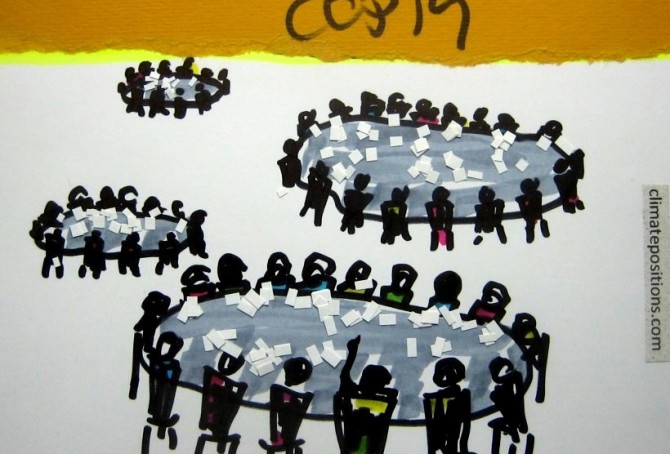
Country groups and positions at COP19
2013
The negotiation process during COP19 in Warsaw in November 2013 was frustrating and largely fruitless and the following organizations and movements withdrew from the climate conference in protest: ‘Aksyon Klima Pilipinas‘, ‘ActionAid‘, ‘Bolivian Platform on Climate Change‘, ‘Construyendo Puentes‘ (Latin America), ‘Friends of the Earth‘ (Europe), ‘Greenpeace‘, ‘Ibon International‘, ‘International Trade Union Confederation‘, ‘LDC Watch‘, ‘Oxfam International‘, ‘Pan African Climate Justice Alliance‘, ‘Peoples’ Movement on Climate Change‘ (Philippines) and ‘WWF‘.
First step to understanding the inherent conflicts of interest in the COP process would be to examine the nature of the COP country groups (submission groups) – a detailed study of the complex negotiating proces is another matter.

54 countries with incomplete data
2013
199 countries are included in ClimatePositions (Excel) but 54 countries have incomplete data (0.5% of the Global Population). The front image shows the 20 largest CO2 Emitters (carbon dioxide) per capita in 2011 among the 54 countries. Without full data it is not possible to calculate the national Climate Contribution (climate debt). See the country list below with the missing data mentioned in brackets. Notes that the national Contributions can be estimated by using indicator assumptions – see an example with Bahrain in the bottom.