Denmark: Per Capita Climate Debt $1,057 (Ranked 48) – Fossil CO2 Emissions
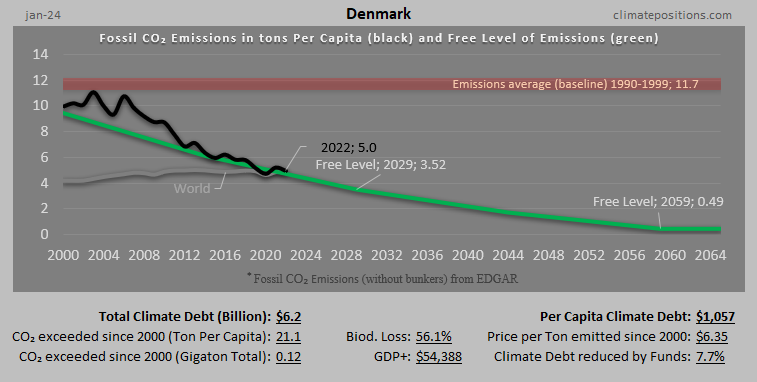
In 2024, Denmark is responsible for 0.08% of the Global Climate Debt accumulated since 2000. Below are some key figures in the calculations.

Belgium – per capita Fossil CO2 Emissions and Climate Debt
2020
Belgium’s current Climate Breakdown Pricing amounts to $22.93 per tons Fossil CO2 emitted since 2000. The Climate Debt grew from $2,025 per capita in 2015 to $4,490 in 2020. Updated Rankings of 165 countries are available in the menu “Climate Debt”.
The following diagrams expose the trends of Fossil CO2 Emissions, Climate Debt, GDP(ppp-$), Nuclear Power and Ecological Footprint without carbon.

The Netherlands – per capita Fossil CO2 Emissions and Climate Debt
2020
The current Climate Breakdown Pricing of the Netherlands amounts to $24.59 per tons Fossil CO2 emitted since 2000. The Climate Debt grew from $2,316 per capita in 2015 to $4,918 in 2020. Updated Rankings of 165 countries are available in the menu “Climate Debt”.
The following diagrams expose the trends of Fossil CO2 Emissions, Climate Debt, GDP(ppp-$) and Ecological Footprint without carbon.

United Kingdom – per capita Fossil CO2 Emissions and Climate Debt
2020
The current Climate Breakdown Pricing of the United Kingdom amounts to $11.17 per tons Fossil CO2 emitted since 2000. The Climate Debt grew from $871 per capita in 2015 to $1,614 in 2020. Updated Rankings of 165 countries are available in the menu “Climate Debt”.
The following diagrams expose the trends of Fossil CO2 Emissions, Climate Debt, GDP(ppp-$), Nuclear Power and Ecological Footprint without carbon.
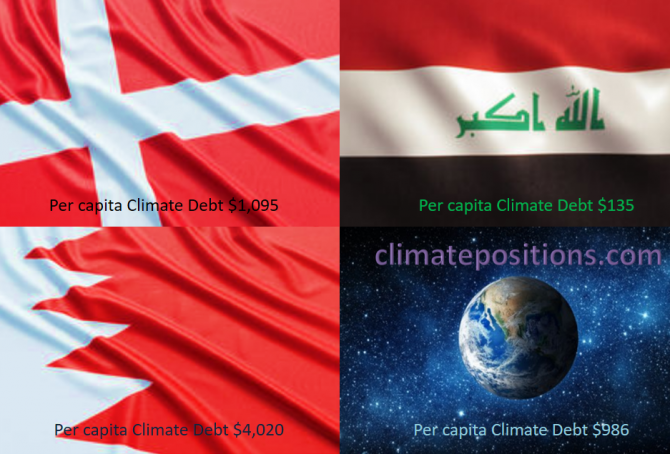
Share of global Climate Debt rank 52nd, 53rd and 54th: Denmark, Bahrain and Iraq (combined responsible for 0.24% of Climate Debt and 0.63% of Fossil CO2 Emissions 2016)
2018
The diagram below shows ‘Share of global Climate Debt‘ in 2010, 2015 and 2017 of Denmark, Bahrain and Iraq (ranked 52nd, 53rd and 54th). The shares of Bahrain and Iraq have increased significantly (Iraq had no Climate Debt in 2010), whereas Denmark’s share is relatively stable.
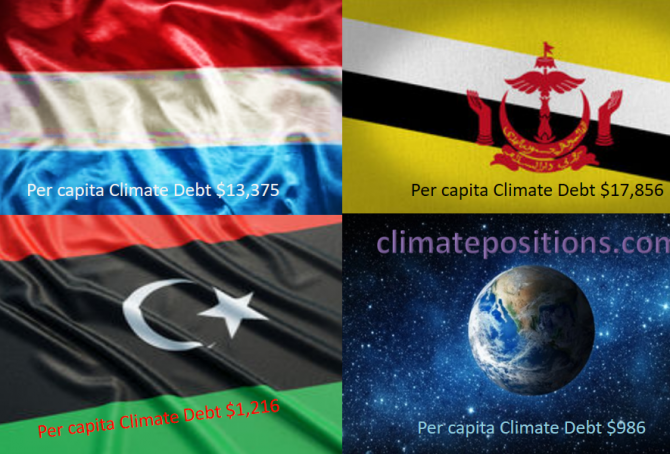
Share of global Climate Debt rank 49th, 50th and 51st: Luxembourg, Libya and Brunei (combined responsible for 0.32% of Climate Debt and 0.20% of Fossil CO2 Emissions 2016)
2017
The diagram below shows ‘Share of global Climate Debt‘ in 2010, 2015 and 2017 of Luxembourg, Libya and Brunei (ranked 49th, 50th and 51st). The shares of Luxembourg and especially Libya are decreasing, whereas Brunei’s share is increasing.
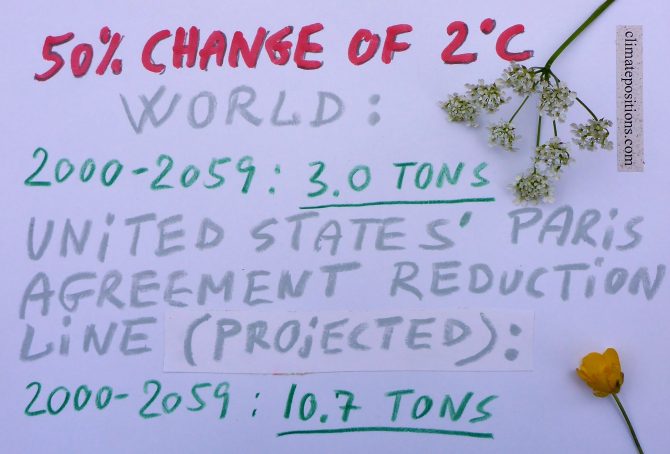
World CO2 Emissions 2000-2059: with 50% risk of 2C global warming (two per capita emission-scenarios for the United States, Denmark, Spain, China, India and Nigeria)
2017
In continuation of the previous article ‘Carbon Brief: Global Carbon Budget and CO2 Emission scenarios (50% risk of 1.5°C, 2.0°C and 3.0°C warming)‘, the following examines the per capita CO2 Emission budget 2000-2059, with a 50% risk of 2°C global warming (which of course is unacceptable). The outcome is then compared with Climate Debt Free CO2 Emission levels (in ClimatePositions) of the United States, Denmark, Spain, China, India and Nigeria, during the same 60-year period. Also, the Paris Agreements reduction commitment of the United States is put into perspective.
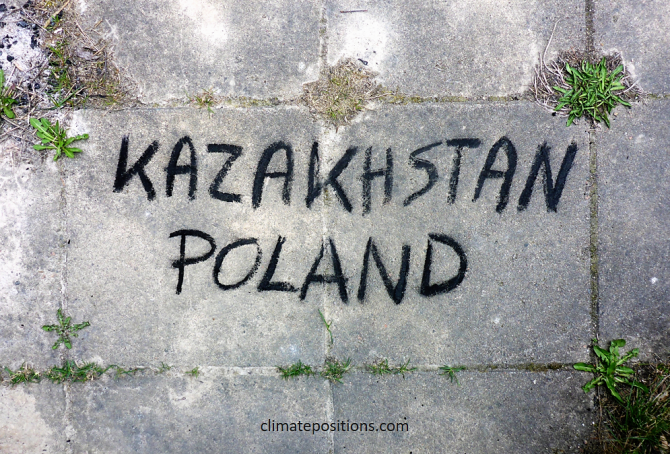
Climate change performance: Kazakhstan vs. Poland
2017
In 2015 Kazakhstan and Poland were the world’s 2nd and 4th largest per capita coal producers. No wonder, the two countries, inhabited by 0.76% of the global population, emitted as much as 1.58% of the CO2 from Fossil Fuels (without bunkers) and cement.
The diagrams below show the per capita CO2 Emissions from Fossil Fuels (without bunkers) and cement, annually since 2000. The green bars show the Free Emission Level¹ – the exceedance is the basis for calculating the national Climate Debt.

Climate Debt: Norway ranks 9th (performance of top twenty from Human Development Index)
The so called ‘Human Development Index 2015’ (UN) ranks Norway 1st among 188 countries. The index is based on 1) Life expectancy at birth, 2) Expected years of schooling, 3) Mean years of schooling and 4) Gross national income (GNI) per capita. However, the wealthy Scandinavian oil state ‘Ranks‘ 9th among 148 countries on Climate Debt per capita. Norway is in other words a highly human developed demolisher of the climate, one might say! The following examines the climate performance of Norway in comparison with the other top five countries from Human Development Index: Australia, Switzerland, Denmark and Netherland.
Slowdown of Denmark’s accumulating Climate Debt, but..!
2015
Denmark’s updated Climate Debt is $806 per capita. In the latest ‘ranking’ the Scandinavian country is 41st out of 147 countries (where no. 1 is worst) and is often referred to as a green transition pioneer. However, according to various rankings and surveys the picture is somewhat more complicated:
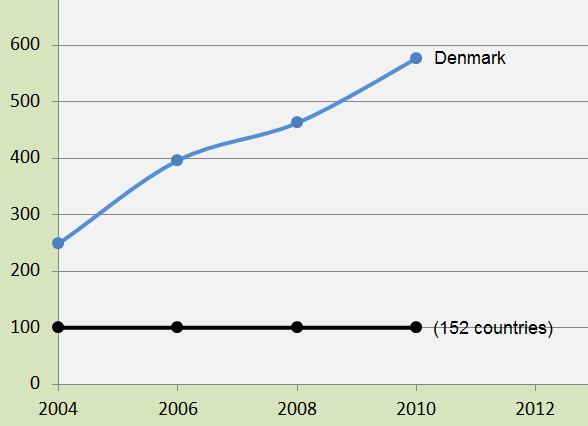
- Denmark’s per capita ‘Ecological Footprint’ – without carbon emissions – is the largest among 152 countries.
- Denmark is ranked 1st among 29 countries (those with data) on organic (ecological) share of all domestic sales¹.
- In the ‘Climate Change Performance Index’ (from Germanwatch and Climate Action Network Europe) Denmark performs best of 58 countries.
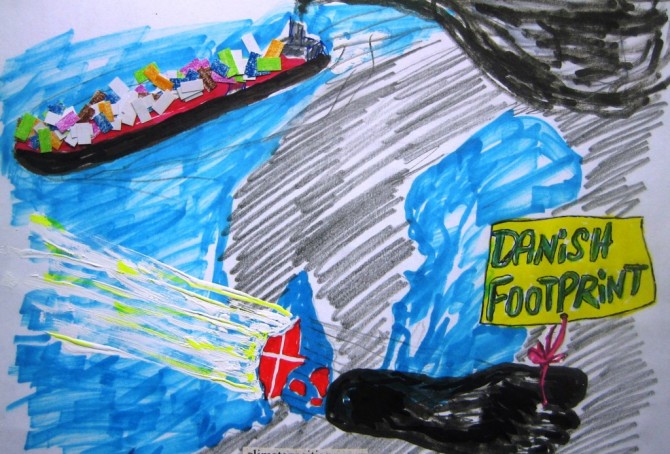
- CO2 Emissions would be around 46% higher than the usual statistics show, if emissions from Danish-controlled overseas ships, sailing goods around the world, were included² (in 2011 the Danish per capita CO2 Emissions would be around 15.0 tons instead of 8.2 tons).
- In addition, Denmark’s CO2 Emissions would be around 18% higher (in 1996-2009), than the usual statistics show, if emissions were consumption-based³ (inclusive CO2 Emissions from the production of imported goods) instead of production-based (inclusive CO2 Emissions from domestic production of goods for export).
However, the following examines only the indicators of CO2 Emissions from fossil fuels (production-based and without emissions from overseas ships), GDP(ppp-$) and Ecological Footprint without carbon emissions.
Climate Change Performance Index 2013
2013
‘Climate Change Performance Index 2013’ is a ranking of 58 countries that was published recently by ‘Germanwatch’ and ‘Climate Action Network Europe’ – with the help of over 230 experts worldwide. 80% of the evaluation is based on indicators of emissions (30% for emissions levels and 30% for recent development of emissions), efficiency (5% level of efficiency and 5% recent development in efficiency) and renewable energy (8% recent development and 2% share of total primary energy supply). For the first time emissions from deforestation is included. The remaining 20% of the evaluation is based on national and international climate policy assessments by experts from the respective countries.
Denmark’s embarrassingly large Ecological Footprint
2013
Denmark did well according to ClimatePositions until 2002, where the Climate Contribution (climate debt) was $0, but under the liberal-conservative government 2001-2011 the performance deteriorated. Denmark was the 55th worst performing country out of 145 in 2005 and the 33rd in 2010.