
Preliminary Carbon Dioxide Emissions 2014, by country
2015
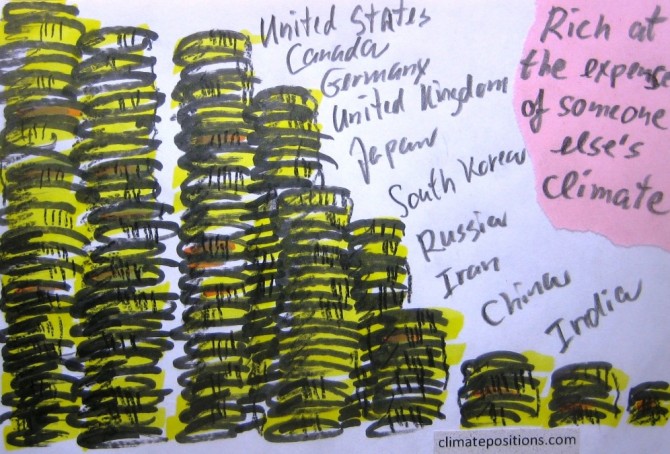
’The Global Carbon Project’ at Carbon Dioxide Information Analysis Center (CDIAC) has published preliminary CO2 Emissions from fossil fuels and cement for 2014, for more than 200 countries. The data is being used in a preliminary calculation of accumulated Climate Debt in ClimatePositions¹. The table below shows the estimated per capita emissions plus the updated Climate Debts, of the twenty largest total emitters (responsible for 77% of the global emissions in 2014).
Analyses of the global CO2 target and GDP(ppp-$)
2015
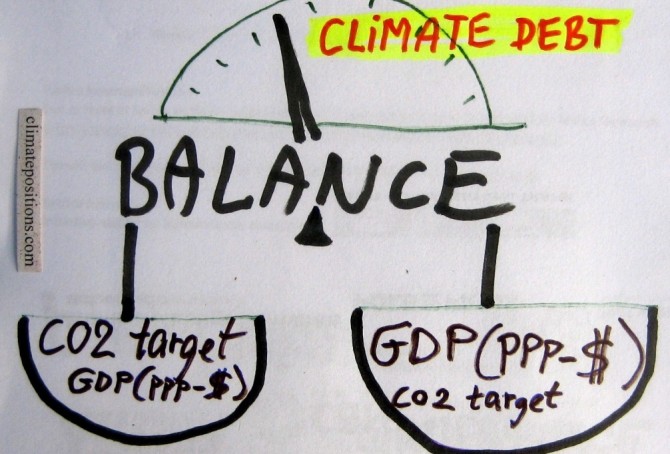
The calculation of Climate Debt in ClimatePositions is based on a balance between many ‘indicators’ and a common global per capita CO2 target. To illustrate the nature of this balance twelve countries are analyzed in this article in terms of the indicator of GDP(ppp-$) and the global CO2 target. The 12-Countries Group represents 38% of the global population, 65% of the global CO2 Emissions from fossil fuels and around 70% of the global Climate Debt.

The United Kingdom beats Germany in climate change performance
2014
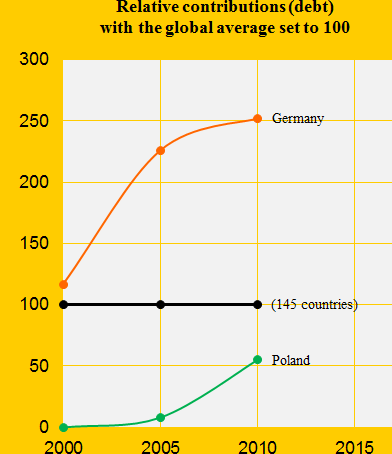
Germany is ranked 24th and United Kingdom 33rd among 147 countries on the list of the worst performing countries in ClimatePositions. See the ‘ranking’. The German Climate Contribution (debt) accumulated since 2000 has increased from $980 per capita in 2010 to $1,640 in the latest calculation, while the one of the United Kingdom has increased from $796 to $1,156. The first diagram shows the relative climate debt of the two countries in comparison with France, Italy and Poland, with the world average set at 100. Since 2010, the United Kingdom is the only country among the five that has improved significantly. The world average climate debt has increased from $455 per capita in 2010 to $769 in the latest calculation (this increase reflects both the growing CO2 Emissions from fossil fuels and the growing economy). The following analyses some trends for Germany and the United Kingdom.
New ranking 2014 – update of 147 countries’ climate debt
2014
The data in ClimatePositions are updated consecutively and since the data year 2010 the eleven ‘indicators’ have all been updated.
The new rankings of 147 countries are now available in the menu “Contributions” (with six categories).
All country data and diagrams are available in the menu ‘Calculations (Excel)’. In the coming months selected countries will be analyzed in articles. The following illustrates the latest updates in two ways: 1) The change of climate debt as a percentage of the global climate debt of the twelve largest CO2 emitters, and 2) The key-figures of the United Kingdom.
Income Equality, Life Expectancy, Democracy Index … and Climate Contributions
2014
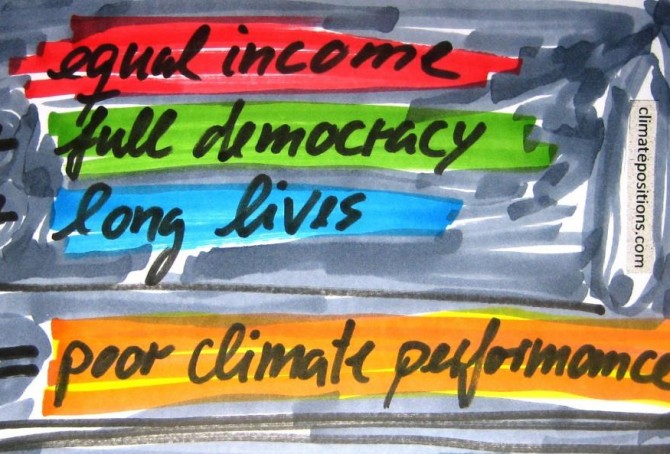
123 out of 145 countries with full data in ClimatePositions are included in an inventory of Income Equality (see the source at the bottom), which shows how much the 10% poorest earns compared to the 10% richest. 53 out of the 123 countries are Contribution Free (no climate debt) in ClimatePositions 2010 and 70 countries are not.
The table below shows the difference between the two groups of countries in terms of Income Equality, Life Expectancy, number of Full Democracies and number of Authoritarian Regimes. To clarify the trend the 20 countries with the largest Climate Contributions appear at the top of the table. The 123 countries represent 95% of the world population.
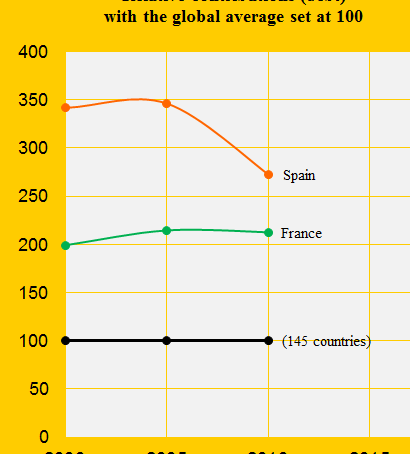
Climate performance: France versus Spain
2013
France was the 26th and Spain the 23rd worst performing country out of 145 in ClimatePositions 2010. As illustrated in the above diagram, the difference in the Contributions (climate debt) has narrowed between 2005 and 2010. Both countries have improved three rankings since 2005. See the full country list in the menu “Contributions/Per Capita US$ Rank”. The following examines the CO2 Emissions, forest area, GDP(ppp-$) and the world’s shares (Population, CO2 Emissions, GDP and Climate Contributions) of the two countries.
Climate Contributions as a percentage of GDP for the top ten CO2 Emitters
2013
The top ten CO2 Emitters were responsible for 67% of the global CO2 Emissions in 2006-2010. Adjusting the national Contributions (climate debt) for the size of the GDP(ppp-$) is essential. Allowing the wealthy United States get away with paying the same dollar price of a ton of CO2 (carbon dioxide) exceeded as China is of course absurd. The countries’ climate change performances are measured indirectly as the Contributions’ percentage of the national GDP(ppp-$).
Climate performance: Germany versus Poland
2013
Germany was the 24th worst performing country out of 145 in ClimatePositions 2010 and Poland was the 46th. Five years earlier in 2005 the rankings were respectively 23th and 66th. The diagram shows the performance relatively with the global average set at 100. Germany has performed continuous irresponsible, though slightly less irresponsible in recent years and Poland seems to have given up all the good intentions around 2003. Below we highlight three of the national indicators in the calculations.

Putin’s Russia is deteriorating ecologically
2013
Russia was the world’s third largest CO2 Emitter (carbon dioxide) in 2006-2010 and the authoritarian regime was the 31st worst performing country in ClimatePositions 2010. In 2005 the ranking was 34th and in 2000 43rd. The negative development under Putin is unquestionable.
European Union perform poorly
2013
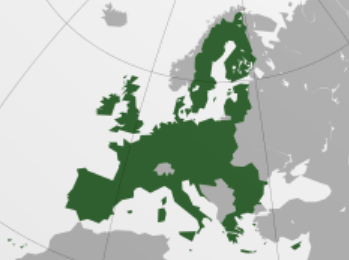
The map (from Wikipedia) shows the very different countries in ‘European Union‘ (EU). As a whole EU perform poorly on the climate challenge and only Romania was Contribution Free in ClimatePositions 2010. Both Netherlands and Belgium are among the top 10 worst performing countries in the world. Se the EU rank at the end and the global ranking in the menu “Contributions/Per Capita US$ Rank”).