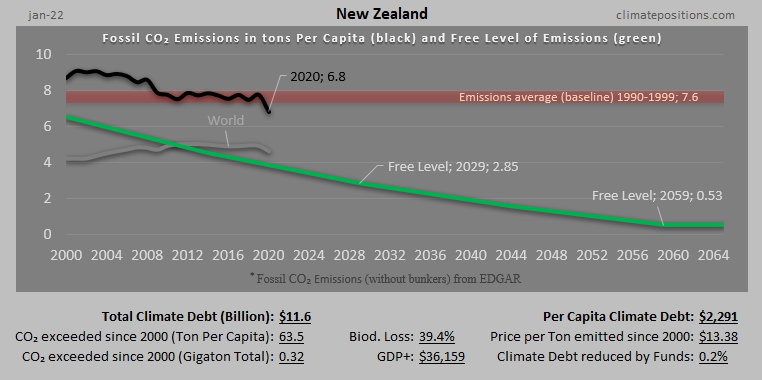
New Zealand: Per Capita Climate Debt $2,752 (Ranked 21) – Fossil CO2 Emissions

In 2024, New Zealand is responsible for 0.18% of the Global Climate Debt accumulated since 2000. Below are some key figures in the calculations.

Malaysia – per capita Fossil CO2 Emissions and Climate Debt
2020
Malaysia’s current Climate Breakdown Pricing amounts to $20.82 per tons Fossil CO2 emitted since 2000. The Climate Debt grew from $1,454 per capita in 2015 to $2,902 in 2020. Updated Rankings of 165 countries are available in the menu “Climate Debt”.
The following diagrams expose the trends of Fossil CO2 Emissions, Climate Debt, GDP(ppp-$) and Ecological Footprint without carbon.
Australia – per capita Fossil CO2 Emissions and Climate Debt
2020
Australia’s current Climate Breakdown Pricing amounts to $32.40 per tons Fossil CO2 emitted since 2000. The Climate Debt grew from $6,547 per capita in 2015 to $11,256 in 2020. Updated Rankings of 165 countries are available in the menu “Climate Debt”.
The following diagrams expose the trends of Fossil CO2 Emissions, Climate Debt, GDP(ppp-$) and Ecological Footprint without carbon.
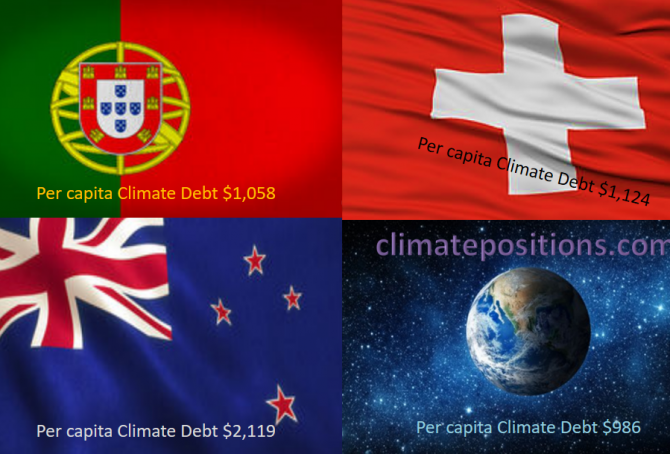
Share of global Climate Debt rank 43rd, 44th and 45th: Portugal, New Zealand and Switzerland (combined responsible for 0.42% of Climate Debt and 0.34% of Fossil CO2 Emissions 2016)
2017
The diagram below shows ‘Share of global Climate Debt‘ in 2010, 2015 and 2017 of Portugal, New Zealand and Switzerland (ranked 43rd, 44th and 45th). The shares of Portugal and New Zealand are decreasing, whereas the Swiss share is stable.
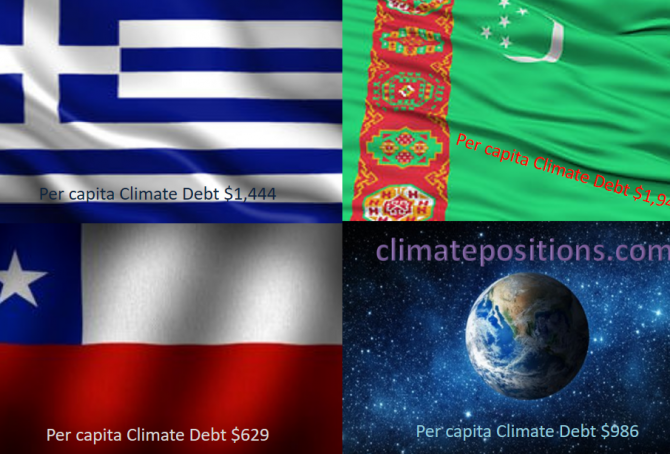
Share of global Climate Debt rank 40th, 41st and 42nd: Greece, Chile and Turkmenistan (combined responsible for 0.52% of Climate Debt and 0.64% of Fossil CO2 Emissions 2016)
2017
The diagram below shows ‘Share of global Climate Debt‘ in 2010, 2015 and 2017 of Greece, Chile and Turkmenistan (ranked 40th, 41st and 42nd). The share of Greece is decreasing, while the shares of Chile and Turkmenistan are increasing.

Climate change performance: Malaysia vs. Spain
2017
Malaysia and Spain are the world’s 23rd and 24th largest emitters of CO2 from Fossil Fuels and cement. Combined, the two countries were responsible for 1.4% of world CO2 Emissions in 2015. The following examines the ‘Indicators‘ of CO2 Emissions, GDP(ppp-$), Forest Cover (and Primary Forest) and Environmental Performance.
The diagrams below show the per capita CO2 Emissions from Fossil Fuel (without bunkers) and cement, since 2000. The green bars show the Free Emission Level¹ – the exceedance is the basis for calculating the national Climate Debt. The Spanish reductions are pretty much balanced by the Malaysian increases … which is world symptomatic.
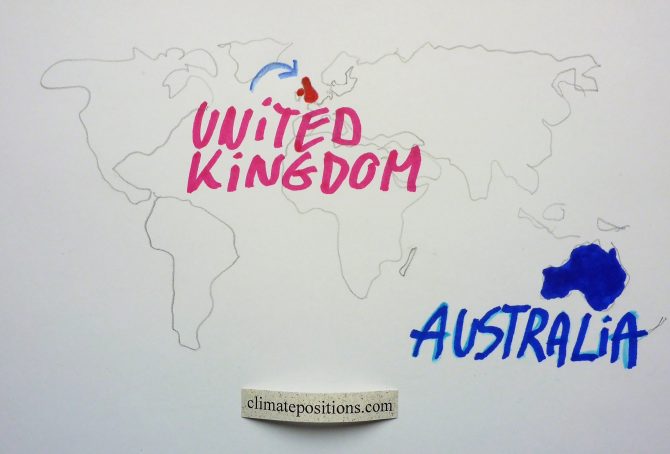
Climate change performance: The United Kingdom vs. Australia
2017
The United Kingdom and Australia and are the world’s 15th and 16th largest emitters of CO2 from Fossil Fuels and cement. Combined, the two countries were responsible for 2.2% of world CO2 Emissions in 2015. The following examines the ‘Indicators’ of CO2 Emissions, GDP(ppp-$) and Ecological Footprint (without carbon footprint).
The diagrams below show the per capita CO2 Emissions from Fossil Fuel (without bunkers) and cement, since 2000. The green bars show the Free Emission Level¹ – the exceedance is the basis for calculating the national Climate Debt.

Climate Debt: Norway ranks 9th (performance of top twenty from Human Development Index)
The so called ‘Human Development Index 2015’ (UN) ranks Norway 1st among 188 countries. The index is based on 1) Life expectancy at birth, 2) Expected years of schooling, 3) Mean years of schooling and 4) Gross national income (GNI) per capita. However, the wealthy Scandinavian oil state ‘Ranks‘ 9th among 148 countries on Climate Debt per capita. Norway is in other words a highly human developed demolisher of the climate, one might say! The following examines the climate performance of Norway in comparison with the other top five countries from Human Development Index: Australia, Switzerland, Denmark and Netherland.
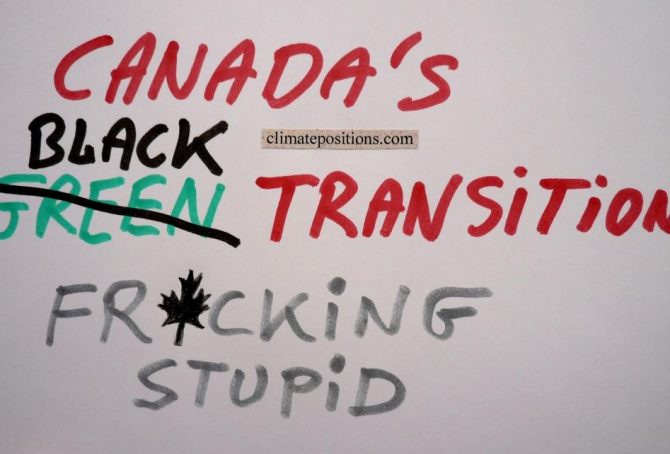
Canada now ranks 10th in Climate Debt per capita (due to black transition)
Canada covers 7.3% of planet’s land area and populates 0.5% of its people. The Climate Debt of the 35 million Canadians amounts to $183 billion, or $5,138 per capita, which ‘Ranks’ Canada 10th among 148 countries. In 2010 the ranking was 7th. The following compares the Canadian performance with the ones of Australia, New Zealand, Sweden and Finland – all wealthy developed countries with small or relatively small population density¹.
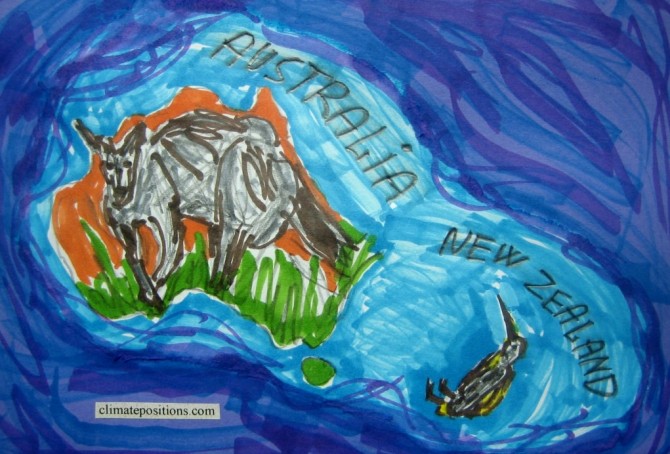
Climate change performance: Australia vs. New Zealand
2015
The two diagrams below show Australia’s and New Zealand’s CO2 Emissions from fossil fuels per capita in decades. The green bars show the Contribution Free Level and the grey bars are the world average. The average Australian per capita emissions were 16.7 tons in 1990s and 19.7 tons in 2000-2012 (18% increase). The corresponding figures of New Zealand were 8.7 tons and 9.5 tons (10% increase).
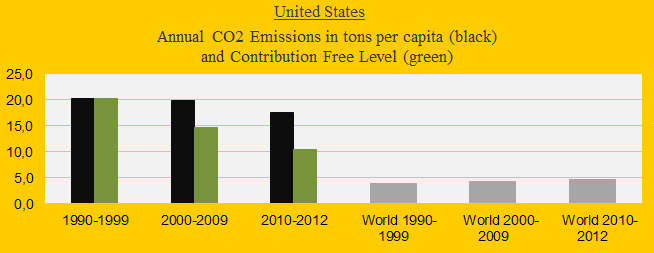
Climate change performance of the United States 2000-2013 (and the new emission target)
2014
Last week the United States ‘agreed’ with China to reduce US greenhouse gas emissions between 26% and 28% from the 2005-level by 2025. The agreement is legally non-binding and without the support of the Republicans. The following analyze the new US emission target (in the bottom) and the general performance in comparison with the spying buddies in Five Eyes Alliance¹: Canada, Australia, New Zealand and United Kingdom.
The United States is presently ranked 10th out of 147 countries in Climate Contribution (climate debt) per capita. See the ‘ranking’. The US ‘share of the global Climate Contributions’ is now 37.0%, compared to 40.7% in 2010. The first diagram shows the CO2 Emissions per capita in decades in comparison with the world average. The green bars are the Contribution Free Level, determined by the level of CO2 Emissions in the 1990s and the eleven ‘indicators’. The declining US share of the global climate debt is mainly due to reduced CO2 Emissions while the global emissions have increased.

Five Eyes Alliance is watching you
2013
Australia, Canada, New Zealand, United Kingdom and United States are secretly watching private mails, phone calls etc. worldwide – secretly until Snowden whistled. All five countries’ are defined as Full Democracies but the self-righteous surveillance activities take place in the closed Five Eyes Alliance (see ‘UKUSA Agreement‘ and ‘Echelon‘) with United States (read NSA) as Big Brother.

Australia perform worst of democratic countries
2013
Australia was the 6th worst performing country in the world in ClimatePositions 2010 with a Climate Contribution of $4,387 per capita. In the latest calculation it had increased to $5,081. The total national Contribution (climate debt) is now 109 billion US$. Since no country in top 5 is Full Democracies, Australia is the worst performing democratic country. It can be assumed that the majority of the Australian voters are pleased with this destructive approach to the planet.