Colombia – per capita Fossil CO2 Emissions (zero Climate Debt)
2020
Although Colombia’s accumulated Climate Debt is zero, the country is the world’s 45th largest emitter of Fossil CO2.
The following diagrams expose the trends of Fossil CO2 Emissions, GDP(ppp-$), Forest Cover, Primary Forest and Environmental Performance.
Bangladesh – per capita Fossil CO2 Emissions (zero Climate Debt)
2020
Although the accumulated Climate Debt of Bangladesh is zero, the populous country is the world’s 43rd largest emitter of Fossil CO2.
The following diagrams expose the trends of Fossil CO2 Emissions, GDP(ppp-$), Environmental Performance and Population.
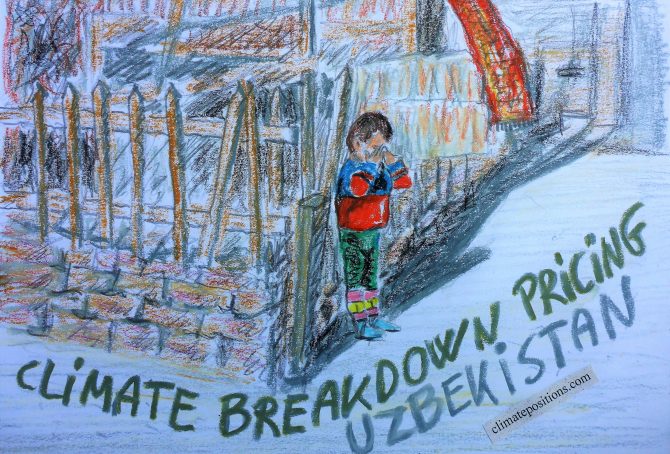
Uzbekistan – per capita Fossil CO2 Emissions and Climate Debt
2020
Uzbekistan’s current Climate Breakdown Pricing amounts to $1.20 per tons Fossil CO2 emitted since 2000. The Climate Debt grew from $43 per capita in 2015 to $93 in 2020. Updated Rankings of 165 countries are available in the menu “Climate Debt”.
The following diagrams expose the trends of Fossil CO2 Emissions, Climate Debt, GDP(ppp-$) and Environmental Performance.
Nigeria – per capita Fossil CO2 Emissions (zero Climate Debt)
2020
Although Nigeria’s accumulated Climate Debt is zero, the populous country is the world’s 38th largest emitter of Fossil CO2.
The following diagrams expose the trends of Fossil CO2 Emissions, GDP(ppp-$), Environmental Performance, Forest Cover and Primary Forest.
Pakistan – per capita Fossil CO2 Emissions (zero Climate Debt)
2020
Although Pakistan’s accumulated Climate Debt is zero, the populous country is the world’s 32nd largest emitter of Fossil CO2.
The following diagrams expose the trends of Fossil CO2 Emissions, GDP(ppp-$), Environmental Performance and Ecological Footprint without carbon.
Taiwan – per capita Fossil CO2 Emissions and Climate Debt (estimated)
2020
Due to lack of some indicator data from the ‘sources‘ Taiwan is not ranked in ClimatePositions. However, by estimating the indicator values of GDP(ppp-$)¹, Forest Cover² and Ecological Footprint³, then the calculation of Taiwan’s Climate Debt can still be made with some accuracy.
With the noted indicator assumptions, then the Taiwanese current Climate Breakdown Pricing amounts to $40 per tons Fossil CO2 emitted since 2000, and the per capita Climate Debt amounts to $8,800 in 2020. For comparison, updated Rankings of 165 countries with full data are available in the menu “Climate Debt” (Taiwan ranks 13th).
The following diagrams expose the trends of Fossil CO2 Emissions, Nuclear Power and Environmental Performance.
Indicator update: Environmental Performance Index 2018
2018
The Environmental Performance Index 2018 ranks 180 countries on 24 performance indicators across 10 issue categories¹ covering A) Environmental Health (40%), which measures threats to human health, and B) Ecosystem Vitality (60%), which measures natural resources and ecosystem services. Over the years the Environmental Performance Index (EPI) has also identified a number of severe data gaps² that hamper sustainability goals.
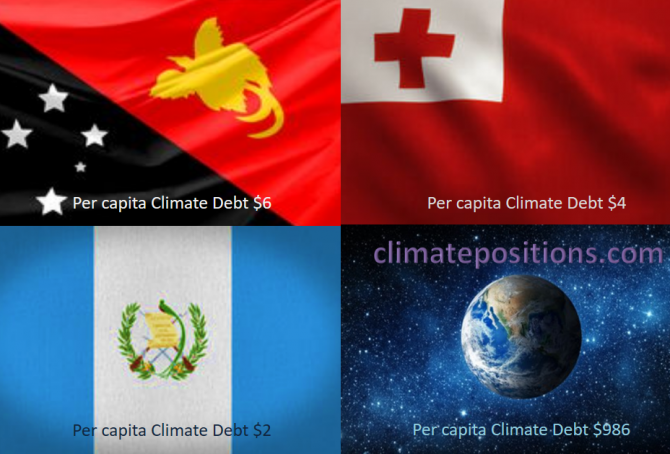
Share of global Climate Debt rank 88th, 89th and 90th: Papua New Guinea, Guatemala, Tonga (combined responsible for 0.001% of Climate Debt and 0.078% of Fossil CO2 Emissions 2016)
2018
The diagram below shows ‘Share of global Climate Debt‘ in 2010, 2015 and 2017 of Papua New Guinea, Guatemala and Tonga (ranked 88th, 89th and 90th). All three countries had zero Climate Debt in 2010, Tonga even in 2015.
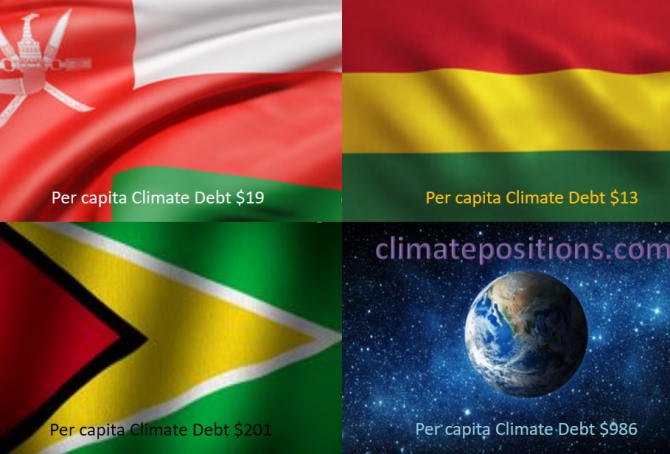
Share of global Climate Debt rank 85th, 86th, and 87th: Honduras, Guyana and Bolivia (combined responsible for 0.006% of Climate Debt and 0.090% of Fossil CO2 Emissions 2016)
2018
The diagram below shows ‘Share of global Climate Debt‘ in 2010, 2015 and 2017 of Honduras, Guyana and Bolivia (ranked 85th, 86th, and 87th). The share of Honduras decreased significantly during the period. The global Climate Debt accumulated since 2000 is $7.2 Trillion.
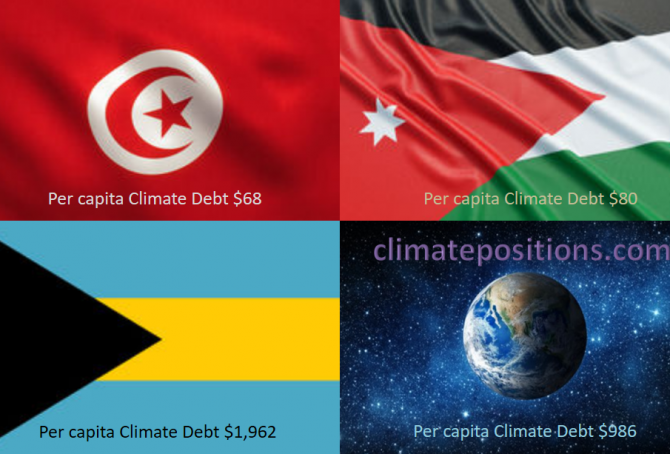
Share of global Climate Debt rank 76th, 77th and 78th: Tunisia, Bahamas and Jordan (combined responsible for 0.03% of Climate Debt and 0.16% of Fossil CO2 Emissions 2016)
2018
The diagram below shows ‘Share of global Climate Debt‘ in 2010, 2015 and 2017 of Tunisia, Bahamas and Jordan (ranked 76th, 77th and 78th). The share of Tunisia is continuously declining, whereas the shares of Bahamas and Jordan are uneven.
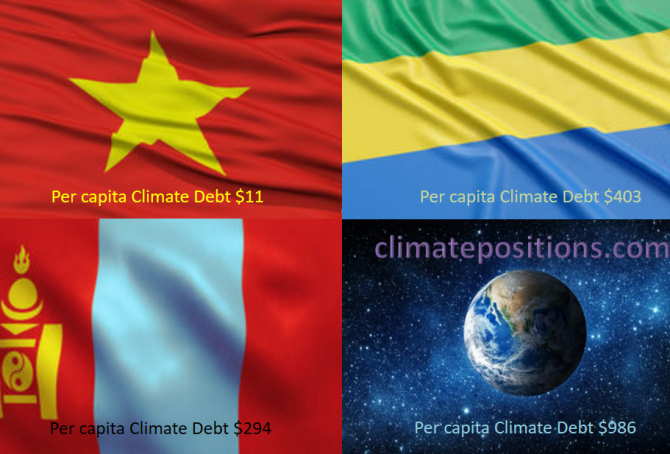
Share of global Climate Debt rank 73rd, 74th and 75th: Vietnam, Mongolia and Gabon (combined responsible for 0.04% of Climate Debt and 0.64% of Fossil CO2 Emissions 2016)
2018
The diagram below shows ‘Share of global Climate Debt‘ in 2010, 2015 and 2017 of Vietnam, Mongolia and Gabon (ranked 73rd, 74th and 75th). The shares of Vietnam and Mongolia are both growing continuously. Vietnam and Gabon had zero Climate Debt in 2010.
Share of global Climate Debt rank 70th, 71st and 72nd: Equatorial Guinea, Panama and Dominican Republic (combined responsible for 0.05% of Climate Debt and 0.10% of Fossil CO2 Emissions 2016)
2018
The diagram below shows ‘Share of global Climate Debt‘ in 2010, 2015 and 2017 of Equatorial Guinea, Panama and Dominican Republic (ranked 70th, 71st and 72nd). The share of Panama is continuously growing, whereas the shares of Equatorial Guinea and Dominican Republic are uneven.
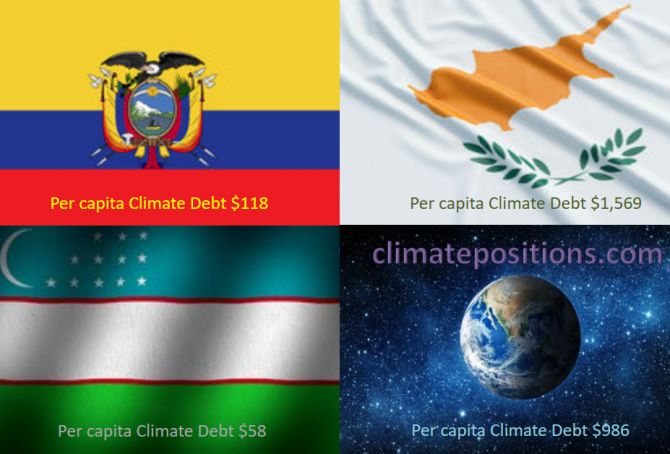
Share of global Climate Debt rank 67th, 68th and 69th: Ecuador, Uzbekistan and Cyprus (combined responsible for 0.08% of Climate Debt and 0.44% of Fossil CO2 Emissions 2016)
2018
The diagram below shows ‘Share of global Climate Debt‘ in 2010, 2015 and 2017 of Ecuador, Uzbekistan and Cyprus (ranked 67th, 68th and 69th). The share of Cyprus is continuously decreasing.
Share of global Climate Debt rank 64th, 65th and 66th: Bosnia and Herzegovina, Romania and Lebanon (combined responsible for 0.10% of Climate Debt and 0.35% of Fossil CO2 Emissions 2016)
2018
The diagram below shows ‘Share of global Climate Debt‘ in 2010, 2015 and 2017 of Bosnia and Herzegovina, Romania and Lebanon (ranked 64th, 65th and 66th). The shares of Romania and Lebanon are ups and downs, while the share of Bosnia and Herzegovina is steadier.
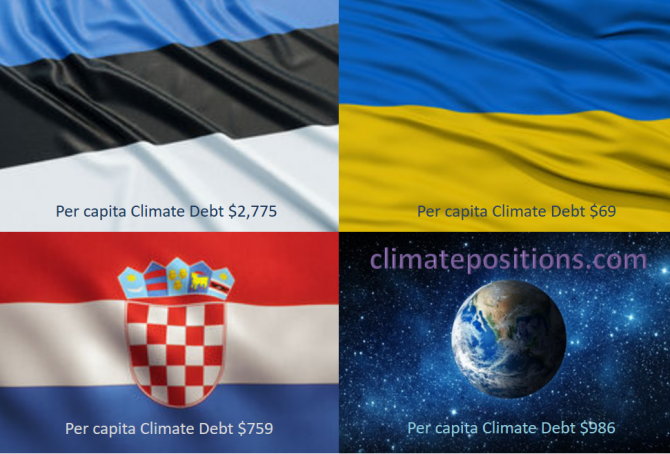
Share of global Climate Debt rank 61st, 62nd and 63rd: Estonia, Croatia and Ukraine (combined responsible for 0.14% of Climate Debt and 0.77% of Fossil CO2 Emissions 2016)
2018
The diagram below shows ‘Share of global Climate Debt‘ in 2010, 2015 and 2017 of Estonia, Croatia and Ukraine (ranked 61st, 62nd and 63rd). The shares of Estonia and Ukraine are increasing, whereas the share of Croatia is decreasing.
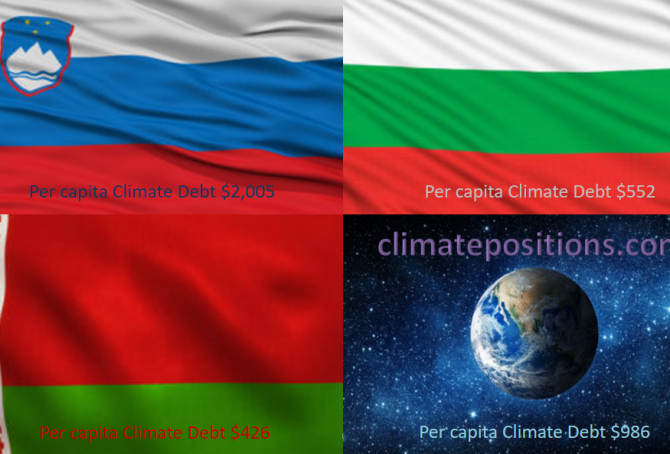
Share of global Climate Debt rank 58th, 59th and 60th: Slovenia, Belarus and Bulgaria (combined responsible for 0.17% of Climate Debt and 0.36% of Fossil CO2 Emissions 2016)
2018
The diagram below shows ‘Share of global Climate Debt‘ in 2010, 2015 and 2017 of Slovenia, Belarus and Bulgaria (ranked 58th, 59th and 60th). The share of Slovenia is decreasing, whereas the shares of Belarus and Bulgaria are increasing rather fast (Belarus had no Climate Debt in 2010).
Share of global Climate Debt rank 55th, 56th and 57th: Hungary, Slovakia and Serbia (combined responsible for 0.20% of Climate Debt and 0.41% of Fossil CO2 Emissions 2016)
2018
The diagram below shows ‘Share of global Climate Debt‘ in 2010, 2015 and 2017 of Hungary, Slovakia and Serbia (ranked 55th, 56th and 57th). The share of Serbia is decreasing, while the shares of Hungary and Slovakia are up and down.
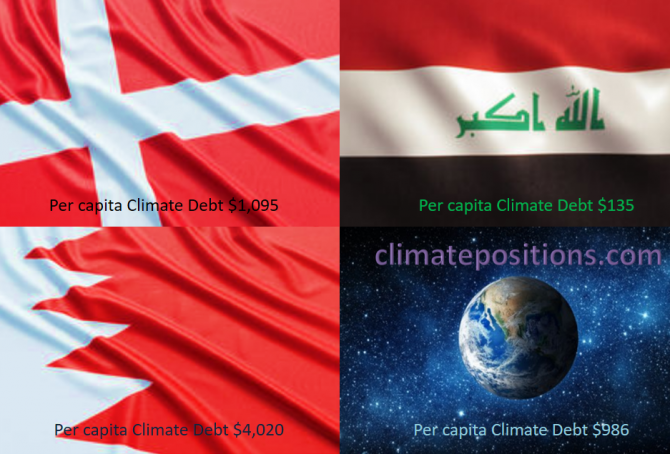
Share of global Climate Debt rank 52nd, 53rd and 54th: Denmark, Bahrain and Iraq (combined responsible for 0.24% of Climate Debt and 0.63% of Fossil CO2 Emissions 2016)
2018
The diagram below shows ‘Share of global Climate Debt‘ in 2010, 2015 and 2017 of Denmark, Bahrain and Iraq (ranked 52nd, 53rd and 54th). The shares of Bahrain and Iraq have increased significantly (Iraq had no Climate Debt in 2010), whereas Denmark’s share is relatively stable.


