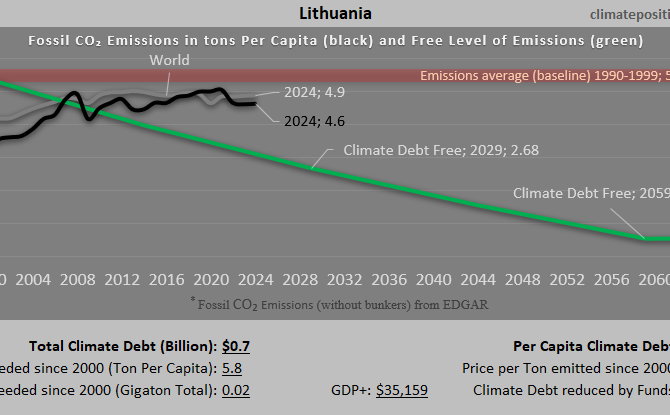
Climate Debt of Lithuania 2025: $656 Million or 0.007% of the Global Climate Debt (or $227 Per Capita)
/2025/ Lithuania ranks 73rd in Climate Debt Per Capita accumulated 2000-2025. Below are some key figures in the calculations. The diagram above shows the Fossil CO2 Emissions Per Capita and the Free Level of emissions (green). The wide straight red line shows emissions in the 1990s (baseline in the calculations).
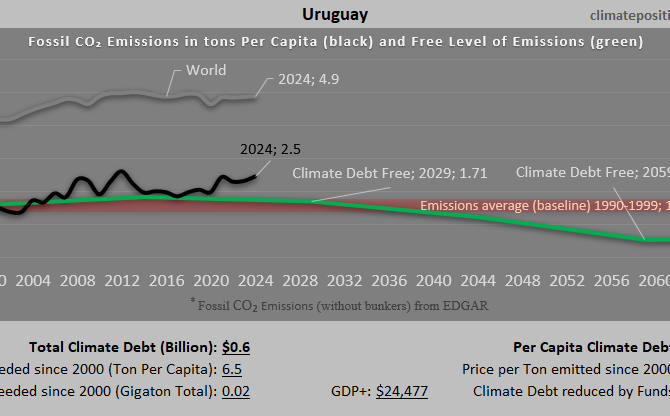
Climate Debt of Uruguay 2025: $599 Million or 0.006% of the Global Climate Debt (or $177 Per Capita)
/2025/ Uruguay ranks 77th in Climate Debt Per Capita accumulated 2000-2025. Below are some key figures in the calculations. The diagram above shows the Fossil CO2 Emissions Per Capita and the Free Level of emissions (green). The wide straight red line shows emissions in the 1990s (baseline in the calculations).
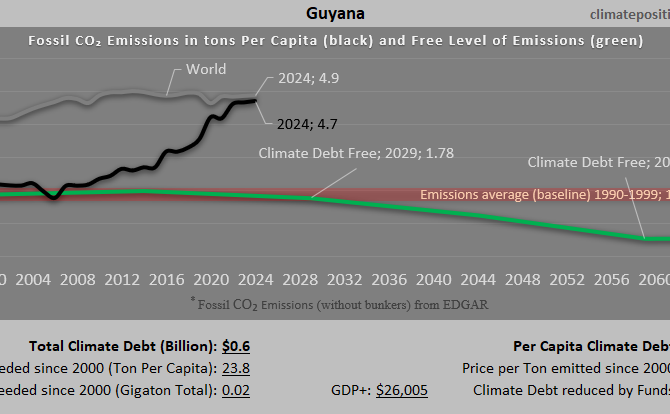
Climate Debt of Guyana 2025: $574 Million or 0.006% of the Global Climate Debt (or $687 Per Capita)
/2025/ Guyana ranks 58th in Climate Debt Per Capita accumulated 2000-2025. Below are some key figures in the calculations. The diagram above shows the Fossil CO2 Emissions Per Capita and the Free Level of emissions (green). The wide straight red line shows emissions in the 1990s (baseline in the calculations).
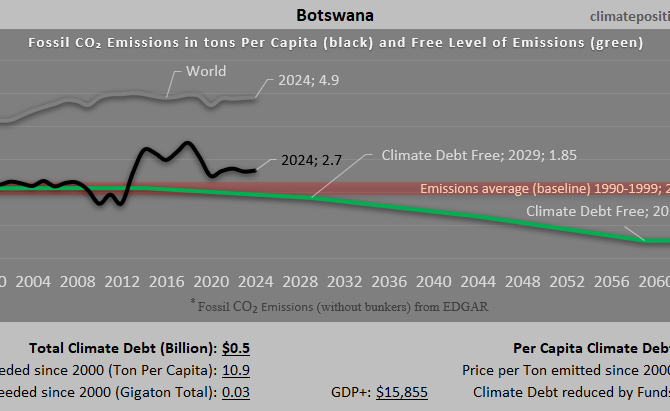
Climate Debt of Botswana 2025: $485 Million or 0.005% of the Global Climate Debt (or $193 Per Capita)
/2025/ Botswana ranks 76th in Climate Debt Per Capita accumulated 2000-2025. Below are some key figures in the calculations. The diagram above shows the Fossil CO2 Emissions Per Capita and the Free Level of emissions (green). The wide straight red line shows emissions in the 1990s (baseline in the calculations).
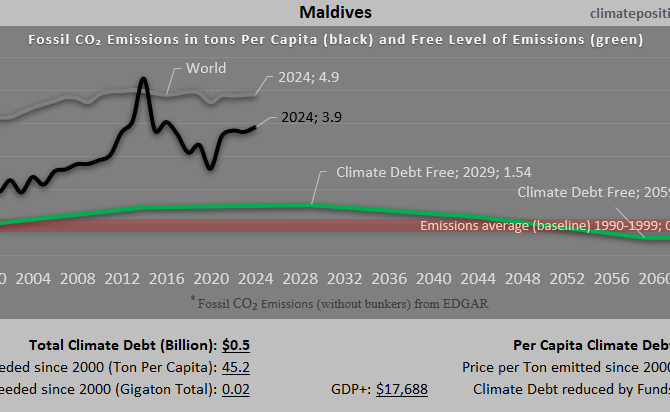
Climate Debt of Maldives 2025: $469 Million or 0.005% of the Global Climate Debt (or $888 Per Capita)
/2025/ Maldives ranks 51st in Climate Debt Per Capita accumulated 2000-2025. Below are some key figures in the calculations. The diagram above shows the Fossil CO2 Emissions Per Capita and the Free Level of emissions (green). The wide straight red line shows emissions in the 1990s (baseline in the calculations).
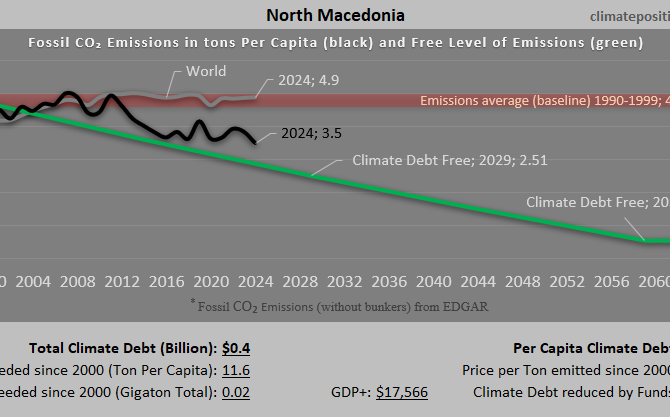
Climate Debt of North Macedonia 2025: $405 Million or 0.004% of the Global Climate Debt (or $226 Per Capita)
/2025/ North Macedonia ranks 74th in Climate Debt Per Capita accumulated 2000-2025. Below are some key figures in the calculations. The diagram above shows the Fossil CO2 Emissions Per Capita and the Free Level of emissions (green). The wide straight red line shows emissions in the 1990s (baseline in the calculations).
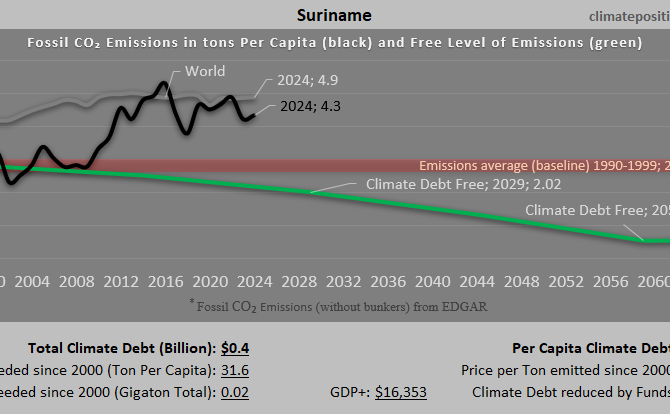
Climate Debt of Suriname 2025: $365 Million or 0.004% of the Global Climate Debt (or $575 Per Capita)
/2025/ Suriname ranks 62nd in Climate Debt Per Capita accumulated 2000-2025. Below are some key figures in the calculations. The diagram above shows the Fossil CO2 Emissions Per Capita and the Free Level of emissions (green). The wide straight red line shows emissions in the 1990s (baseline in the calculations).
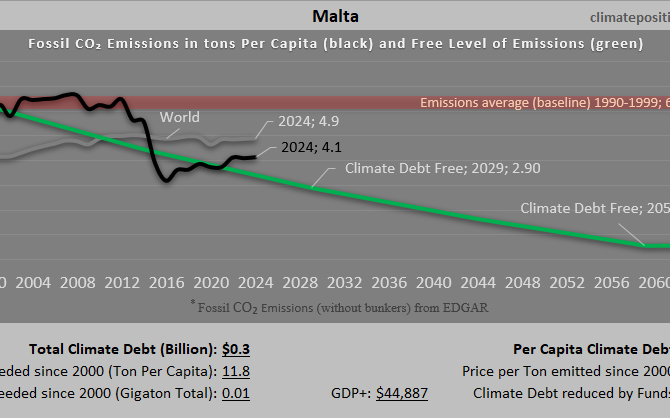
Climate Debt of Malta 2025: $336 Million or 0.004% of the Global Climate Debt (or $586 Per Capita)
/2025/ Malta ranks 61st in Climate Debt Per Capita accumulated 2000-2025. Below are some key figures in the calculations. The diagram above shows the Fossil CO2 Emissions Per Capita and the Free Level of emissions (green). The wide straight red line shows emissions in the 1990s (baseline in the calculations).
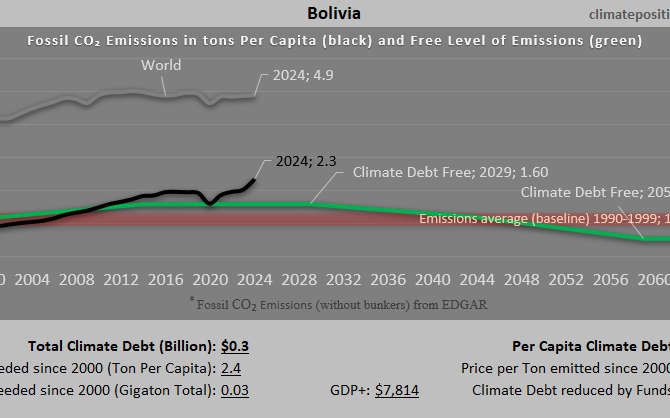
Climate Debt of Bolivia 2025: $260 Million or 0.003% of the Global Climate Debt (or $21 Per Capita)
/2025/ Bolivia ranks 94th in Climate Debt Per Capita accumulated 2000-2025. Below are some key figures in the calculations. The diagram above shows the Fossil CO2 Emissions Per Capita and the Free Level of emissions (green). The wide straight red line shows emissions in the 1990s (baseline in the calculations).
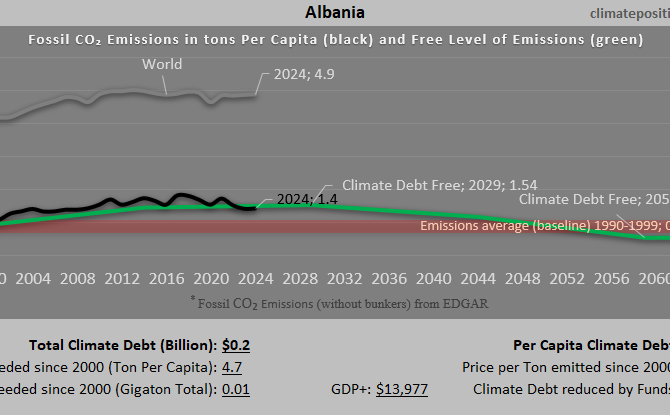
Climate Debt of Albania 2025: $200 Million or 0.002% of the Global Climate Debt (or $74 Per Capita)
/2025/ Albania ranks 87th in Climate Debt Per Capita accumulated 2000-2025. Below are some key figures in the calculations. The diagram above shows the Fossil CO2 Emissions Per Capita and the Free Level of emissions (green). The wide straight red line shows emissions in the 1990s (baseline in the calculations).
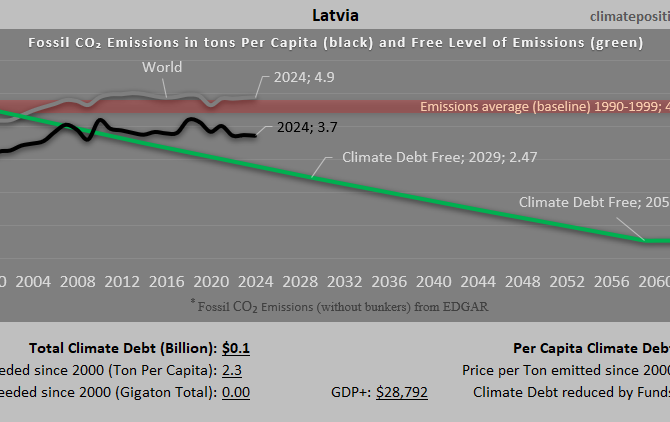
Climate Debt of Latvia 2025: $138 Million or 0.0015% of the Global Climate Debt (or $86 Per Capita)
/2025/ Latvia ranks 86th in Climate Debt Per Capita accumulated 2000-2025. Below are some key figures in the calculations. The diagram above shows the Fossil CO2 Emissions Per Capita and the Free Level of emissions (green). The wide straight red line shows emissions in the 1990s (baseline in the calculations).

Climate Debt of Jamaica 2025: $107 Million or 0.0012% of the Global Climate Debt (or $38 Per Capita)
/2025/ Jamaica ranks 92nd in Climate Debt Per Capita accumulated 2000-2025. Below are some key figures in the calculations. The diagram above shows the Fossil CO2 Emissions Per Capita and the Free Level of emissions (green). The wide straight red line shows emissions in the 1990s (baseline in the calculations).
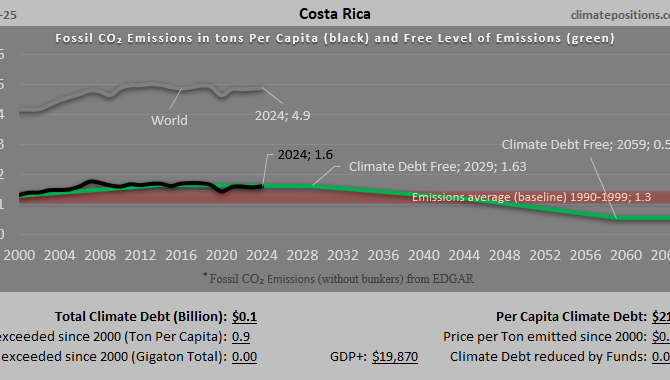
Climate Debt of Costa Rica 2025: $106 Million or 0.0011% of the Global Climate Debt (or $21 Per Capita)
/2025/ Costa Rica ranks 96th in Climate Debt Per Capita accumulated 2000-2025. Below are some key figures in the calculations. The diagram above shows the Fossil CO2 Emissions Per Capita and the Free Level of emissions (green). The wide straight red line shows emissions in the 1990s (baseline in the calculations).
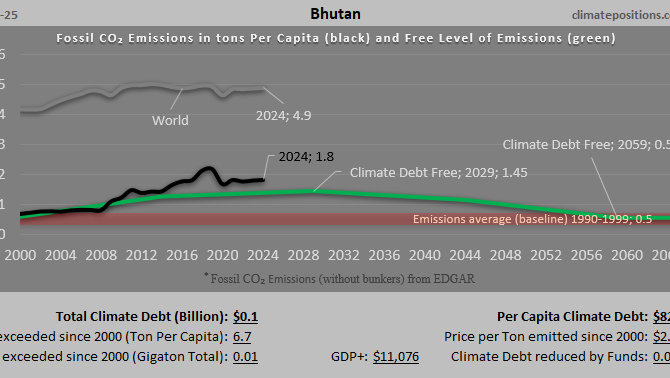
Climate Debt of Bhutan 2025: $65 Million or 0.0007% of the Global Climate Debt (or $82 Per Capita)
/2025/ Bhutan ranks 84th in Climate Debt Per Capita accumulated 2000-2025. Below are some key figures in the calculations. The diagram above shows the Fossil CO2 Emissions Per Capita and the Free Level of emissions (green). The wide straight red line shows emissions in the 1990s (baseline in the calculations).
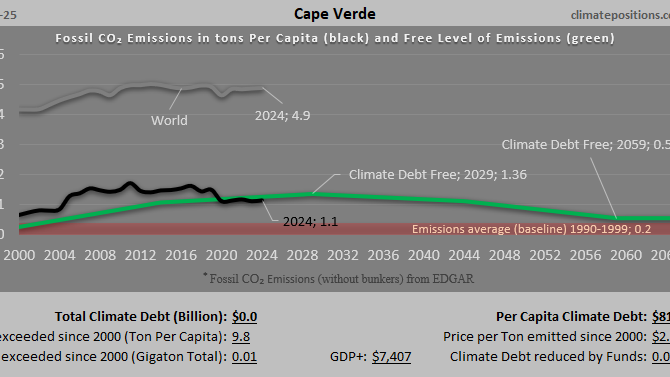
Climate Debt of Cape Verde 2025: $42 Million or 0.0005% of the Global Climate Debt (or $81 Per Capita)
/2025/ Cape Verde ranks 85th in Climate Debt Per Capita accumulated 2000-2025. Below are some key figures in the calculations. The diagram above shows the Fossil CO2 Emissions Per Capita and the Free Level of emissions (green). The wide straight red line shows emissions in the 1990s (baseline in the calculations).
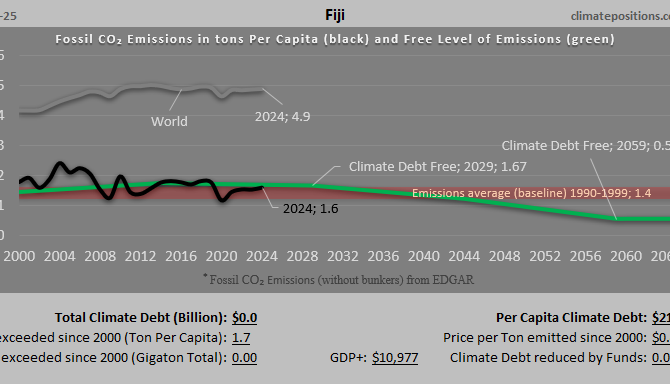
Climate Debt of Fiji 2025: $19 Million or 0.0002% of the Global Climate Debt (or $21 Per Capita)
/2025/ Fiji ranks 95th in Climate Debt Per Capita accumulated 2000-2025. Below are some key figures in the calculations. The diagram above shows the Fossil CO2 Emissions Per Capita and the Free Level of emissions (green). The wide straight red line shows emissions in the 1990s (baseline in the calculations).
Ranking 2025: 72 out of 168 countries have no Climate Debt (Fossil CO2 Emissions and GDP ppp per capita in 2000 and 2024)
/2025/ Below are the 72 countries with no Climate Debt in 2025 in ClimatePositions. The table shows Fossil CO2 Emissions in 2000 and 2024 as well as GDP ppp per capita in the same years. The ranking is by wealth in 2024.

Austria – per capita Fossil CO2 Emissions and Climate Debt
2020
Austria’s current Climate Breakdown Pricing amounts to $26.30 per tons Fossil CO2 emitted since 2000. The Climate Debt grew from $2,401 per capita in 2015 to $4,371 in 2020. Updated Rankings of 165 countries are available in the menu “Climate Debt”.
The following diagrams expose the trends of Fossil CO2 Emissions, Climate Debt, GDP(ppp-$) and Ecological Footprint without carbon.
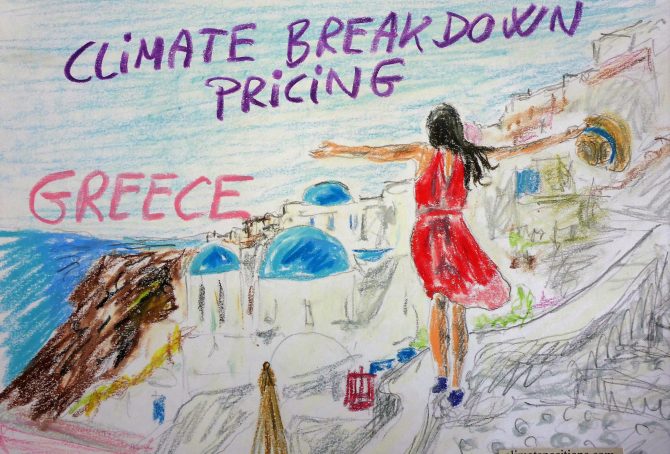
Greece – per capita Fossil CO2 Emissions and Climate Debt
2020
The current Climate Breakdown Pricing of Greece amounts to $12.76 per tons Fossil CO2 emitted since 2000. The Climate Debt grew from $1,256 per capita in 2015 to $1,929 in 2020. Updated Rankings of 165 countries are available in the menu “Climate Debt”.
The following diagrams expose the trends of Fossil CO2 Emissions, Climate Debt, GDP(ppp-$) and Ecological Footprint without carbon.
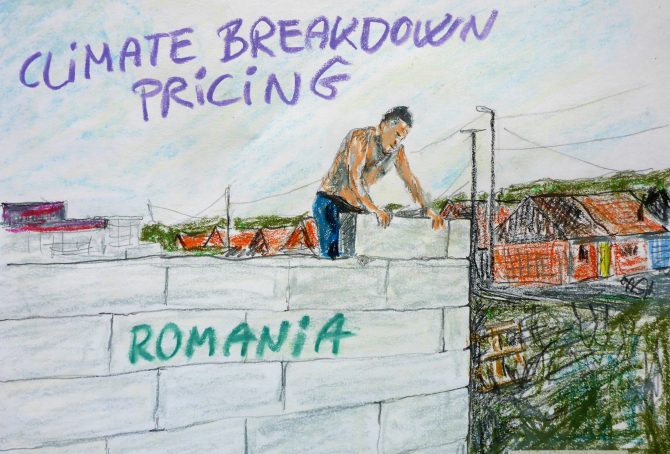
Romania – per capita Fossil CO2 Emissions and Climate Debt
2020
Romania’s current Climate Breakdown Pricing amounts to $2.78 per tons Fossil CO2 emitted since 2000. The Climate Debt grew from $65 per capita in 2015 to $235 in 2020. Updated Rankings of 165 countries are available in the menu “Climate Debt”.
The following diagrams expose the trends of Fossil CO2 Emissions, Climate Debt, GDP(ppp-$), Population Growth and Ecological Footprint without carbon.