
How green are the fossil fuel producers? (Correlation between fossil fuel production, CO2 Emissions, GDP and Climate Debt)
2015
Greenhouse gas emissions from burning of fossil fuels (oil, natural gas and coal), is the main cause of manmade climate change. Comparable energy potentials of oil, natural gas and coal is defined as “tons oil equivalents”, meaning that the energy released from a given quantity of natural gas or coal is equivalent to one ton of oil. This way the total production of fossil fuels can be expressed in a single figure (not to be confused with market value, global warming potential or general usefulness) The world’s production in million tons oil equivalent, was in 2013: oil (4,130), natural gas (3,041 and coal (3,881).
The table below ranks the twenty countries with the largest per capita fossil fuel production (oil equivalents). Total production data of 68 countries is from ‘BPs Statistical Review of World Energy 2014’ (pdf, 48 pages).
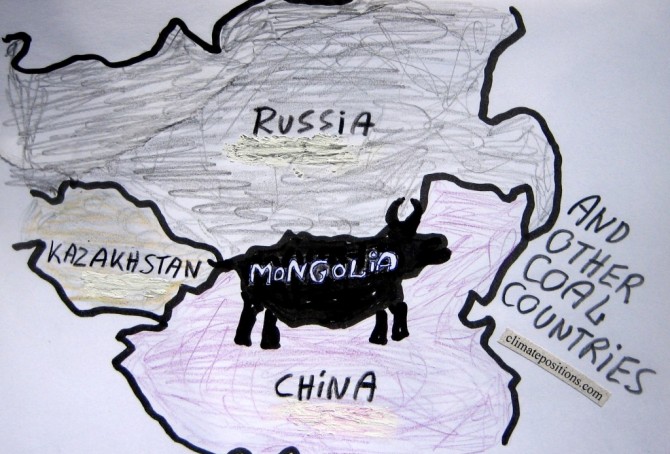
Mongolia and other coal producing countries (the thirteen most coal-dependent countries)
2015
Mongolia is the world’s second largest coal producer per capita (Btu, 2011) and coal is the world’s no. 1 carbon dioxide emitter. However, the flawed democracy (surrounded by the giant authoritarian regimes of China and Russia) is Contribution Free (no Climate Debt) in ClimatePositions – how is this possible?
The table below ranks the thirteen largest per capita coal producers (Btu, 2011), with the world average set at 1.0. The Mongolian coal production is almost ten times larger than the world average. For comparison, the table shows per capita values of CO2 Emissions (from fossil fuels), GDP(ppp-$) and Climate Debt. More comments below the table.
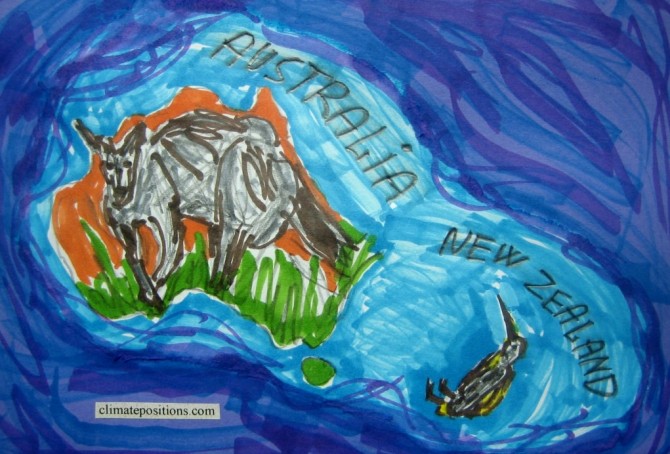
Climate change performance: Australia vs. New Zealand
2015
The two diagrams below show Australia’s and New Zealand’s CO2 Emissions from fossil fuels per capita in decades. The green bars show the Contribution Free Level and the grey bars are the world average. The average Australian per capita emissions were 16.7 tons in 1990s and 19.7 tons in 2000-2012 (18% increase). The corresponding figures of New Zealand were 8.7 tons and 9.5 tons (10% increase).
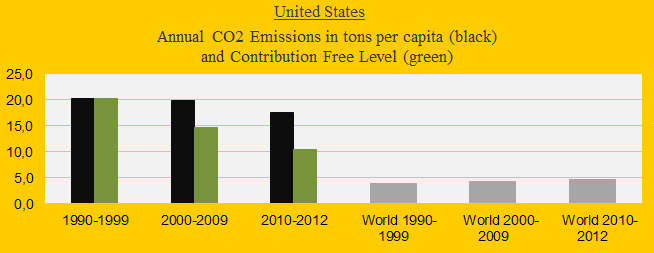
Climate change performance of the United States 2000-2013 (and the new emission target)
2014
Last week the United States ‘agreed’ with China to reduce US greenhouse gas emissions between 26% and 28% from the 2005-level by 2025. The agreement is legally non-binding and without the support of the Republicans. The following analyze the new US emission target (in the bottom) and the general performance in comparison with the spying buddies in Five Eyes Alliance¹: Canada, Australia, New Zealand and United Kingdom.
The United States is presently ranked 10th out of 147 countries in Climate Contribution (climate debt) per capita. See the ‘ranking’. The US ‘share of the global Climate Contributions’ is now 37.0%, compared to 40.7% in 2010. The first diagram shows the CO2 Emissions per capita in decades in comparison with the world average. The green bars are the Contribution Free Level, determined by the level of CO2 Emissions in the 1990s and the eleven ‘indicators’. The declining US share of the global climate debt is mainly due to reduced CO2 Emissions while the global emissions have increased.
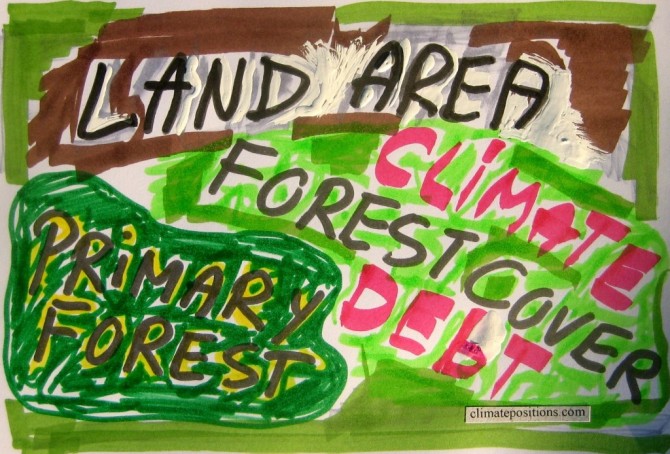
Forest Cover, Primary Forests and climate debt
2014
The national data of Forest Cover and Primary Forest are both included in the calculations of Climate Contributions (debt) in ClimatePositions. Primary Forest was included as an indicator in the worksheet in August 2014. The following describes selected findings on forests from FAO’s ‘The Global Forest Resources Assessments (FRA), 2010’ (main report, pdf, 378 pages). The Assessment is based on two primary sources of data: 1) ‘country reports’ and 2) remote sensing conducted by FAO and partners.
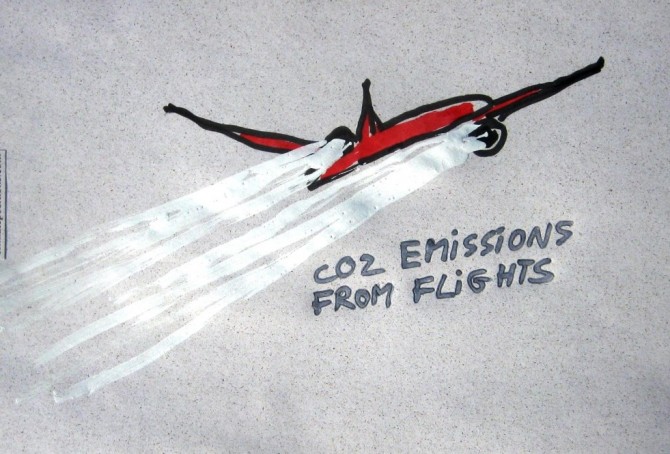
CO2 Emissions from flights
2014
Since the early 1990s the passenger-kilometers of flights worldwide has increased by 5-6% per year. The CO2 Emissions (carbon dioxide) per passenger kilometer vary due to difference in flight distances¹, aircrafts and load factors (percent of occupied seats) – with average load factors First Class and Business Class are causing nine- and three-times higher emissions per passenger than Economy Class, as one study suggests². Furthermore the mixed exhaust from flights causes 2-4 times more global warming than only CO2 emitted from engines on the ground³. The accumulated climate-effect from flights might be as high as 7-9% of the total effect from anthropogenic greenhouse gases4. However, the following examines only the CO2 Emissions from flights and the implied national costs in Climate Contributions (climate debt). But first see these three seductive animations (from ‘nats‘) with 24-hours flights over ‘Europe 1:59‘, ‘Middle East 1:11‘ and ‘North Atlantic 1:52‘.

Pisa scores, CO2 Emissions and climate debt
2014
510,000 15-year old students from 65 countries were Pisa tested and ranked in Mathematics, Reading and Science in 2012. The following compares the average Pisa scores with 1) CO2 Emissions per capita and 2) Increase in Climate Contributions (climate debt) since 2010. The question is this: Do the countries which successfully emphasize “clever students” also emphasize climate responsibility and reductions in CO2 Emissions? Or may the student’s impressive skills be aimed at other national goals, such as economic growth?
Indonesia fails on deforestation and CO2 Emissions
2013
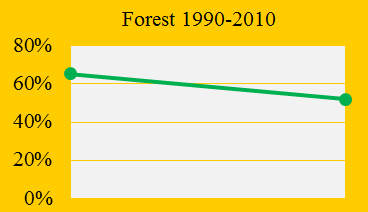
Indonesia was the 73rd worst performing country out of 145 in ClimatePositions 2010 with a total Climate Contribution (climate debt) of 5.6 billion US$. As shown in the front diagram Indonesia cut down the total forest cover (mainly rainforest) from 65.4% in 1990 to 52.1% in 2010. Had Indonesia maintained the forest cover since 1990, then the saving in Contribution would have been 4.6 billion US$. In the updated calculation the Contribution (debt) has increased to 6.5 billion US$.

Five Eyes Alliance is watching you
2013
Australia, Canada, New Zealand, United Kingdom and United States are secretly watching private mails, phone calls etc. worldwide – secretly until Snowden whistled. All five countries’ are defined as Full Democracies but the self-righteous surveillance activities take place in the closed Five Eyes Alliance (see ‘UKUSA Agreement‘ and ‘Echelon‘) with United States (read NSA) as Big Brother.

Australia perform worst of democratic countries
2013
Australia was the 6th worst performing country in the world in ClimatePositions 2010 with a Climate Contribution of $4,387 per capita. In the latest calculation it had increased to $5,081. The total national Contribution (climate debt) is now 109 billion US$. Since no country in top 5 is Full Democracies, Australia is the worst performing democratic country. It can be assumed that the majority of the Australian voters are pleased with this destructive approach to the planet.