
65 Contribution Free countries…GDP-ranked (with Income Equality, Life Expectancy and Environmental Performance)
2014
65 out of 147 countries with full data in ClimatePositions are Contribution Free (no climate debt). 41% of the world’s population lives in these Contribution Free countries and they emitted only 9% of the global carbon dioxide from fossil fuels in 2012 – without India the corresponding figures are 24% of the global population and 3% of the emissions.
The table below shows the 65 Contribution Free countries ranked by GDP(ppp-$) per capita, with Income Equality (‘Atkinson Index‘), Life Expectancy and Environmental Performance. The world’s average GDP(ppp-$) per capita was $13.791 in 2012. Analysis and comments see below the table – the color codes are explained in the bottom.
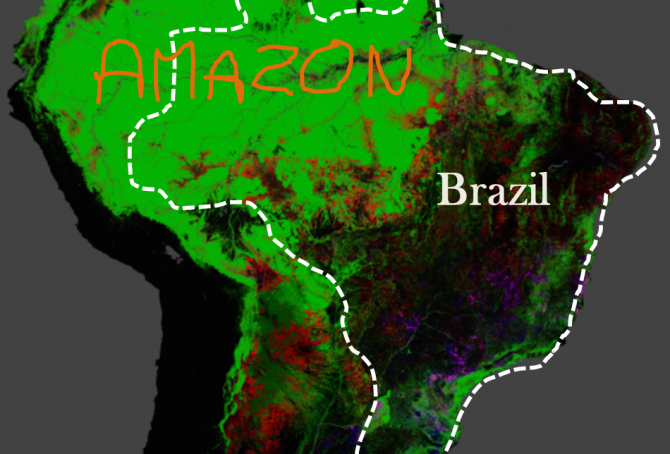
Brazil’s rainforests and climate change performance
2014
The Google map of the Amazon is from the new interactive ‘Global Forest Change‘ developed by The University of Maryland (read ‘more’). The red is Forest Loss from 2000 to 2012, the blue is Forest Gain and the green is Forest Extent (unchanged). The purple is areas of mixed Forest Loss and Forest Gain. According to Brazil’s environment minister the lowest recorded deforestation of Brazil since 1988, was in 2012. Furthermore, up to a third of the cleared rainforest over the past decades may be on the way back (regrowth).
COP20 in Lima: Derailed negotiations and depressed scientists
2014
Since ‘COP1 in Berlin’ in 1995 the global CO2 Emissions from fossil fuels have increased by 50% (in addition to increased greenhouse gas emissions from deforestation, cement production, melting permafrost, etc.). The purpose of COP1, COP2, COP3, COP4, COP5, COP6, COP7, COP8, COP9, COP10, COP11, COP12, COP13, COP14, COP15, COP16, COP17, COP18 and COP19 were to reduce dangerous greenhouse gases and counteract global warming. The current COP20 in Lima builds on twenty years of mushrooming in a flawed system without tools to secure meaningful negotiations and reject derailments caused by powerful nations such as the United States and China. Meanwhile, depression¹ is spreading from climate scientists to larger parts of the planet’s population.
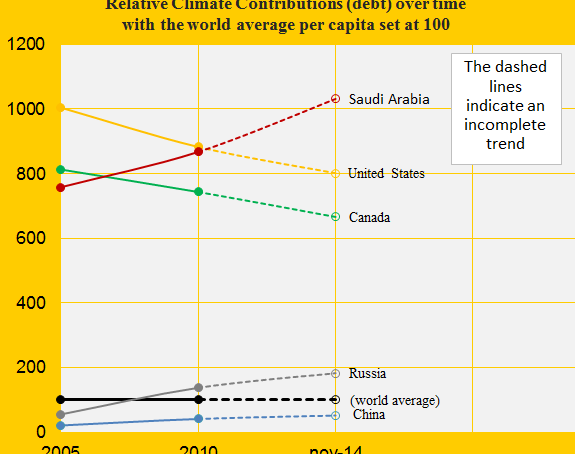
Climate change performance of Saudi Arabia and Canada
2014
The first diagram shows the relative Climate Contribution (debt) per capita of Saudi Arabia, Canada, China, the United States and Russia, with the world’s average set at 100. Around 2007 Saudi Arabia passed Canada and since then, the gap has grown considerably. Today, the climate debt per capita accumulated since 2000 are respectively $7,936 and $5,128 (see the ‘ranking’).
The Climate Contributions are calculated by using eleven ‘indicators’ of which national CO2 Emissions from the burning of fossil fuels is the principal. Extraction and export of fossil fuels is not one of the indicators which Saudi Arabia should be thankful for – wealth measured as ‘GDP(ppp-$)‘, however, is an indicator.

The United Kingdom beats Germany in climate change performance
2014
Germany is ranked 24th and United Kingdom 33rd among 147 countries on the list of the worst performing countries in ClimatePositions. See the ‘ranking’. The German Climate Contribution (debt) accumulated since 2000 has increased from $980 per capita in 2010 to $1,640 in the latest calculation, while the one of the United Kingdom has increased from $796 to $1,156. The first diagram shows the relative climate debt of the two countries in comparison with France, Italy and Poland, with the world average set at 100. Since 2010, the United Kingdom is the only country among the five that has improved significantly. The world average climate debt has increased from $455 per capita in 2010 to $769 in the latest calculation (this increase reflects both the growing CO2 Emissions from fossil fuels and the growing economy). The following analyses some trends for Germany and the United Kingdom.
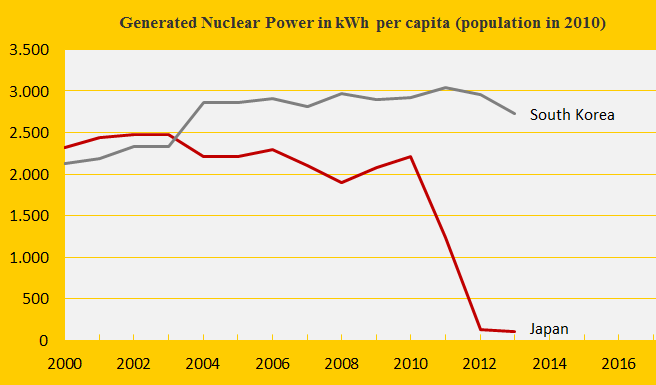
Climate change performance: Japan vs. South Korea
2014
The first diagram shows the nuclear power generation per capita of the two countries. The Fukushima nuclear disaster in Japan in 2011 has caused a remarkable shutdown of generation – while CO2 Emissions from the burning of petroleum, coal and natural gas have increased (from 2011 to 2012 respectively by 6%, 5% and 3%) to close the energy gap. Nuclear power generation produce dangerous radioactive waste to deal with for thousands of future generations (10,000 to 250,000 years) and in ClimatePositions nuclear power is not accepted as a national CO2 Emission reduction instrument (read ‘more’). The following analyzes the indicator trends of Japan and South Korea.