Slowdown of Denmark’s accumulating Climate Debt, but..!
2015
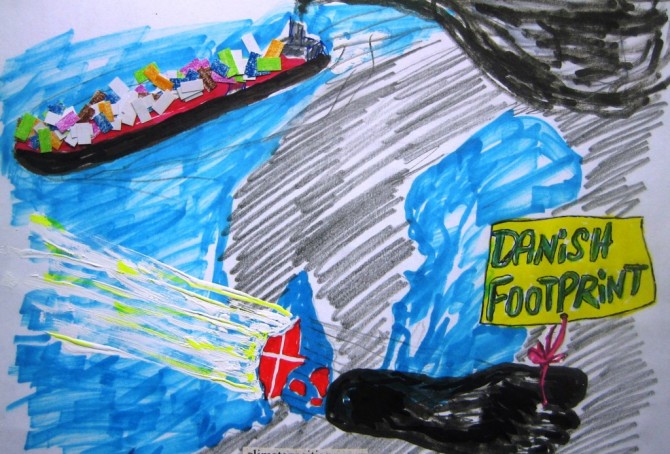
Denmark’s updated Climate Debt is $806 per capita. In the latest ‘ranking’ the Scandinavian country is 41st out of 147 countries (where no. 1 is worst) and is often referred to as a green transition pioneer. However, according to various rankings and surveys the picture is somewhat more complicated:
- Denmark’s per capita ‘Ecological Footprint’ – without carbon emissions – is the largest among 152 countries.
- Denmark is ranked 1st among 29 countries (those with data) on organic (ecological) share of all domestic sales¹.
- In the ‘Climate Change Performance Index’ (from Germanwatch and Climate Action Network Europe) Denmark performs best of 58 countries.
- CO2 Emissions would be around 46% higher than the usual statistics show, if emissions from Danish-controlled overseas ships, sailing goods around the world, were included² (in 2011 the Danish per capita CO2 Emissions would be around 15.0 tons instead of 8.2 tons).
- In addition, Denmark’s CO2 Emissions would be around 18% higher (in 1996-2009), than the usual statistics show, if emissions were consumption-based³ (inclusive CO2 Emissions from the production of imported goods) instead of production-based (inclusive CO2 Emissions from domestic production of goods for export).
However, the following examines only the indicators of CO2 Emissions from fossil fuels (production-based and without emissions from overseas ships), GDP(ppp-$) and Ecological Footprint without carbon emissions.
Top five in Climate Debt: Qatar, Kuwait, Singapore, United Arab Emirates and Trinidad and Tobago
2015
The updated Climate Debt per capita accumulated since 2000 of the five worst performing countries are:
- Qatar $35,565
- Kuwait $31,828
- Singapore $24,828
- United Arab Emirates $18,386
- Trinidad and Tobago $14,131
See the ‘ranking’ of 147 countries. The total population of the five small countries is 0.24% of the global population but the total Climate Debt is overwhelmingly 7.44% of the global Climate Debt (in 2012). The following analyses the indicators of GDP(ppp-$) and CO2 Emissions from fossil fuels (read about the issues of marine bunkers e.g. in Singapore at the bottom).
Climate change performance of Spain, France and Italy
2015
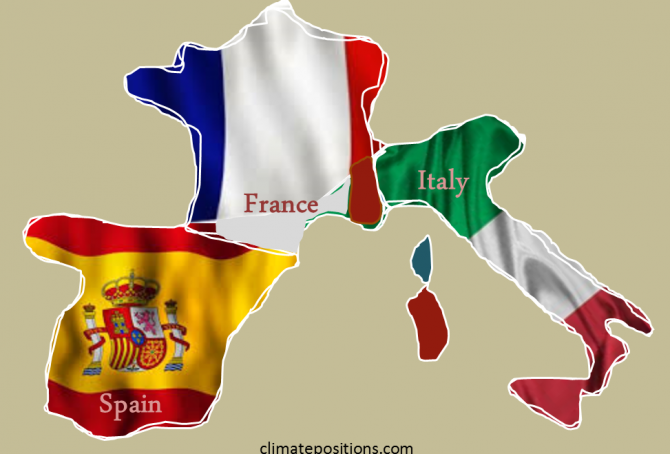
2.5% of the global population live in Spain, France or Italy and together they emitted 3.3% of the global CO2 from fossil fuels in 2012 – the combined share of the global Climate Debt is 4.3%. Spain’s updated Climate Debt per capita is $1,692 (ranked 25th), France’s is $1,352 (ranked 31st) and Italy’s is $1,034 (ranked 35th). See the ‘ranking’. The following examines the Climate Debt trends and the indicators of CO2 Emissions (carbon dioxide from fossil fuels), GDP(ppp-$), Forests, Marine Protection and Nuclear Power.
Climate change performance: Australia vs. New Zealand
2015
The two diagrams below show Australia’s and New Zealand’s CO2 Emissions from fossil fuels per capita in decades. The green bars show the Contribution Free Level and the grey bars are the world average. The average Australian per capita emissions were 16.7 tons in 1990s and 19.7 tons in 2000-2012 (18% increase). The corresponding figures of New Zealand were 8.7 tons and 9.5 tons (10% increase).
Climate change performance of Venezuela, Chile and Mexico
2015
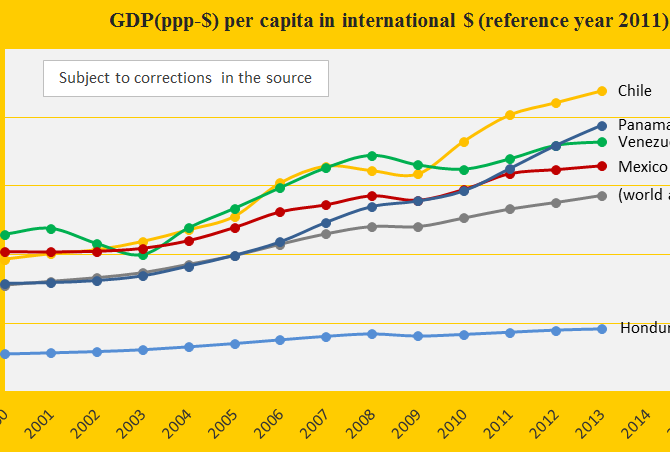
Venezuela, Chile and Mexico are ranked 42nd, 44th and 58th among 147 countries on the worst performing list in ClimatePositions (see the ‘ranking’). Their updated Climate Contributions (climate debt) are respectively $697, $561 and $313 per capita. The first diagram shows the GDP(ppp-$) per capita of the three countries, in comparison with Panama, Honduras and the world average. Chile is the third wealthiest country in the America’s after (far after!) the United States and Canada – Honduras is the second poorest after Nicaragua.
ExxonMobil: The Outlook for Energy 2015 … 2040 (Planet Exxon!?)
2015
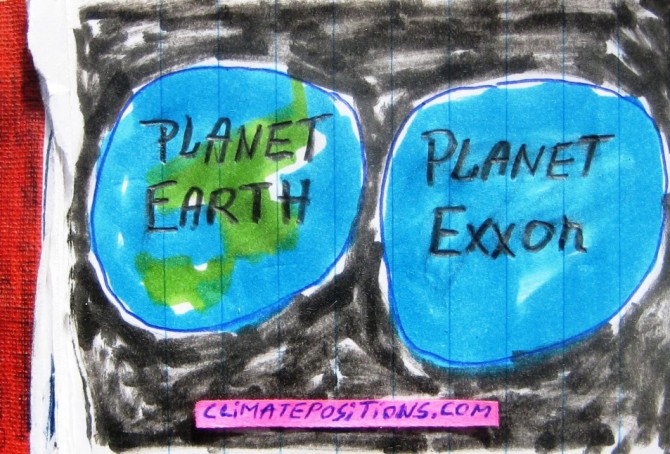
‘Exxon Mobil Corporation’ from Texas, the United States is, quote: “committed to being the world’s premier petroleum and petrochemical company.” However, based on estimates of the potential carbon dioxide emissions from the proven reserves of oil and gas underground, ExxonMobil is only the 4th largest company in the world after Gazprom, Rosneft (both Russia) and PetroChina (read this ‘article’).
Since the United Nations has decided to keep the rise in global temperature below 2°C and consequently only between 8% and 34% of the proven fossil fuel reserves can be extracted and burned over the next 40 years. A recent ‘study in Nature‘ suggest that, globally, 33% of oil reserves, 50% of gas reserves and over 80% of current coal reserves should remain unused from 2010 to 2050 in order to meet the target of 2°C (also read the article ‘Divestment from Fossil Fuel Companies’). It will be interesting to see how companies such as ExxonMobil meet this moral challenge. The following highlight some forecasts from ExxonMobil’s ‘Outlook for energy 2015: A View to 2040’ (76 pages).
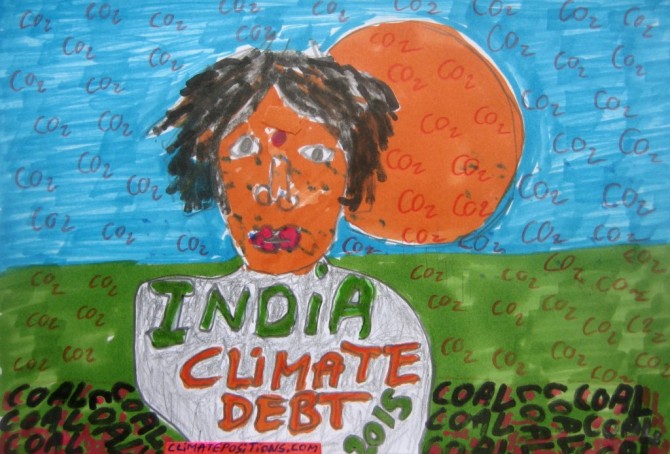
Estimate: India now has a Climate Debt
2015
Annual updates of ‘CO2 Content in the atmosphere’ and Global Population affects the future CO2 Emission target per capita and thus the Contribution Free Level of all countries (in ClimatePositions). The updates by January 2015 lowered India’s Contribution Free Level just enough to reach an estimated climate debt of $0.68 per capita, or a total climate debt of $812 million – the 67th largest climate debt among 146 countries or 0.02% of the global climate debt.
