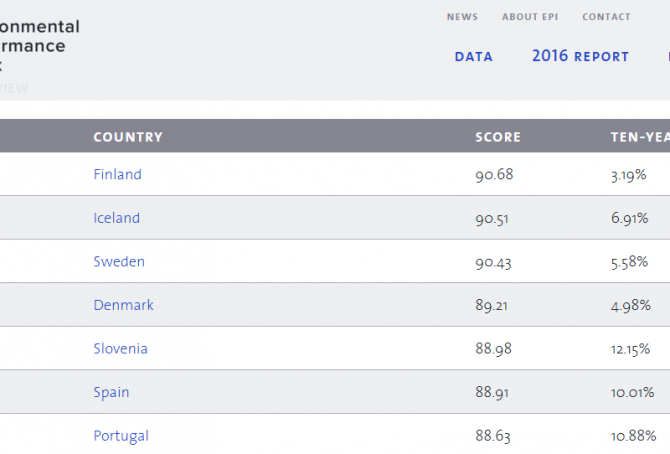
Environmental Performance Index 2016: Ranking of 180 countries
Every second year Yale and Colombia Universities, in collaboration with the World Economic Forum, publish an Environmental Performance Index (EPI) with global ranking. The 2016 edition with ‘Ranking of 180 countries‘ is now available – click on individual countries at the sourse to see more details on Biodiversity and Habitat, Forests, Climate and Energy, Fisheries, Agriculture, Water Resources, Water and Sanitation, Health Impacts and Air Quality. Scores are converted to a scale of 0 to 100, with 0 being the worst observed value and 100 the best. The seven best performing countries are ranked in the table (copied from the site).

Climate Debt: Qatar ranks 1st … while buying FC Barcelona branding with Fossil Fuel revenue
The authoritarian oil state of Qatar is a prime example of the titanic hypocrisy written into numerous ‘pledges (INDCs) prior to COP21‘ in Paris. The overall objective of the Paris Agreement is to limit global warming to 1.5-2°C compared to pre-industrial times. Consequently, the major part of all known global fossil fuel reserves will have to stay in ground. Today, Qatar is the largest per capita fossil fuel producer, the largest per capita fossil fuel CO2 emitter and the richest country in the world. Therefore, it comes as no surprise that Qatar also has the largest accumulated per capita Climate Debt in ClimatePositions (see the updated ‘ranking’ by January 2016).
Back in 2008 the ‘Qatar National Vision 2030’ stated that: “Qatar’s progress has depended primarily on the exploitation of its oil and gas resources. But the country’s hydrocarbon resource will eventually run out.” And then this monster of a fake statement: “Qatar will meet the needs of this generation without compromising the needs of future generations.” The fact is that Qatar since 2008 has increased CO2 Emissions from fossil fuels by 48% and fossil fuel production by around 67%. The following examines ‘Qatar’s 2015-pledges (INDCs)‘, CO2 Emissions, GDP(ppp-$), Climate Debt and the shiny branding bought with fossil fuel revenue.
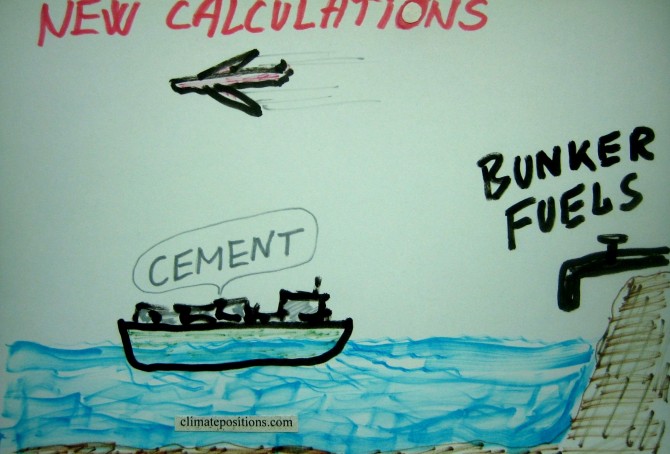
ClimatePositions: CO2 Emission-data now include cement production (and exclude bunker fuels)
So far, ‘EIA’ has been the source of national CO2 Emissions in ClimatePositions. EIA include emissions from burning of fossil fuel, including bunker fuels (fuels used for international aviation and maritime transport). Globally, bunker fuels account for about 3% of all fossil fuel CO2 Emissions.
By January 2016, the source of CO2 Emissions used in ClimatePositions switches to ‘Carbon Dioxide Information Analysis Center (CDIAC)’, or simply Global Carbon Project. CDIAC also include emissions from burning of fossil fuel, but exclude emissions from bunker fuels (fuels used for international aviation and maritime transport), and instead include ‘CO2 Emissions from cement production’. Emissions from cement production (and oxidation) amount to about 5% of all fossil fuel emissions, globally. The total annual national carbon emissions at the source are subsequently converted¹ to per capita CO2 Emissions for the use in ClimatePositions. Note that emissions 2012-2014 are preliminary estimates².
For comparison, the table below shows the national shares of the global Climate Debt, respectively, with CO2 Emission data from 1) Global Carbon Project (CDIAC) and 2) EIA. Countries with increased Climate Debt, relatively, due to the conversion of sources are marked in red. The global Climate Debt will only be slightly affected by the change (the global Climate Debt is 5.7 trillion by Januar 2016).
From today, Global Carbon Project will be used as source of CO2 Emissions in ClimatePositions. New rankings are available in the menu “Climate Debt”. More comments below the table.

Update 2015: Warmest year on record … mother Earth with fever
The year 2015 was the warmest on Earth since measurements began in 1880. Both global Air Temperature and Ocean Temperature was the warmest on record. See the development in Air Temperature between 1960 and 2015 in the diagram below; the average temperature rise 1880-1937 is set at 0°C and 2015 was 1.64°C warmer.

Update 2015: Global Population now 7.35 billion (life expectancy, births rates and an alarming prediction)
The estimated Global Population increased from 7.26 billion in 2014 to 7.35 billion in 2015 – an increase of 1.2%, or 87 million, in one year. See the population growth 1960-2015 in the diagram below. Some surprising demographic trends of life expectancy and births rates, and a long term Global Population prediction, are included.
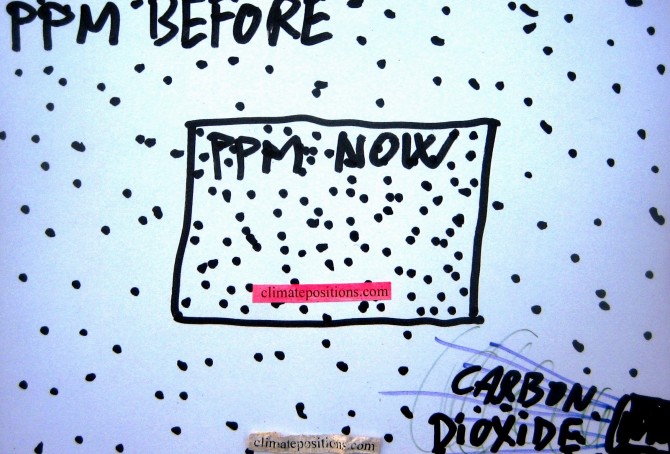
Update 2015: CO2 Content in the atmosphere has passed 400 ppm
The carbon dioxide content in the atmosphere passed 400 ppm (parts per million) in 2015 (mean). In 2014 the content was 398.61 ppm and in 2015 it was 400.83 ppm – the annually updated figure is used in ClimatePositions.
See the alarming development 1960-2015 in the diagram below. The pre-industrial level was below 300 ppm and 350 ppm is considered the relatively safe limit. Human-caused CO2 Emissions is the main cause of global warming, melting ice sheets, sea level rise and escalation of extreme weather events.
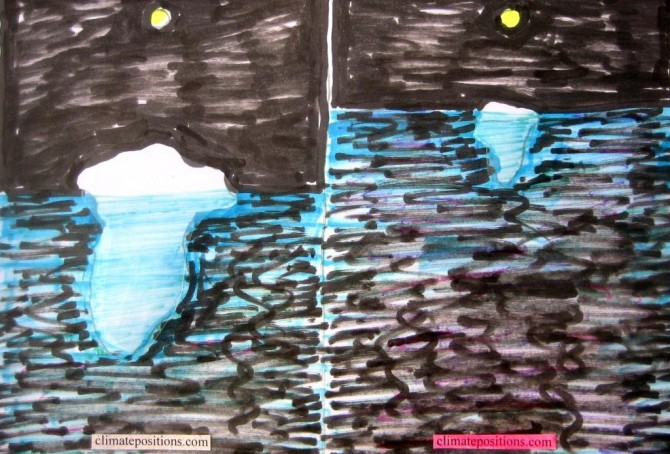
Update 2015: Sea Level rise slowly accelerates
During 2015 the average estimated rate of global Sea Level rise since 1993 increased from 3.2 mm (±0.4 mm) annually to 3.3 mm (±0.4 mm). This indicates a slowly continually accelerating rate of Sea Level rise. In ClimatePositions the Sea Level rise between 1880 and 1993 is set at 1.2 mm annually, or 14.00 cm in total, and combined this adds up to a total estimated Sea Level rise between 1880 and 2015 of 21.26 cm (this figure is used in ClimatePositions).