
Iran – per capita Fossil CO2 Emissions and Climate Debt
2020
Iran’s current Climate Breakdown Pricing amounts to $15.69 per tons Fossil CO2 emitted since 2000. The Climate Debt grew from $1,095 per capita in 2015 to $2,153 in 2020. Updated Rankings of 165 countries are available in the menu “Climate Debt”.
The following diagrams expose the trends of Fossil CO2 Emissions, Climate Debt, GDP(ppp-$), Ecological Footprint (without carbon) and Nuclear Power.

Germany – per capita Fossil CO2 Emissions and Climate Debt
2020
Germany’s current Climate Breakdown Pricing amounts to $18.68 per tons Fossil CO2 emitted since 2000. The Climate Debt grew from $1,562 per capita in 2015 to $3,536 in 2020. Updated Rankings of 165 countries are available in the menu “Climate Debt”.
The following diagrams expose the trends of Fossil CO2 Emissions, Climate Debt, GDP(ppp-$), Nuclear Power and Ecological Footprint without carbon.

Japan – per capita Fossil CO2 Emissions and Climate Debt
2020
Japan’s current Climate Breakdown Pricing amounts to $20.35 per tons Fossil CO2 emitted since 2000. The Climate Debt grew from $1,952 per capita in 2015 to $3,734 in 2020. Updated Rankings of 165 countries are available in the menu “Climate Debt”.
The following diagrams expose the trends of Fossil CO2 Emissions, Climate Debt, GDP(ppp-$), Nuclear Power and Ecological Footprint without carbon.

Russia – per capita Fossil CO2 Emissions and Climate Debt
2020
Russia’s current Climate Breakdown Pricing amounts to $12.16 per tons Fossil CO2 emitted since 2000. The Climate Debt grew from $1,346 per capita in 2015 to $2,676 in 2020. Updated Rankings of 165 countries are available in the menu “Climate Debt”.
The following diagrams expose the trends of Fossil CO2 Emissions, Climate Debt, GDP(ppp-$) and Ecological Footprint without carbon.

India – per capita Fossil CO2 Emissions (zero Climate Debt)
2020
In the calculation of Climate Debt, India is especially interesting because it has zero Climate Debt despite the fact that the country is the 3rd largest emitter of Fossil CO2. As it appears, India will enter the next 20-year period in ClimatePositions (2020-2039) without any Fossil CO2 Emissions exceeded. The final calculation will be made, when data on Fossil CO2 Emissions 2019 are released.
The following diagrams expose the trends of Fossil CO2 Emissions, GDP(ppp-$), Ecological Footprint without carbon, Forest Cover and Primary Forest.

United States – per capita Fossil CO2 Emissions and Climate Debt
2020
The current Climate Breakdown Pricing of the United States amounts to $30.82 per tons Fossil CO2 emitted since 2000. The Climate Debt grew from $5,497 per capita in 2015 to $10,718 in 2020. Updated Rankings of 165 countries are available in the menu “Climate Debt”.
The following diagrams expose the trends of Fossil CO2 Emissions, Climate Debt, GDP(ppp-$) and Nuclear Power.
China – per capita Fossil CO2 Emissions and Climate Debt
2020
China’s current Climate Breakdown Pricing amounts to $12.33 per tons Fossil CO2 emitted since 2000. The Climate Debt grew from $593 per capita in 2015 to $1,395 in 2020. Updated Rankings of 165 countries are available in the menu “Climate Debt”.
The following diagrams expose the trends of Fossil CO2 Emissions, Climate Debt, GDP(ppp-$) and Ecological Footprint without carbon.
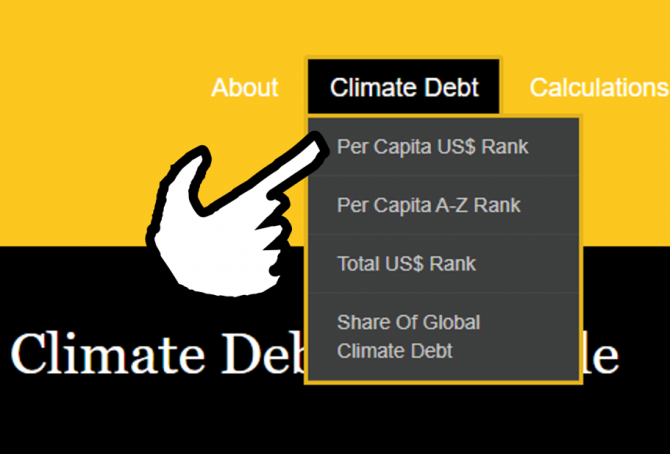
Update: Climate Debt Ranking by country (165 countries)
2020
The accumulated Climate Debt of 165 countries has been entered the menu “Climate Debt” (Rankings 2020) and the sub-menu Calculation (Excel). The coming months the climate breakdown responsibility of a large number of countries will be examined.