Uzbekistan – per capita Fossil CO2 Emissions and Climate Debt
2020
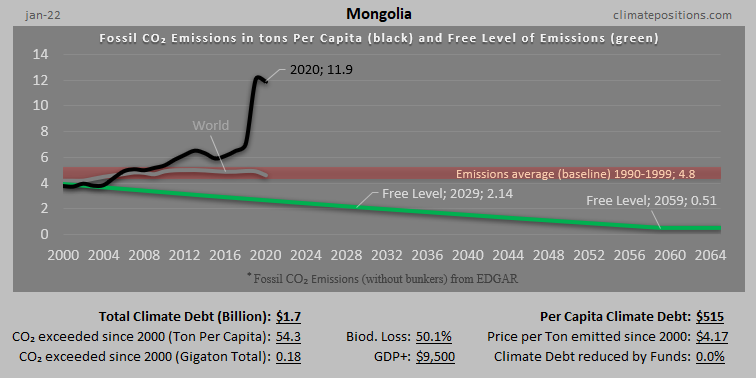
Uzbekistan’s current Climate Breakdown Pricing amounts to $1.20 per tons Fossil CO2 emitted since 2000. The Climate Debt grew from $43 per capita in 2015 to $93 in 2020. Updated Rankings of 165 countries are available in the menu “Climate Debt”.
The following diagrams expose the trends of Fossil CO2 Emissions, Climate Debt, GDP(ppp-$) and Environmental Performance.
Vietnam – per capita Fossil CO2 Emissions and Climate Debt
2020
Vietnam’s current Climate Breakdown Pricing amounts to $0.88 per tons Fossil CO2 emitted since 2000. The Climate Debt grew from $6 per capita in 2015 to $26 in 2020. Updated Rankings of 165 countries are available in the menu “Climate Debt”.
The following diagrams expose the trends of Fossil CO2 Emissions, Climate Debt, GDP(ppp-$), Forest Cover, Primary Forest and Ecological Footprint without carbon.
Kazakhstan – per capita Fossil CO2 Emissions and Climate Debt
2020
Kazakhstan’s current Climate Breakdown Pricing amounts to $16.18 per tons Fossil CO2 emitted since 2000. The Climate Debt grew from $2,041 per capita in 2015 to $4,025 in 2020. Updated Rankings of 165 countries are available in the menu “Climate Debt”.
The following diagrams expose the trends of Fossil CO2 Emissions, Climate Debt, GDP(ppp-$) and Ecological Footprint without carbon.
Russia – per capita Fossil CO2 Emissions and Climate Debt
2020
Russia’s current Climate Breakdown Pricing amounts to $12.16 per tons Fossil CO2 emitted since 2000. The Climate Debt grew from $1,346 per capita in 2015 to $2,676 in 2020. Updated Rankings of 165 countries are available in the menu “Climate Debt”.
The following diagrams expose the trends of Fossil CO2 Emissions, Climate Debt, GDP(ppp-$) and Ecological Footprint without carbon.
China – per capita Fossil CO2 Emissions and Climate Debt
2020
China’s current Climate Breakdown Pricing amounts to $12.33 per tons Fossil CO2 emitted since 2000. The Climate Debt grew from $593 per capita in 2015 to $1,395 in 2020. Updated Rankings of 165 countries are available in the menu “Climate Debt”.
The following diagrams expose the trends of Fossil CO2 Emissions, Climate Debt, GDP(ppp-$) and Ecological Footprint without carbon.
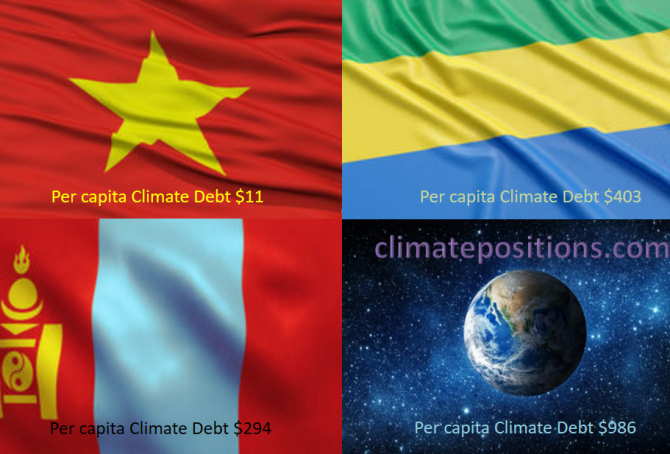
Share of global Climate Debt rank 73rd, 74th and 75th: Vietnam, Mongolia and Gabon (combined responsible for 0.04% of Climate Debt and 0.64% of Fossil CO2 Emissions 2016)
2018
The diagram below shows ‘Share of global Climate Debt‘ in 2010, 2015 and 2017 of Vietnam, Mongolia and Gabon (ranked 73rd, 74th and 75th). The shares of Vietnam and Mongolia are both growing continuously. Vietnam and Gabon had zero Climate Debt in 2010.

Share of global Climate Debt rank 70th, 71st and 72nd: Equatorial Guinea, Panama and Dominican Republic (combined responsible for 0.05% of Climate Debt and 0.10% of Fossil CO2 Emissions 2016)
2018
The diagram below shows ‘Share of global Climate Debt‘ in 2010, 2015 and 2017 of Equatorial Guinea, Panama and Dominican Republic (ranked 70th, 71st and 72nd). The share of Panama is continuously growing, whereas the shares of Equatorial Guinea and Dominican Republic are uneven.

Global Carbon Project (CDIAC), located in the United States, stops publishing carbon emissions data by country – will be replaced by EDGAR in ClimatePositions
2017
The Carbon Dioxide Information Analysis Center (CDIAC), located at the U.S. Department of Energy’s (DOE) Oak Ridge National Laboratory, has published annual Carbon Emissions from Fossil Fuels and cement production by country since 1959 (‘Global Carbon Project‘), but now this continuous time series has come to an end and 2015 will be the last data-year (as it seems).
Since carbon emissions data from CDIAC (Global Carbon Project) is the core ‘Indicator‘ in ClimatePositions’ calculation of Climate Debt, carbon emissions data will be replaced with nearly similar data from ‘EDGAR‘ (‘European Commission‘ / ‘Climate Action‘), retroactively since 1990, in connection with the coming updates [done 16-08-2017].
The following describes the differences between CO2 Emissions data from Global Carbon Project (CDIAC) and EDGAR (sourced: European Commission, Joint Research Centre (JRC)/Netherlands Environmental Assessment Agency (PBL). Emission Database for Global Atmospheric Research (EDGAR)), and the consequences in terms of Climate Debt in ClimatePositions – illustrated with a range of country examples. Note that other sources, such as ‘IEA‘, ‘EIA‘ and ‘BP‘, provides CO2 Emissions data-sets different from the ones of CDIAC and EDGAR.

Climate Debt: Australia ranks 8th (performance of the twenty largest coal producers)
2016
Australia covers around 5.7% of planet’s land area and populates 0.3% of its people. The Climate Debt of the 24 million Australian’s amounts to $132 billion, or $5,613 per capita, which ‘Ranks’ Australia 8th among 148 countries – in 2010 the ranking was 6th. Australia is the world’s 5th largest coal producer and the 2nd largest per capita CO2 emitter from coal combustion … and coal is the most efficient climate destroyer. The table below reveals some key figures of the world’s twenty largest coal producers. Subsequently, Australia’s climate change performance is examined in comparison with four other top-five countries on CO2 Emissions from coal combustion (per capita): Kazakhstan (ranked 1), South Africa (3), the United States (4) and Poland (5).
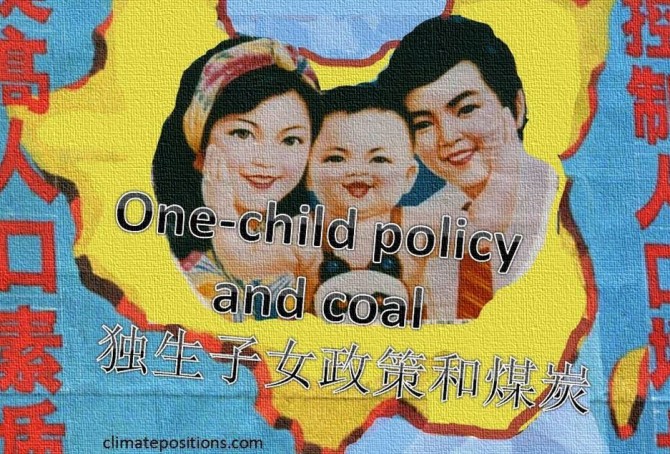
China’s share of the global Climate Debt is growing fast
In 2010 China’s share of the global Climate Debt was 7.4% and by January 2016 it has grown dramatically to 13.3% (see the ‘ranking’). Since 2000 the Chinese share of the growing global CO2 Emissions has grown from 13.7% to about 29.0% (preliminary emissions by 2014). Luckily, the populous superpower has committed itself to pursue “efforts to limit the temperature increase to 1.5 °C” … according to the COP21 Paris Agreement. The following examines the development of CO2 Emissions, Environmental Performance, GDP(ppp-$), Climate Debt and Population (with respect to the one-child policy).
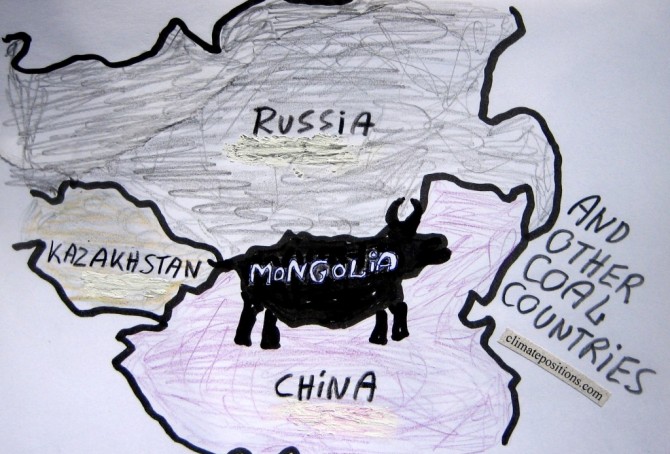
Mongolia and other coal producing countries (the thirteen most coal-dependent countries)
2015
Mongolia is the world’s second largest coal producer per capita (Btu, 2011) and coal is the world’s no. 1 carbon dioxide emitter. However, the flawed democracy (surrounded by the giant authoritarian regimes of China and Russia) is Contribution Free (no Climate Debt) in ClimatePositions – how is this possible?
The table below ranks the thirteen largest per capita coal producers (Btu, 2011), with the world average set at 1.0. The Mongolian coal production is almost ten times larger than the world average. For comparison, the table shows per capita values of CO2 Emissions (from fossil fuels), GDP(ppp-$) and Climate Debt. More comments below the table.
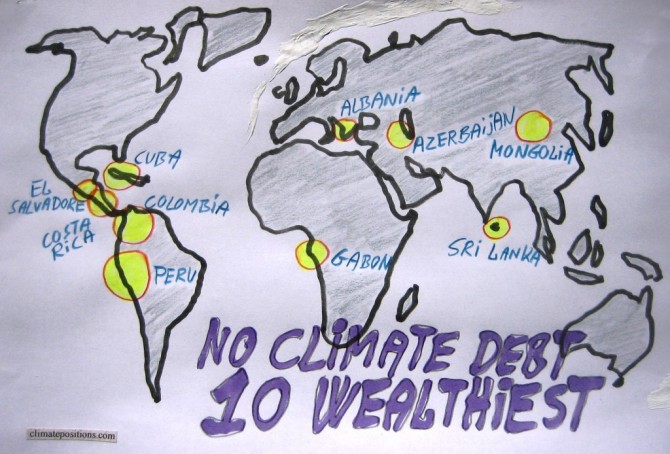
The ten wealthiest countries without any Climate Debt
2015
Among the 147 countries with full data in ClimatePositions 65 are Contribution Free (no Climate Debt). See the ‘ranking’. The table in this article ranks (from 1 to 10) the ten wealthiest Contribution Free countries by the following eight indicators:
- Per capita GDP(ppp-$) (1 = wealthiest)
- Income Equality (1 = most equal)
- Per capita CO2 Emissions from fossil fuels (1 = lowest emissions)
- Democracy Index (1 = most democracy)
- Environmental Performance (1 = best performance)
- Life Expectancy by birth (1 = longest lives)
- Per capita Ecological Footprint without carbon (1 = smallest footprint)
- Primary Forests as a percentage of the total land area (1 = largest percentage)
Read the comments below the table.