

Venezuela – per capita Fossil CO2 Emissions and Climate Debt (economic collapse)
2020
Venezuela’s current Climate Breakdown Pricing amounts to $10.04 per tons Fossil CO2 emitted since 2000. The Climate Debt grew from $655 per capita in 2015 to $1,045 in 2020. However, once updated data on national GDP(ppp-$) is released, then the current Climate Debt will prove to be considerably smaller (more below). Updated Rankings of 165 countries are available in the menu “Climate Debt”.
The following diagrams expose the trends of Fossil CO2 Emissions, GDP(ppp-$), Climate Debt, Forest Cover, Primary Forest and Ecological Footprint without carbon.
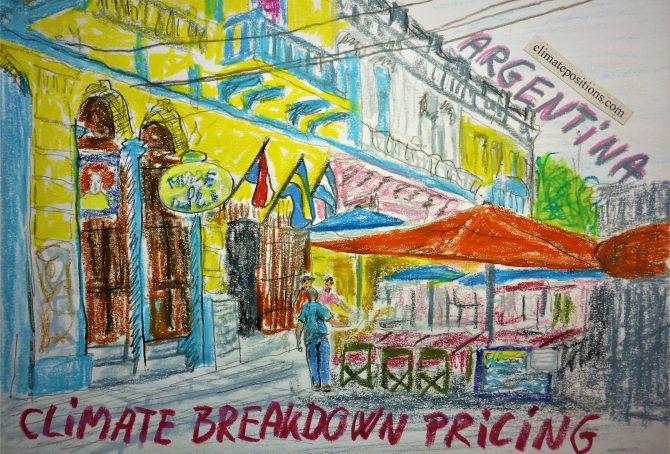
Argentina – per capita Fossil CO2 Emissions and Climate Debt
2020
Argentina’s current Climate Breakdown Pricing amounts to $10.19 per tons Fossil CO2 emitted since 2000. The Climate Debt grew from $420 per capita in 2015 to $928 in 2020. Updated Rankings of 165 countries are available in the menu “Climate Debt”.
The following diagrams expose the trends of Fossil CO2 Emissions, Climate Debt, GDP(ppp-$) and Ecological Footprint without carbon.
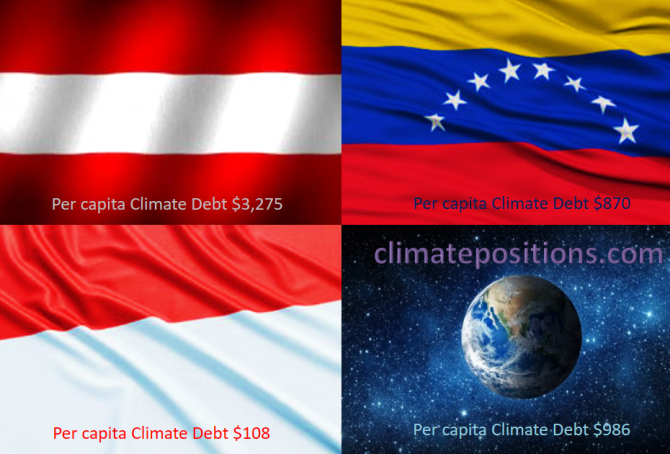
Share of global Climate Debt rank 28th, 29th and 30th: Austria, Indonesia and Venezuela (combined responsible for 1.2% of Climate Debt and 2.2% of Fossil CO2 Emissions 2016)
2017
The diagram below shows ‘Share of global Climate Debt‘ in 2010, 2015 and 2017 of Austria, Indonesia and Venezuela (ranked 28th, 29th and 30th). In 2015, the shares of each of the three countries were 0.40 or 0.41% of global Climate Debt.
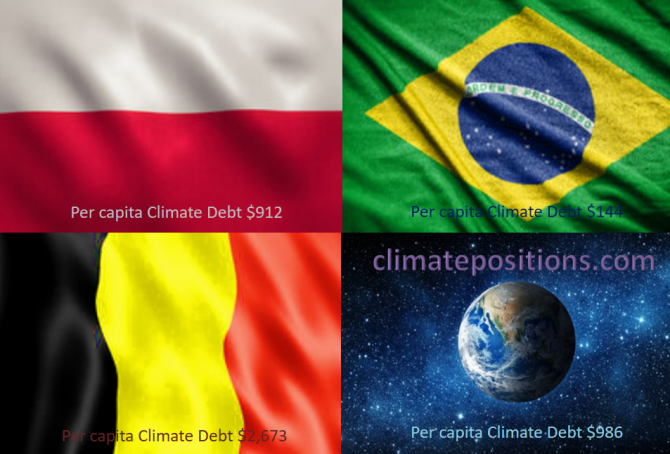
Share of global Climate Debt rank 25th, 26th and 27th: Poland, Belgium and Brazil (combined responsible for 1.3% of Climate Debt and 2.4% of Fossil CO2 Emissions 2016)
2017
The diagram below shows ‘Share of global Climate Debt‘ in 2010, 2015 and 2017 of Poland, Belgium and Brazil (ranked 25th, 26th and 27th). By 2015, the shares of the three countries were similar. Since then, the Polish performance has declined, relatively.
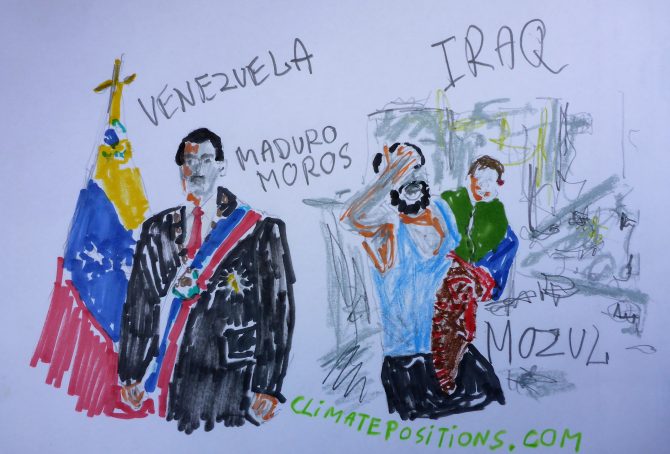
Climate change performance: Venezuela vs. Iraq (world’s proven reserves of oil and natural gas)
2017
Venezuela holds the world’s largest proven oil reserves and the 8th largest proven natural gas reserves, while Iraq ranks 5th on oil and 12th on gas. Together, the two countries hold nearly 27% of the world’s proven reserves of oil and 5% of its natural gas.
The two tables below rank the 15 countries with the largest proven oil and natural gas reserves and their world shares. Combined, the 19 Fossil Fuel countries listed below hold 93% of the world’s proven oil reserves and 88% of the proven natural gas reserves. They represent 38% of the global population, 62% of the global CO2 Emissions from Fossil Fuels (2015) and 74% of the current global Climate Debt in ClimatePositions (the combined share of the global Climate Debt of the 15 countries has increased by 3.6% since 2012; see the ‘Ranking‘.

How green are the fossil fuel producers? (Correlation between fossil fuel production, CO2 Emissions, GDP and Climate Debt)
2015
Greenhouse gas emissions from burning of fossil fuels (oil, natural gas and coal), is the main cause of manmade climate change. Comparable energy potentials of oil, natural gas and coal is defined as “tons oil equivalents”, meaning that the energy released from a given quantity of natural gas or coal is equivalent to one ton of oil. This way the total production of fossil fuels can be expressed in a single figure (not to be confused with market value, global warming potential or general usefulness) The world’s production in million tons oil equivalent, was in 2013: oil (4,130), natural gas (3,041 and coal (3,881).
The table below ranks the twenty countries with the largest per capita fossil fuel production (oil equivalents). Total production data of 68 countries is from ‘BPs Statistical Review of World Energy 2014’ (pdf, 48 pages).
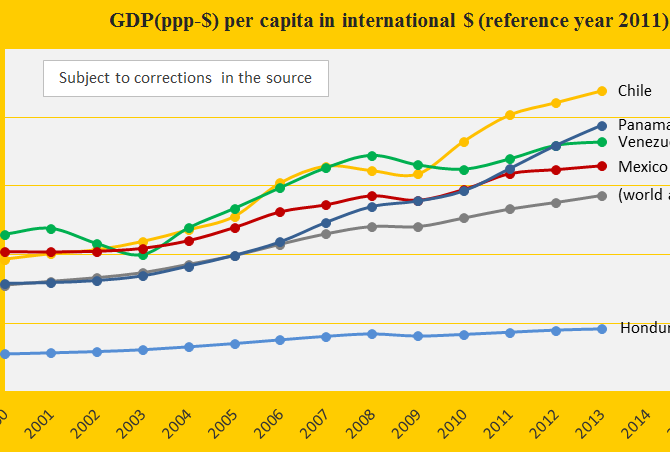
Climate change performance of Venezuela, Chile and Mexico
2015
Venezuela, Chile and Mexico are ranked 42nd, 44th and 58th among 147 countries on the worst performing list in ClimatePositions (see the ‘ranking’). Their updated Climate Contributions (climate debt) are respectively $697, $561 and $313 per capita. The first diagram shows the GDP(ppp-$) per capita of the three countries, in comparison with Panama, Honduras and the world average. Chile is the third wealthiest country in the America’s after (far after!) the United States and Canada – Honduras is the second poorest after Nicaragua.
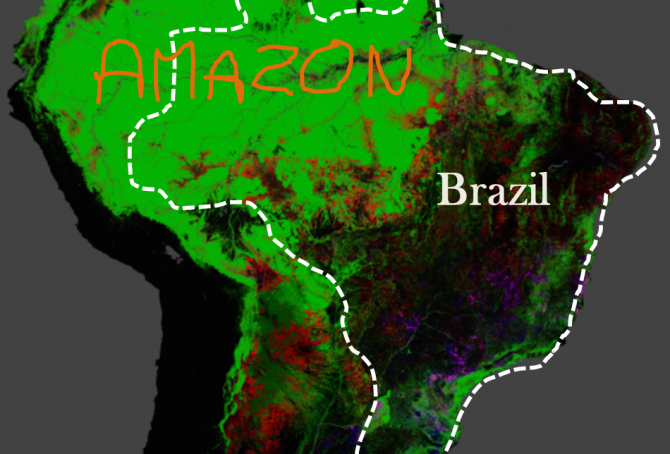
Brazil’s rainforests and climate change performance
2014
The Google map of the Amazon is from the new interactive ‘Global Forest Change‘ developed by The University of Maryland (read ‘more’). The red is Forest Loss from 2000 to 2012, the blue is Forest Gain and the green is Forest Extent (unchanged). The purple is areas of mixed Forest Loss and Forest Gain. According to Brazil’s environment minister the lowest recorded deforestation of Brazil since 1988, was in 2012. Furthermore, up to a third of the cleared rainforest over the past decades may be on the way back (regrowth).
Forest Cover, Primary Forests and climate debt
2014
The national data of Forest Cover and Primary Forest are both included in the calculations of Climate Contributions (debt) in ClimatePositions. Primary Forest was included as an indicator in the worksheet in August 2014. The following describes selected findings on forests from FAO’s ‘The Global Forest Resources Assessments (FRA), 2010’ (main report, pdf, 378 pages). The Assessment is based on two primary sources of data: 1) ‘country reports’ and 2) remote sensing conducted by FAO and partners.
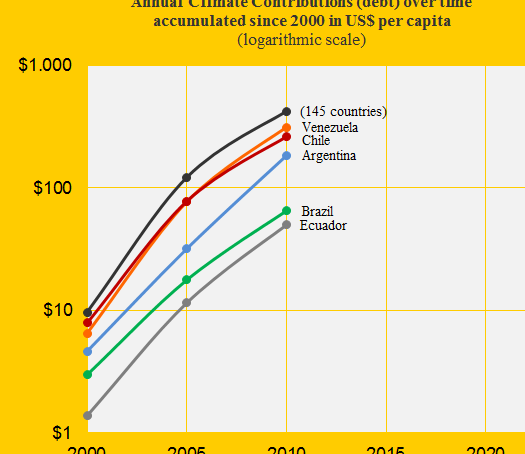
Venezuela loses big to Colombia in climate responsibility
2014
Colombia was Contribution Free in ClimatePositions 2010 and Venezuela was the 43rd worst performing country out of 145 (see the menu “Contributions”). The Venezuelan Climate Contribution (climate debt) was $313 per capita which was the 3rd largest in America after the extreme polluters United States and Canada. The diagram shows the Climate Contributions over time per capita of Venezuela, Chile, Argentina, Brazil, Ecuador and the world average (145 countries). In the updated calculation Venezuela’s Contribution has increased to $428 per capita (worsened two country rankings). The following examines Colombia’s and Venezuela’s CO2 Emissions, Ecological Footprint, Environmental Performance and forest cover.
Trinidad and Tobago uses the planet as CO2 dump
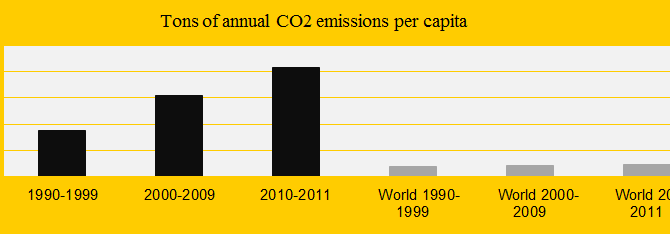
2013
The islands Trinidad and Tobago close to Venezuela in South America gives a damn in global warming. The diagram shows the country’s CO2 Emissions (carbon dioxide) per decade compared to the global average. In 1990-1999 emissions were on average 17.4 tons of CO2 and in 2011 the figure was 42.4 tons. In ClimatePositions 2010 Trinidad and T. was the 5th worst performing country in the world with a Contribution (climate debt) of $6,805 per capita.