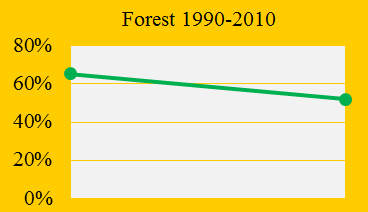
Indonesia fails on deforestation and CO2 Emissions
2013
Indonesia was the 73rd worst performing country out of 145 in ClimatePositions 2010 with a total Climate Contribution (climate debt) of 5.6 billion US$. As shown in the front diagram Indonesia cut down the total forest cover (mainly rainforest) from 65.4% in 1990 to 52.1% in 2010. Had Indonesia maintained the forest cover since 1990, then the saving in Contribution would have been 4.6 billion US$. In the updated calculation the Contribution (debt) has increased to 6.5 billion US$.
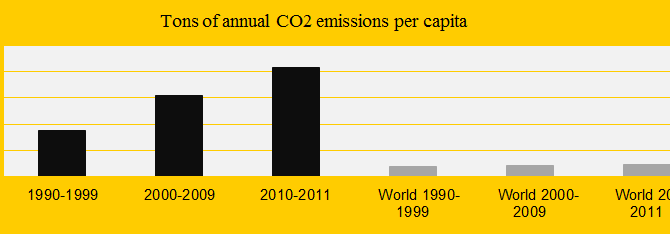
Trinidad and Tobago uses the planet as CO2 dump
2013
The islands Trinidad and Tobago close to Venezuela in South America gives a damn in global warming. The diagram shows the country’s CO2 Emissions (carbon dioxide) per decade compared to the global average. In 1990-1999 emissions were on average 17.4 tons of CO2 and in 2011 the figure was 42.4 tons. In ClimatePositions 2010 Trinidad and T. was the 5th worst performing country in the world with a Contribution (climate debt) of $6,805 per capita.
Guatemala is close to being Contribution Free
2013
Guatemala was the 82nd worst performing country out of 145 full data countries in ClimatePositions 2010. The national Contribution (climate debt) was $4 per capita, but in the latest calculation this amount is cut in half thanks to decreasing CO2 Emissions (carbon dioxide) in 2011 (see the front diagram). In a few months Guatemala may be Contribution Free.

Brazil and the world’s rainforests
2013
Brazil was the 63rd worst performing country in ClimatePositions 2010 with a total Climate Contribution (climate debt) of 12.4 billion US$. In the latest calculation the debt has increased to 15.3 billion US$. Between 1990 and 2010 Brazil cut down the total forest cover (mainly rainforest) from 69.0% to 62.4%.

Global warming: China in its own CO2 Emission league
2013
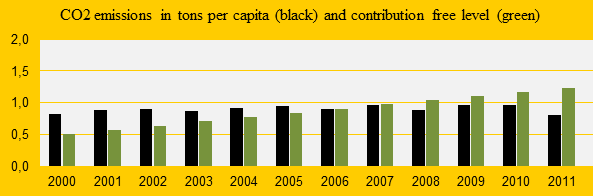
Global warming is caused mainly by human CO2 Emissions.The diagram above shows China’s annual CO2 Emissions (carbon dioxide) in tons per capita 2000-2011 (the black bars). The green bars show the Contribution Free Levels in ClimatePositions. The free level of CO2 Emissions is dependent on various indicators (see the menu “Calculations/Indicators”). China was the 57th worst performing country out of 145, in terms of Contribution (climate debt) per capita. The total national Contribution increased from 26 billion US$ in 2005 to 185 billion in 2010. This explosive negative development is outstanding in the world and China is now by far the largest CO2 Emitter.

Impressive performance by Costa Rica
2013
In 2010 ‘Costa Rica‘ was the only Contribution Free, full democratic country with a GDP(ppp-$) above the global average. The diagram above shows the national CO2 Emissions per capita (the black bars) and the Contribution Free Levels of CO2 Emissions (the green bars) in 2000-2011. Note that Costa Rica could have increased CO2 Emissions (carbon dioxide) from 1.2 ton CO2 per capita in 2000 to 1.9 tons in 2011 and still be Contribution free, due to other fine indicator values.

Rainforest in Ecuador and global funding
2013
Ecuador was the 68th worst performing country out of 145 in ClimatePositions 2010, but the Climate Contribution (debt) was entirely due to reductions in rainforest since 1990. The diagram shows the forest coverage in percent of the total area in 1990 (49.9%) and 2010 (35.6%). The total national Contribution (debt) was 626 million US$ in 2010.