
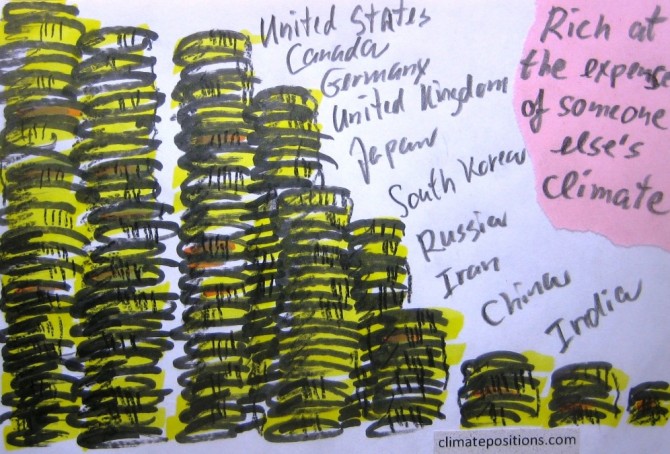
Preliminary Carbon Dioxide Emissions 2014, by country
2015
’The Global Carbon Project’ at Carbon Dioxide Information Analysis Center (CDIAC) has published preliminary CO2 Emissions from fossil fuels and cement for 2014, for more than 200 countries. The data is being used in a preliminary calculation of accumulated Climate Debt in ClimatePositions¹. The table below shows the estimated per capita emissions plus the updated Climate Debts, of the twenty largest total emitters (responsible for 77% of the global emissions in 2014).
Analyses of the global CO2 target and GDP(ppp-$)
2015
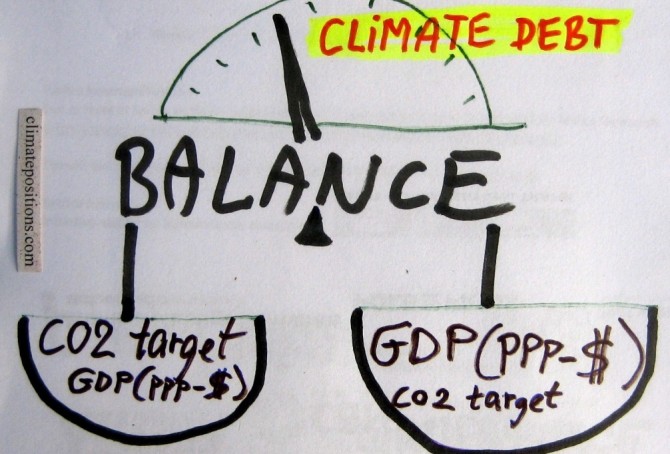
The calculation of Climate Debt in ClimatePositions is based on a balance between many ‘indicators’ and a common global per capita CO2 target. To illustrate the nature of this balance twelve countries are analyzed in this article in terms of the indicator of GDP(ppp-$) and the global CO2 target. The 12-Countries Group represents 38% of the global population, 65% of the global CO2 Emissions from fossil fuels and around 70% of the global Climate Debt.
Fossil fuel subsidies: $5.3 trillion in 2015 (IMF survey)
2015
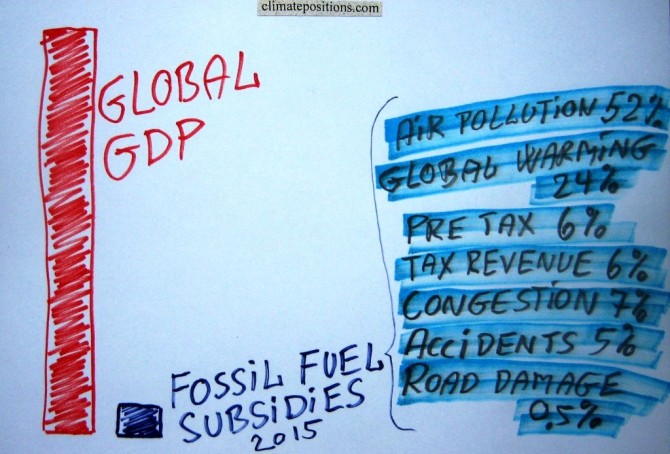
Estimates from the ‘International Monetary Fund’ (IMF) show that fossil fuel subsidies of 155 countries representing 98% of the world’s population, amounted $4.2 trillion (5.8% of global GDP) in 2011 and $4.9 trillion (6.5% of global GDP) in 2013. Projections for 2015 suggest $5.3 trillion (6.5% of global GDP). This huge amount of subsidies is of cause plain stupid.
For comparison, the total ‘Climate Debt of 147 countries‘ in ClimatePositions, accumulated between 2000 and 2013, amounted $5.2 trillion. Roughly speaking, one year of global subsidies equals the total accumulated Climate Debt. Note that global climate change funding is only around $0.14 trillion.
Climate change performance: Japan vs. South Korea
2014
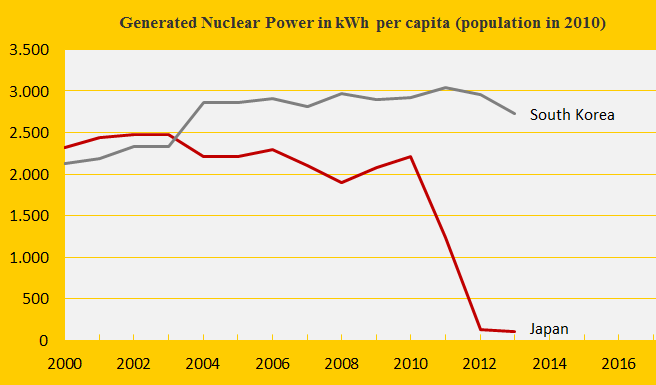
The first diagram shows the nuclear power generation per capita of the two countries. The Fukushima nuclear disaster in Japan in 2011 has caused a remarkable shutdown of generation – while CO2 Emissions from the burning of petroleum, coal and natural gas have increased (from 2011 to 2012 respectively by 6%, 5% and 3%) to close the energy gap. Nuclear power generation produce dangerous radioactive waste to deal with for thousands of future generations (10,000 to 250,000 years) and in ClimatePositions nuclear power is not accepted as a national CO2 Emission reduction instrument (read ‘more’). The following analyzes the indicator trends of Japan and South Korea.
New ranking 2014 – update of 147 countries’ climate debt
2014
The data in ClimatePositions are updated consecutively and since the data year 2010 the eleven ‘indicators’ have all been updated.
The new rankings of 147 countries are now available in the menu “Contributions” (with six categories).
All country data and diagrams are available in the menu ‘Calculations (Excel)’. In the coming months selected countries will be analyzed in articles. The following illustrates the latest updates in two ways: 1) The change of climate debt as a percentage of the global climate debt of the twelve largest CO2 emitters, and 2) The key-figures of the United Kingdom.
Nuclear Power updates 2013
2014
The world’s Nuclear Power generation increased marginally in 2013 compared to 2012. The last four years of generated global nuclear electricity was:
- 2010: 2,629 billion kWh
- 2011: 2,516 billion kWh
- 2012: 2,346 billion kWh
- 2013: 2,359 billion kWh
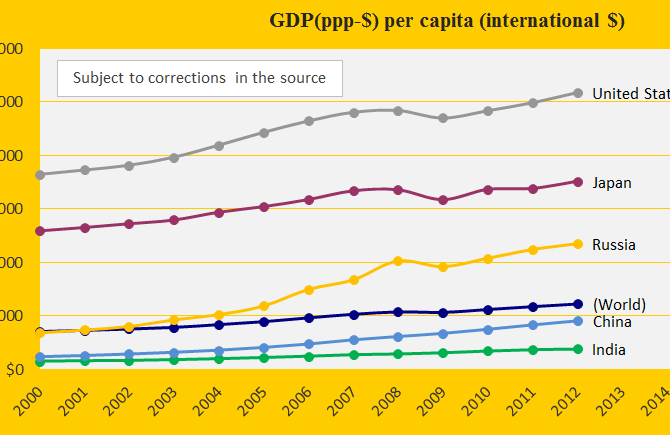
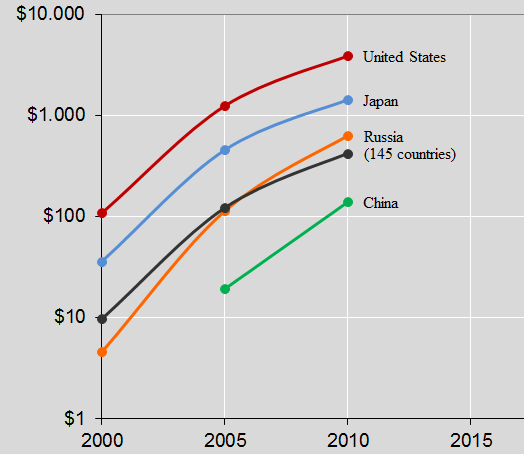
2012 update of GDP in ClimatePositions
2014
The annual national GDP(ppp-$) (standard of living measured by purchasing power) has a direct impact on the Climate Contributions. Updating of GDP for 2011 and 2012 are now entered ClimatePositions (Excel) and for most countries, this means considerable increases in the Climate Contribution (climate debt). In connection with the GDP update, a minor simplification of the calculation method has been made (recent years are still weighted more than previous years in GDP+).
The diagram shows the updated (and revised) GDP(ppp-$) 2000-2012 for the five largest CO2 Emitters: China, United States, Russia, India and Japan.
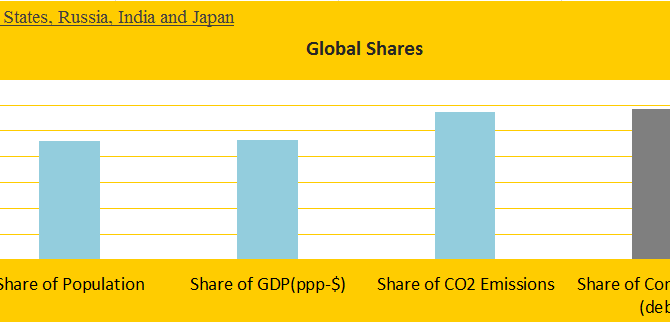
COP19 negotiating positions: China, United States, India, Russia and Japan
2014
The world’s five largest CO2 emitters – China, United States, Russia, India and Japan – are responsible for 57% of global CO2 Emissions (2006-2010) and 58% of the Climate Contributions (climate debt) in ClimatePositions 2010 (see the front diagram). Add to the group the populous Contribution Free countries Pakistan, Bangladesh, Nigeria, Philippines and Ethiopia and the total share would almost reflect the world average of Population (56%), CO2 Emissions (59%) and Climate Contributions (58%). Leaders of these ten countries sitting around an imaginary negotiating table should be able to create a global climate agreement with binding CO2 reductions and full financing – but it will not happen!
The following depicts the submissions, basic statistics and negotiating positions at COP19 in Warsaw of the five largest CO2 emitters. See the five countries’ Contributions over time ‘here‘, the Contributions as a percentage of GDP ‘here‘ and read about the COP19 country groups ‘here‘.
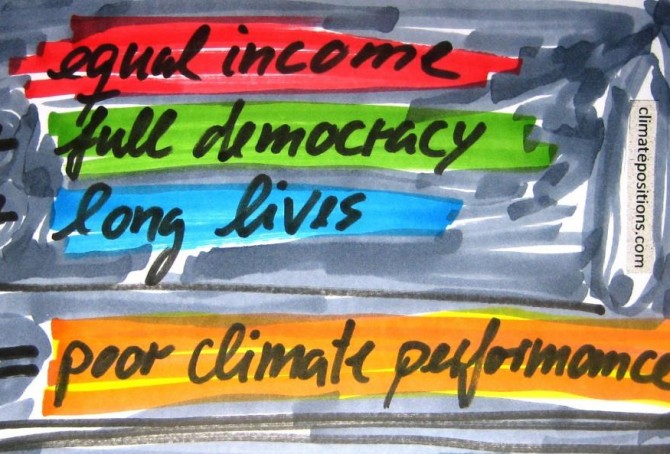
Income Equality, Life Expectancy, Democracy Index … and Climate Contributions
2014
123 out of 145 countries with full data in ClimatePositions are included in an inventory of Income Equality (see the source at the bottom), which shows how much the 10% poorest earns compared to the 10% richest. 53 out of the 123 countries are Contribution Free (no climate debt) in ClimatePositions 2010 and 70 countries are not.
The table below shows the difference between the two groups of countries in terms of Income Equality, Life Expectancy, number of Full Democracies and number of Authoritarian Regimes. To clarify the trend the 20 countries with the largest Climate Contributions appear at the top of the table. The 123 countries represent 95% of the world population.
Climate Contributions as a percentage of GDP for the top ten CO2 Emitters
2013
The top ten CO2 Emitters were responsible for 67% of the global CO2 Emissions in 2006-2010. Adjusting the national Contributions (climate debt) for the size of the GDP(ppp-$) is essential. Allowing the wealthy United States get away with paying the same dollar price of a ton of CO2 (carbon dioxide) exceeded as China is of course absurd. The countries’ climate change performances are measured indirectly as the Contributions’ percentage of the national GDP(ppp-$).
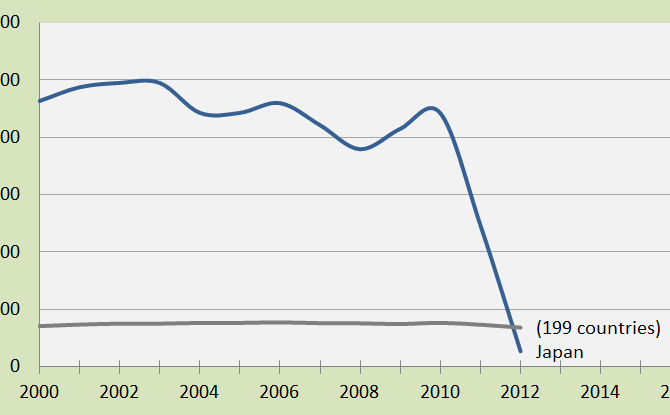
South Korea is going backwards in climate performance
2013
South Korea was the 15th worst performing country out of 145 in ClimatePositions 2010 with a Climate Contribution (climate debt) of $1,904 per capita. As shown in the front diagram the South Korean annual CO2 Emissions (carbon dioxide) have continued to increase in 2011 (12.5 tons per capita) and today the Contribution is $2,297 per capita. The updated calculations for all 145 countries are available in the submenu “Calculations (Excel)”.
Top 5 CO2 Emitters’ Climate Contributions (climate debt) over time
2013
The 5 largest CO2 Emitters in 2006-2010 were 1. China (23,2%), 2. United States (19,7%), 3. Russia (5,3%), 4. India (5,1%) and 5. Japan (4,0%). These 5 countries accounted for 57,3% of the global CO2 Emissions (carbon dioxide). The diagram above shows the Contributions (climate debt) per capita in 2000, 2005 and 2010 (the black line is the global average). India was Contribution Free. Note the logarithmic scale. On the list of the worst performing countries (climate debt per capita) the ranking in 2010 was as follows: United States (no. 7), Japan (no. 18), Russia (no. 31), China (no. 57) and India (Contribution Free). See the full country list in the menu Contributions/Per Capita US$ Rank.
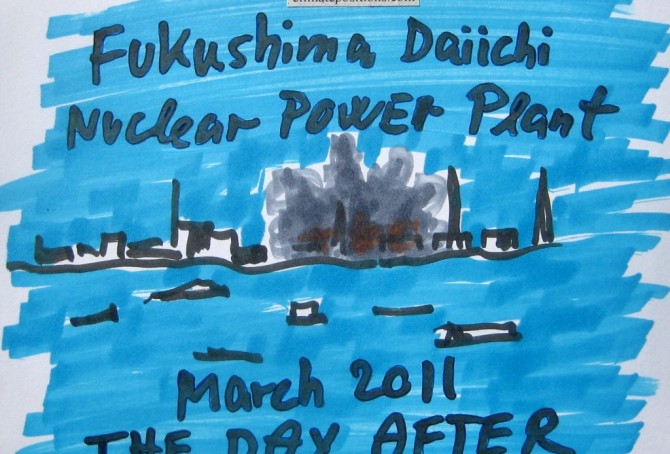
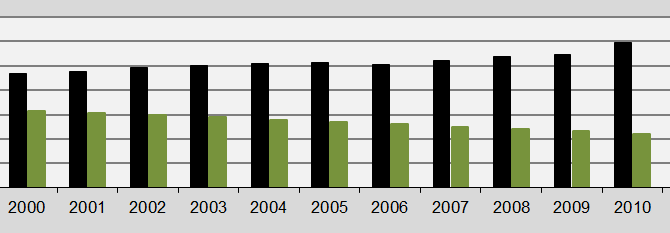
Nuclear Power shut down in Japan
2013
In 2010 Japan was the 3rd largest Nuclear Power producer, but after the tragic Fukushima nuclear disaster in March 2011, the country dropped to no. 18 in 2012. The diagram shows Japan’s Nuclear Power generation in kWh per capita 2000-2012. The grey line shows the global generation per capita.