Update 2013 of the CO2 Content in the atmosphere
2014
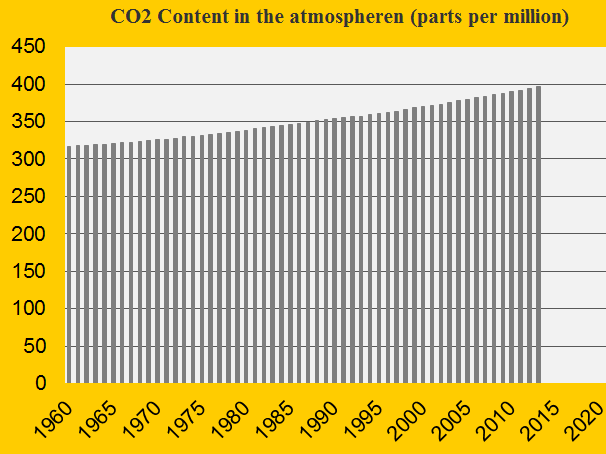
The CO2 Content in the atmosphere measured in ppm (parts per million) is skyrocketing because of the increase in human-caused emissions. In 2012 the content was 393.82 ppm and in 2013 it was 396.48 (this updated figure is used in ClimatePositions). Some scientists estimate that 350 ppm is the “safe” limit of CO2 in the atmosphere. See the development 1960-2013 in the diagram. This is the main cause of Global Warming, Climate Change (extreme weather phenomena) and rising Sea Level.
2012 update of GDP in ClimatePositions
2014
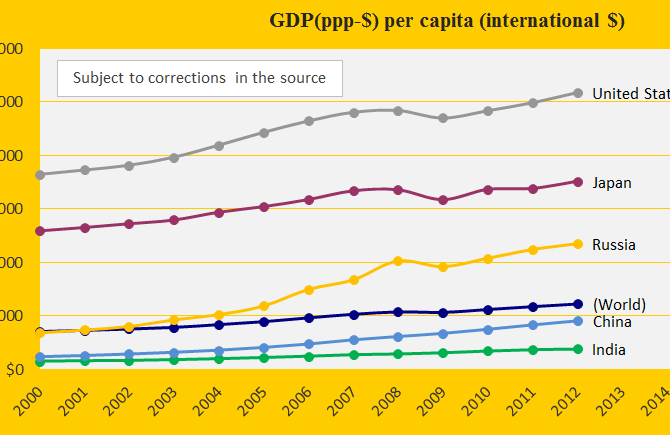
The annual national GDP(ppp-$) (standard of living measured by purchasing power) has a direct impact on the Climate Contributions. Updating of GDP for 2011 and 2012 are now entered ClimatePositions (Excel) and for most countries, this means considerable increases in the Climate Contribution (climate debt). In connection with the GDP update, a minor simplification of the calculation method has been made (recent years are still weighted more than previous years in GDP+).
The diagram shows the updated (and revised) GDP(ppp-$) 2000-2012 for the five largest CO2 Emitters: China, United States, Russia, India and Japan.

Global warming: Air Temperature update 2013
2014
2013 was the 4th warmest year recorded of land Air Temperature since measurements began in 1880. See the development 1960-2013 in the diagram (the average temperature rise in 1880-1937 is set at 0°C). The last ten years of average temperature rise is the figure used in ClimatePositions.
Sweden with Nuclear Power and Norway with oilfields
2014
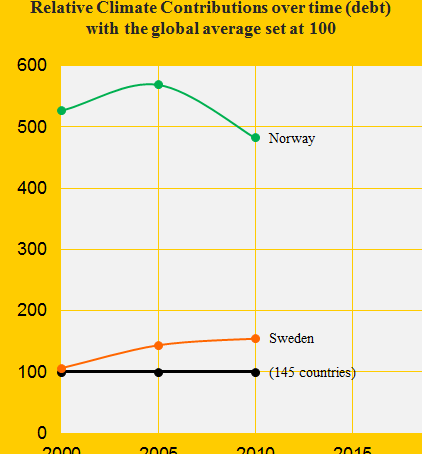
In ClimatePositions 2010, Norway was the 14th worst performing country – Sweden was number 30. See the relative Contributions per capita over time in the diagram. Norway, with only 0.07% of the world’s population, produces 2.80% of the world’s oil (crude extracted from reserves). In 2011, Norway was the world’s 14th largest oil producer. The neighboring country Sweden has no oil production but has the world’s largest Nuclear Power generation per capita.
The following examines the indicators: CO2 Emissions, Ecological Footprint, GDP(ppp-$) and Nuclear Power.
COP19 negotiating positions: China, United States, India, Russia and Japan
2014
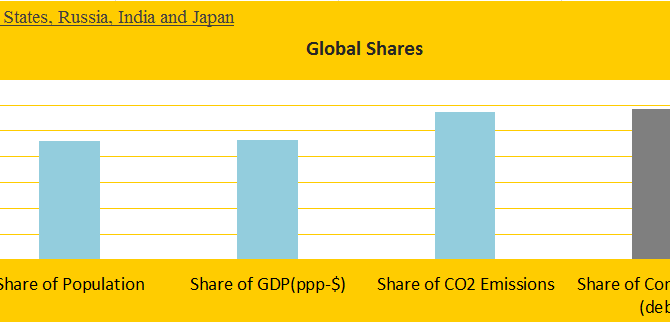
The world’s five largest CO2 emitters – China, United States, Russia, India and Japan – are responsible for 57% of global CO2 Emissions (2006-2010) and 58% of the Climate Contributions (climate debt) in ClimatePositions 2010 (see the front diagram). Add to the group the populous Contribution Free countries Pakistan, Bangladesh, Nigeria, Philippines and Ethiopia and the total share would almost reflect the world average of Population (56%), CO2 Emissions (59%) and Climate Contributions (58%). Leaders of these ten countries sitting around an imaginary negotiating table should be able to create a global climate agreement with binding CO2 reductions and full financing – but it will not happen!
The following depicts the submissions, basic statistics and negotiating positions at COP19 in Warsaw of the five largest CO2 emitters. See the five countries’ Contributions over time ‘here‘, the Contributions as a percentage of GDP ‘here‘ and read about the COP19 country groups ‘here‘.
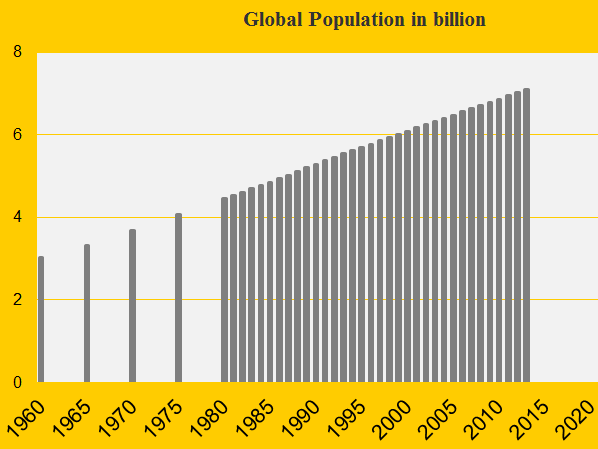
Global Population update 2013
2014
The growing Global Population puts additional pressure on the distressed nature (deforestation, pollution, declining biodiversity, etc.) and increases the total CO2 Emissions. From 2012 to 2013 the population is estimated to have increased from 7.02 to 7.09 billion – an increase of 77 million in one year. See the development 1960-2013 in the diagram.
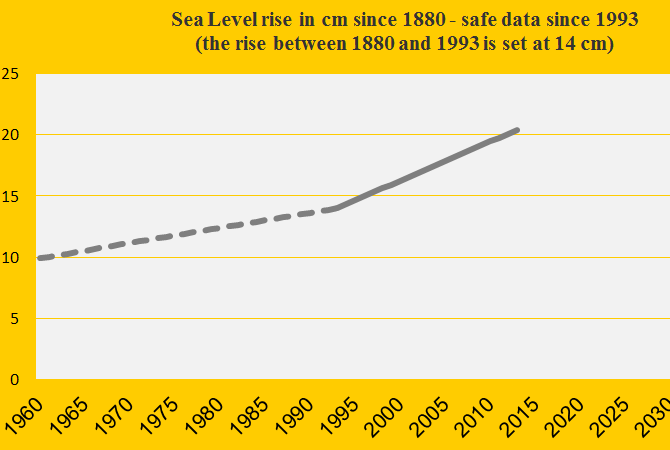
Sea Level update 2013
2014
The measurements of global Sea Level are very complicated and end up in a single figure for average annual Sea Level rise since 1993. From 2012 to 2013, the increase rate is unchanged 0.32 cm annually (since 1993). The total increase between 1880 and 1993 is set at 14 cm (with uncertainty). This adds up to a total Sea Level rise from 1880 to 2013 at 20.40 cm – the figure used in ClimatePositions. See the development in Sea Level 1960-2013 in the diagram (the level in 1880 is set at 0).
Income Equality, Life Expectancy, Democracy Index … and Climate Contributions
2014
123 out of 145 countries with full data in ClimatePositions are included in an inventory of Income Equality (see the source at the bottom), which shows how much the 10% poorest earns compared to the 10% richest. 53 out of the 123 countries are Contribution Free (no climate debt) in ClimatePositions 2010 and 70 countries are not.
The table below shows the difference between the two groups of countries in terms of Income Equality, Life Expectancy, number of Full Democracies and number of Authoritarian Regimes. To clarify the trend the 20 countries with the largest Climate Contributions appear at the top of the table. The 123 countries represent 95% of the world population.