Colombia – per capita Fossil CO2 Emissions (zero Climate Debt)
2020
Although Colombia’s accumulated Climate Debt is zero, the country is the world’s 45th largest emitter of Fossil CO2.
The following diagrams expose the trends of Fossil CO2 Emissions, GDP(ppp-$), Forest Cover, Primary Forest and Environmental Performance.
Chile – per capita Fossil CO2 Emissions and Climate Debt
2020
Chile’s current Climate Breakdown Pricing amounts to $11.78 per tons Fossil CO2 emitted since 2000. The Climate Debt grew from $437 per capita in 2015 to $934 in 2020. Updated Rankings of 165 countries are available in the menu “Climate Debt”.
The following diagrams expose the trends of Fossil CO2 Emissions, Climate Debt, GDP(ppp-$), Forest Cover, Primary Forest and Ecological Footprint without carbon.

Nigeria – per capita Fossil CO2 Emissions (zero Climate Debt)
2020
Although Nigeria’s accumulated Climate Debt is zero, the populous country is the world’s 38th largest emitter of Fossil CO2.
The following diagrams expose the trends of Fossil CO2 Emissions, GDP(ppp-$), Environmental Performance, Forest Cover and Primary Forest.

Venezuela – per capita Fossil CO2 Emissions and Climate Debt (economic collapse)
2020
Venezuela’s current Climate Breakdown Pricing amounts to $10.04 per tons Fossil CO2 emitted since 2000. The Climate Debt grew from $655 per capita in 2015 to $1,045 in 2020. However, once updated data on national GDP(ppp-$) is released, then the current Climate Debt will prove to be considerably smaller (more below). Updated Rankings of 165 countries are available in the menu “Climate Debt”.
The following diagrams expose the trends of Fossil CO2 Emissions, GDP(ppp-$), Climate Debt, Forest Cover, Primary Forest and Ecological Footprint without carbon.
Philippines – per capita Fossil CO2 Emissions (zero Climate Debt)
2020
Although the accumulated Climate Debt of the Philippines is zero, the populous country is the world’s 35th largest emitter of Fossil CO2.
The following diagrams expose the trends of Fossil CO2 Emissions, GDP(ppp-$), Forest Cover, Primary Forest and Ecological Footprint without carbon.
Vietnam – per capita Fossil CO2 Emissions and Climate Debt
2020
Vietnam’s current Climate Breakdown Pricing amounts to $0.88 per tons Fossil CO2 emitted since 2000. The Climate Debt grew from $6 per capita in 2015 to $26 in 2020. Updated Rankings of 165 countries are available in the menu “Climate Debt”.
The following diagrams expose the trends of Fossil CO2 Emissions, Climate Debt, GDP(ppp-$), Forest Cover, Primary Forest and Ecological Footprint without carbon.
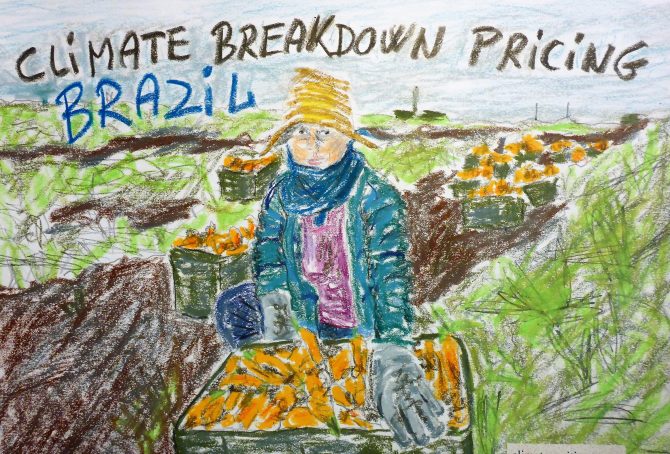
Brazil – per capita Fossil CO2 Emissions and Climate Debt
2020
Brazil’s current Climate Breakdown Pricing amounts to $5.74 per tons Fossil CO2 emitted since 2000. The Climate Debt grew from $108 per capita in 2015 to $246 in 2020. Updated Rankings of 165 countries are available in the menu “Climate Debt”.
The following diagrams expose the trends of Fossil CO2 Emissions, Climate Debt, GDP(ppp-$), Ecological Footprint without carbon, Forest Cover and Primary Forest.
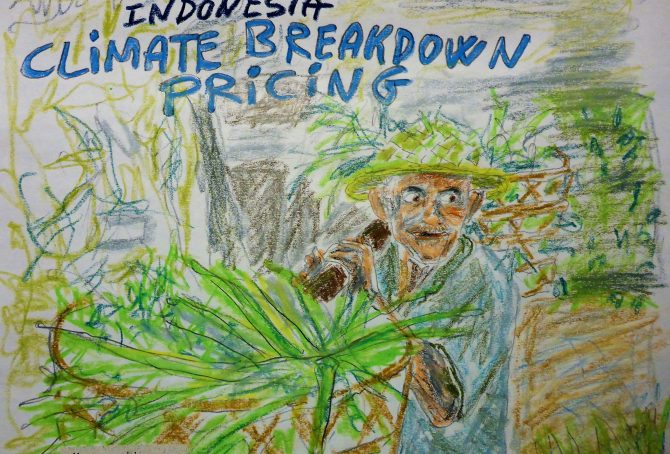
Indonesia – per capita Fossil CO2 Emissions and Climate Debt
2020
Indonesia’s current Climate Breakdown Pricing amounts to $4.50 per tons Fossil CO2 emitted since 2000. The Climate Debt grew from $82 per capita in 2015 to $147 in 2020. Updated Rankings of 165 countries are available in the menu “Climate Debt”.
The following diagrams expose the trends of Fossil CO2 Emissions, Climate Debt, GDP(ppp-$), Ecological Footprint without carbon, Forest Cover and Primary Forest.
India – per capita Fossil CO2 Emissions (zero Climate Debt)
2020
In the calculation of Climate Debt, India is especially interesting because it has zero Climate Debt despite the fact that the country is the 3rd largest emitter of Fossil CO2. As it appears, India will enter the next 20-year period in ClimatePositions (2020-2039) without any Fossil CO2 Emissions exceeded. The final calculation will be made, when data on Fossil CO2 Emissions 2019 are released.
The following diagrams expose the trends of Fossil CO2 Emissions, GDP(ppp-$), Ecological Footprint without carbon, Forest Cover and Primary Forest.
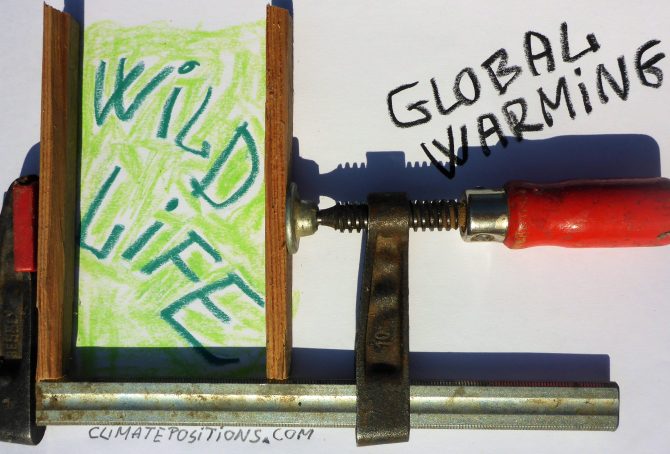
Global Warming: Goodbye World Wildlife Heritage
2018
World Wildlife Heritage is miraculous. However, human caused Climate Change is a brutal attack on the biodiverse wildlife on Earth. In a recent analysis ‘Published in the journal Science‘ data were gathered on geographic ranges and current climate conditions of 31,000 insect species, 8,000 birds, 1,700 mammals, 1,800 reptiles, 1,000 amphibians and 71,000 plants. Then, it was calculated how the ranges change when global warming means some regions can no longer support particular species. The analysis only took global warming as such into consideration, not the impact of lost interactions between species or the impacts of more extreme weather events; nor the interaction with wildlife degradation for other reasons.
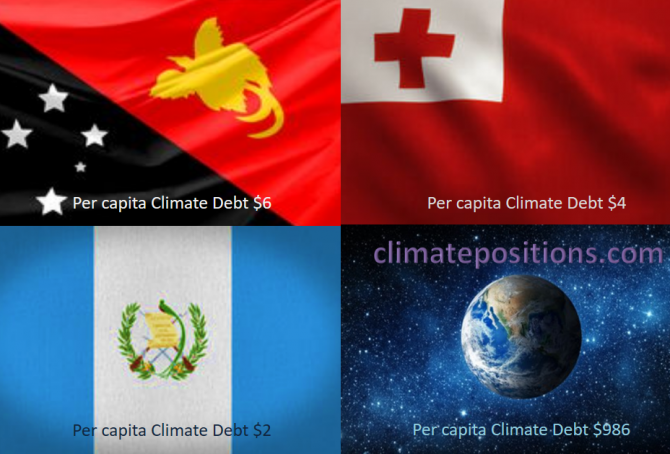
Share of global Climate Debt rank 88th, 89th and 90th: Papua New Guinea, Guatemala, Tonga (combined responsible for 0.001% of Climate Debt and 0.078% of Fossil CO2 Emissions 2016)
2018
The diagram below shows ‘Share of global Climate Debt‘ in 2010, 2015 and 2017 of Papua New Guinea, Guatemala and Tonga (ranked 88th, 89th and 90th). All three countries had zero Climate Debt in 2010, Tonga even in 2015.
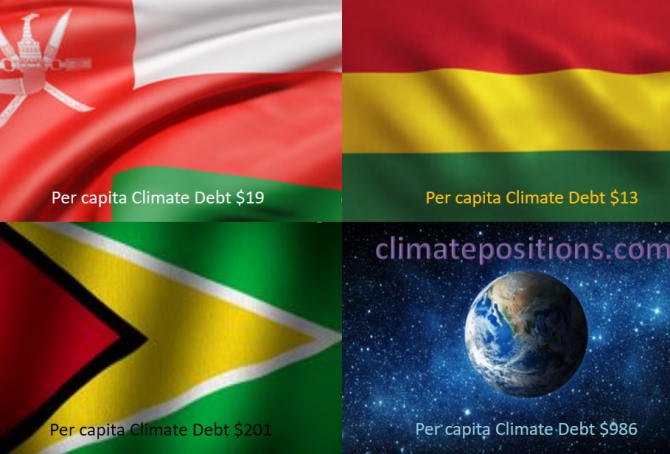
Share of global Climate Debt rank 85th, 86th, and 87th: Honduras, Guyana and Bolivia (combined responsible for 0.006% of Climate Debt and 0.090% of Fossil CO2 Emissions 2016)
2018
The diagram below shows ‘Share of global Climate Debt‘ in 2010, 2015 and 2017 of Honduras, Guyana and Bolivia (ranked 85th, 86th, and 87th). The share of Honduras decreased significantly during the period. The global Climate Debt accumulated since 2000 is $7.2 Trillion.
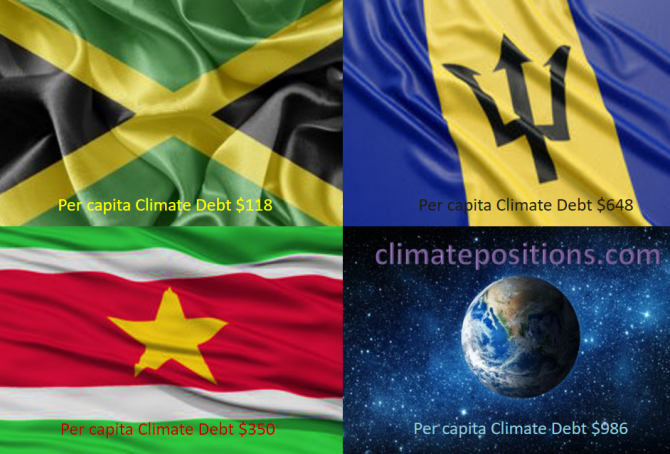
Share of global Climate Debt rank 82nd, 83rd, and 84st: Jamaica, Suriname and Barbados (combined responsible for 0.01% of Climate Debt and 0.04% of Fossil CO2 Emissions 2016)
2018
The diagram below shows ‘Share of global Climate Debt‘ in 2010, 2015 and 2017 of Jamaica, Suriname and Barbados (ranked 82nd, 83rd, and 84st). The accumulated global Climate Debt is $7.2 Trillion.
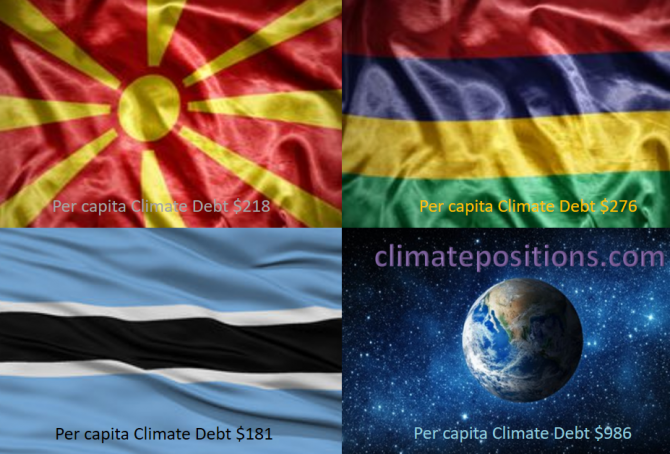
Share of global Climate Debt rank 79th, 80th, and 81st: Macedonia, Botswana and Mauritius (combined responsible for 0.02% of Climate Debt and 0.05% of Fossil CO2 Emissions 2016)
2018
The diagram below shows ‘Share of global Climate Debt‘ in 2010, 2015 and 2017 of Macedonia, Botswana and Mauritius (ranked 79th, 80th, and 81st). The global Climate Debt, accumulated since 2000, is $7.2 Trillion.
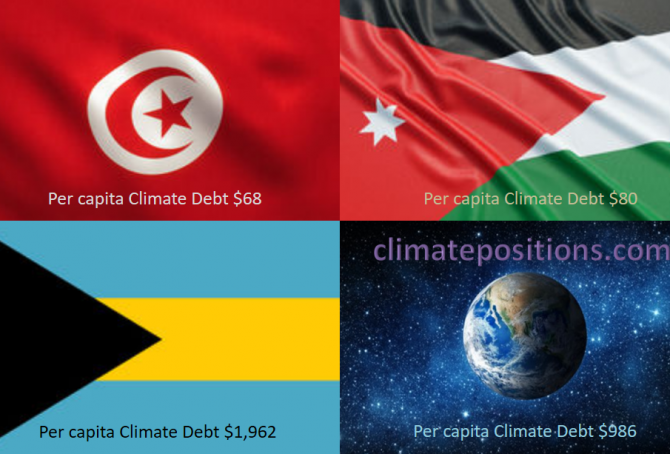
Share of global Climate Debt rank 76th, 77th and 78th: Tunisia, Bahamas and Jordan (combined responsible for 0.03% of Climate Debt and 0.16% of Fossil CO2 Emissions 2016)
2018
The diagram below shows ‘Share of global Climate Debt‘ in 2010, 2015 and 2017 of Tunisia, Bahamas and Jordan (ranked 76th, 77th and 78th). The share of Tunisia is continuously declining, whereas the shares of Bahamas and Jordan are uneven.
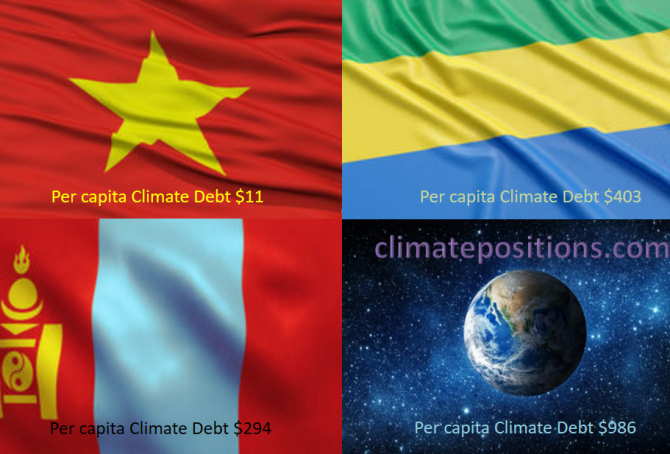
Share of global Climate Debt rank 73rd, 74th and 75th: Vietnam, Mongolia and Gabon (combined responsible for 0.04% of Climate Debt and 0.64% of Fossil CO2 Emissions 2016)
2018
The diagram below shows ‘Share of global Climate Debt‘ in 2010, 2015 and 2017 of Vietnam, Mongolia and Gabon (ranked 73rd, 74th and 75th). The shares of Vietnam and Mongolia are both growing continuously. Vietnam and Gabon had zero Climate Debt in 2010.

Share of global Climate Debt rank 70th, 71st and 72nd: Equatorial Guinea, Panama and Dominican Republic (combined responsible for 0.05% of Climate Debt and 0.10% of Fossil CO2 Emissions 2016)
2018
The diagram below shows ‘Share of global Climate Debt‘ in 2010, 2015 and 2017 of Equatorial Guinea, Panama and Dominican Republic (ranked 70th, 71st and 72nd). The share of Panama is continuously growing, whereas the shares of Equatorial Guinea and Dominican Republic are uneven.
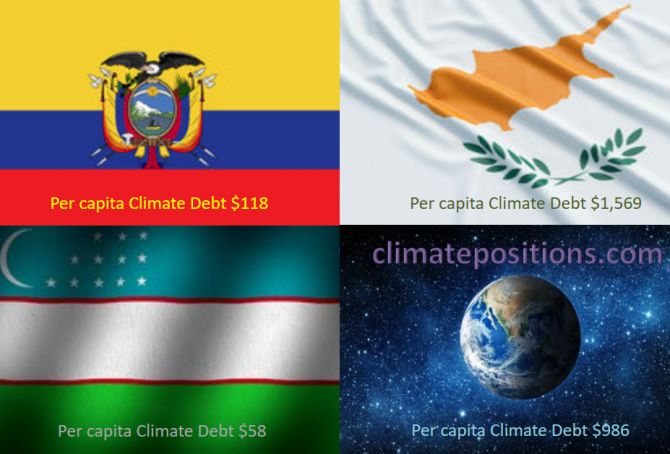
Share of global Climate Debt rank 67th, 68th and 69th: Ecuador, Uzbekistan and Cyprus (combined responsible for 0.08% of Climate Debt and 0.44% of Fossil CO2 Emissions 2016)
2018
The diagram below shows ‘Share of global Climate Debt‘ in 2010, 2015 and 2017 of Ecuador, Uzbekistan and Cyprus (ranked 67th, 68th and 69th). The share of Cyprus is continuously decreasing.
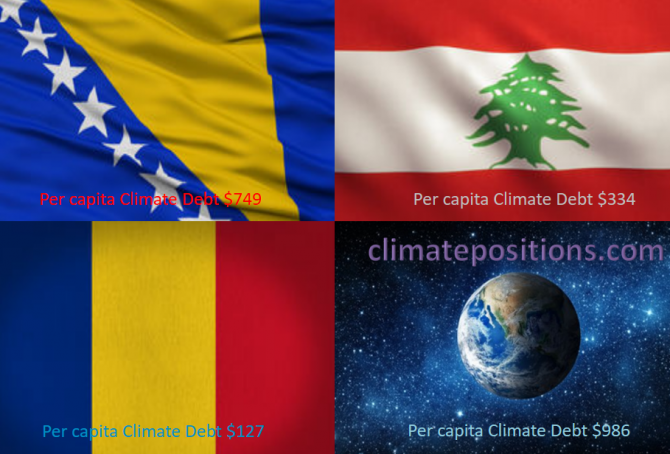
Share of global Climate Debt rank 64th, 65th and 66th: Bosnia and Herzegovina, Romania and Lebanon (combined responsible for 0.10% of Climate Debt and 0.35% of Fossil CO2 Emissions 2016)
2018
The diagram below shows ‘Share of global Climate Debt‘ in 2010, 2015 and 2017 of Bosnia and Herzegovina, Romania and Lebanon (ranked 64th, 65th and 66th). The shares of Romania and Lebanon are ups and downs, while the share of Bosnia and Herzegovina is steadier.
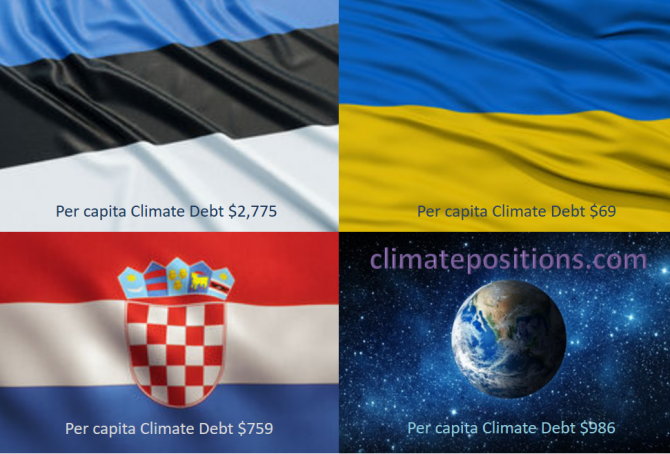
Share of global Climate Debt rank 61st, 62nd and 63rd: Estonia, Croatia and Ukraine (combined responsible for 0.14% of Climate Debt and 0.77% of Fossil CO2 Emissions 2016)
2018
The diagram below shows ‘Share of global Climate Debt‘ in 2010, 2015 and 2017 of Estonia, Croatia and Ukraine (ranked 61st, 62nd and 63rd). The shares of Estonia and Ukraine are increasing, whereas the share of Croatia is decreasing.