UN Sustainable Development Goals (Global Goals) and greenhouse gas emissions
2017
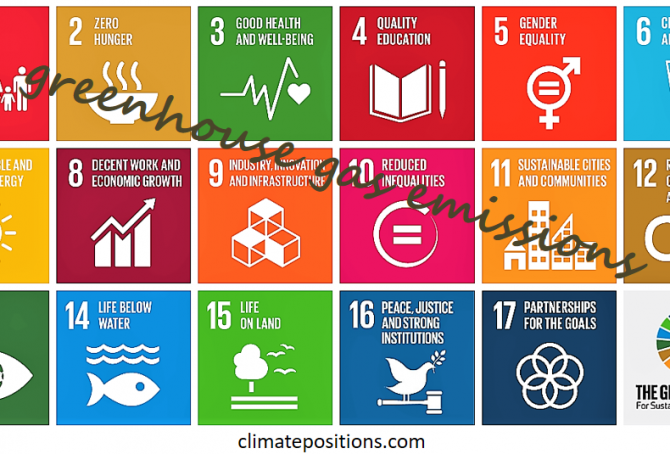
UNs 17 ‘Sustainable Development Goals‘, or Global Goals, consist of simple headings with underlying ‘Clarifications and indicators‘ (pdf, 25 pages) that interact with each other in complex ways. The following examines the links between The Global Goals and greenhouse gas emissions.
Global Goal 13: “Take urgent action to combat climate change…”. The action is indicated by the number of countries that have communicated (..) an integrated policy/strategy/plan which increases their ability to (..) foster (..) low greenhouse gas emissions development in a manner that does not threaten food production.
In other words, the key action-instrument to ensure that global temperatures rise no more than 2°C is national plans to promote low emissions without reducing food production. Consequently, all goals related to food production will have to be included the survey.
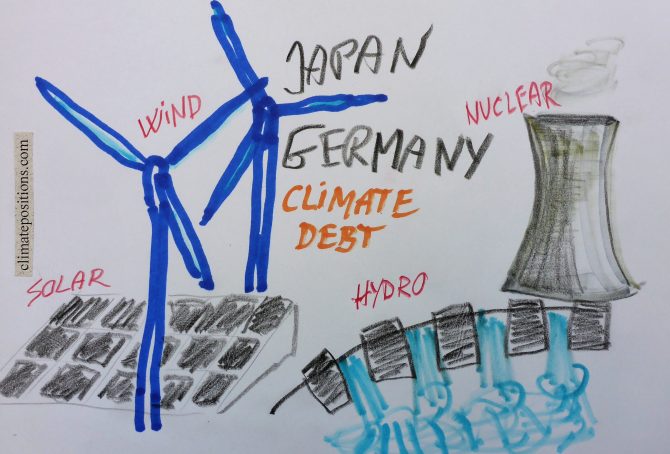
Climate change performance: Japan vs. Germany (Renewable Energy and Nuclear Power)
2016
The world’s 5th and 6th largest emitters of CO2 from Fossil Fuel (without bunkers) and cement Japan and Germany, were responsible for 3.4% and 2.1% of the global emissions in 2015. The diagrams below show the per capita CO2 Emissions, annually since 2000. The green bars show the Free Emission Level¹ – the exceedance is the basis for calculating the national Climate Debt.

Climate change performance of the United Kingdom in comparison with the European Union
2016
Given that the United Kingdom (UK) has decided to leave the European Union (EU), the following examines the development of CO2 Emissions, Ecological Footprint, GDP(ppp-$) and Climate Debt of the UK in comparison with EU.
Between 1860 and 1890 the UK was the world’s largest greenhouse gas emitter and as late as 1966 the UK was still the 4th largest emitter. See this ‘Interactive timeline of the world’s top 20 emitters‘. When it comes to CO2 Emissions from fossil fuels (without bunker fuels) and cement production the UK was the world’s 15th largest emitter in 2014 (preliminary).
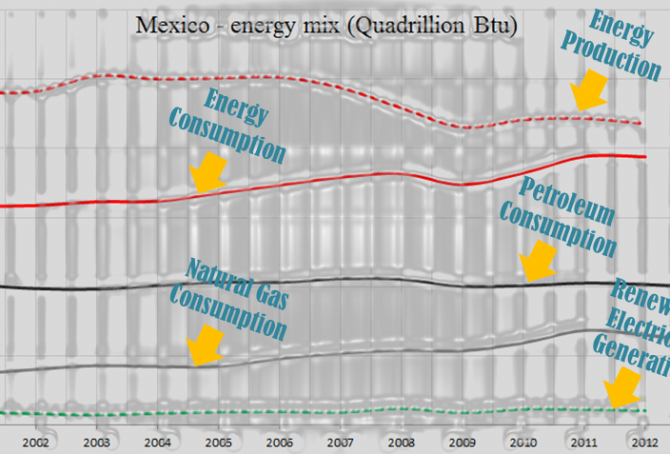
Mexico – the world’s 14th largest CO2 emitter (with an enormous solar potential)
Mexico’s current Climate Debt is $346 per capita and the ‘Ranking’ was 56th among 148 countries by January 2016. The following examines the Mexican CO2 Emissions, Climate Debt, Environmental Performance and GDP(ppp-$), in comparison with the United States, China, Brazil and Germany.

Climate Debt: Bahrain ranks 12th (immigrant workers reduce per capita CO2 Emissions)
Bahrain’s current Climate Debt, accumulated since 2000, is $3,352 per capita. The ‘Ranking’ by January 2016 was 12th among 148 countries. Although the total Bahraini CO2 Emissions from fossil fuels and cement production have increased about 100% since 1990, and 35% since 2006, the per capita emissions have declined from 27.2 tons in the 1990s to 17.9 tons in 2011 – how can that be?
The key explanation is simple: immigration of great numbers of (often) ‘Slavery-like workers‘, presumably with low individual emissions, has lowered the national average! Today around 55% of Bahrain’s population are immigrants from India, Bangladesh, Pakistan, the Philippines, Indonesia, Jordan, Syria, Yemen, Nepal, East Africa etc. If the immigrant-emissions hypothetically is set at 2 tons of CO2 per capita on average (which is more than their origin countries on average), then the 45% native Bahraini’s emitted 38 tons per capita in 2011, or eight times the world average. Nevertheless, the national ‘COP21 Submission 2015’ mentions no overall emission reduction target. Add to this the nasty facts that Bahrain’s fossil fuel production 2012 (Btu) was 44% above the 2000-level¹ and renewable electricity production (Btu) 2012 amounted only 0.003% of the total energy consumption (Btu). Bahrain is categorized as “authoritarian” and ranks 146 among 160 countries in the ‘Democracy Index 2015‘ … and no data is available on income distribution (inequality) – no surprise.
Canada now ranks 10th in Climate Debt per capita (due to black transition)
Canada covers 7.3% of planet’s land area and populates 0.5% of its people. The Climate Debt of the 35 million Canadians amounts to $183 billion, or $5,138 per capita, which ‘Ranks’ Canada 10th among 148 countries. In 2010 the ranking was 7th. The following compares the Canadian performance with the ones of Australia, New Zealand, Sweden and Finland – all wealthy developed countries with small or relatively small population density¹.
Russia’s Climate Debt keeps accelerating (however, the Environmental Performance has improved)
The accumulated Russian per capita Climate Debt is ranked 25th among 148 countries. Back in 2010 the ranking was 33rd. The reckless development also shows in Russia’s share of the global Climate Debt: 3.9% by January 2016 compared to 3.0% in 2010. Rankings are available in the menu “Climate Debt”. The following examines the development of CO2 Emissions, Environmental Performance, GDP(ppp-$) and Climate Debt, in comparison with some of ‘Russia’s largest trading partners’.

Historic use of phrases such as Climate Change, Biodiversity, Renewable Energy, Fracking, etc. (Google Books Ngram Viewer)
2015
‘Ngram Viewer’ is a Google search service showing graphs of historic use of words and phrases in books published in the United States (until 2008). The diagram below shows the trend of the phrases: Climate Change, Biodiversity, Global Warming, Deforestation, Renewable Energy, Greenhouse Effect, Invasive Species and Fracking. The corpus search is in “English” (case-insensitive), between 1980 and 2008. Read the comments below the diagram.
Renewable energy and Climate Debt by country
2015
Between 2000 and 2012 the global consumption of ‘Primary Energy’ increased by 32%, the global CO2 Emissions from the burning of fossil fuels increased by 34% and the world’s population grew by 15%. These figures should be seen in the context of the historic increases of ‘atmospheric concentration of greenhouse gases’ and the resulting ‘temperature rise’. The heartbreakingly imprudent and brutal development is reflected in 82 countries’ current Climate Debt in ClimatePositions. Many countries wisely prioritize ‘renewable energy’, however, globally renewable energy¹ (electrically generated) was only 8.6% of the total primary energy production in 2012 compared to 7.4% in 2000.
The table below ranks the 82 countries with Climate Debt by:
- Climate Debt per capita in 2013 (worst performing first).
- CO2 Emissions from fossil fuels in tons per capita in 2012.
- Renewable energy production (electrically generated) as share of the total primary energy production in 2012.
- Increase of the share of renewable energy production from 2000 to 2012.