Norway: Per Capita Climate Debt $2,858 (Ranked 20) – Fossil CO2 Emissions
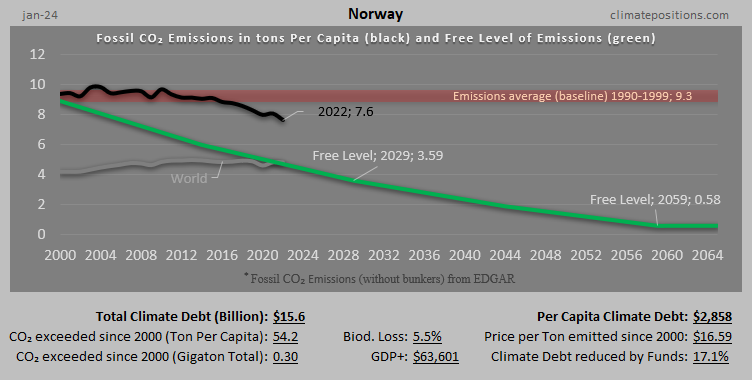
In 2024, Norway is responsible for 0.20% of the Global Climate Debt accumulated since 2000. Below are some key figures in the calculations.
Canada – per capita Fossil CO2 Emissions and Climate Debt
2020
Canada’s current Climate Breakdown Pricing amounts to $29.84 per tons Fossil CO2 emitted since 2000. The Climate Debt grew from $6,452 per capita in 2015 to $9,685 in 2020. Updated Rankings of 165 countries are available in the menu “Climate Debt”.
The following diagrams expose the trends of Fossil CO2 Emissions, Climate Debt, GDP(ppp-$), Nuclear Power and Ecological Footprint without carbon.
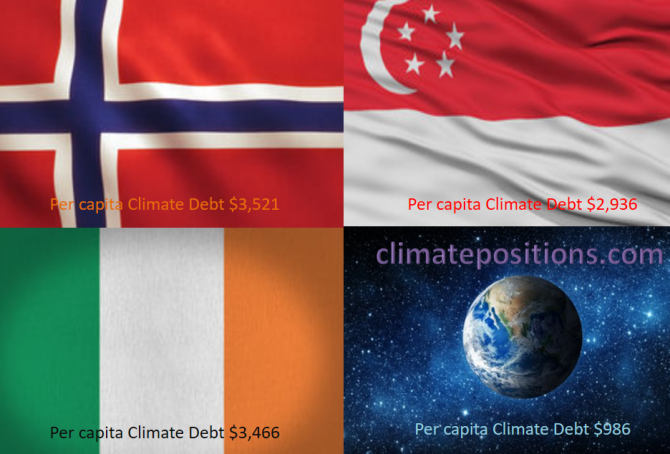
Share of global Climate Debt rank 37th, 38th and 39th: Norway, Ireland and Singapore (combined responsible for 0.71% of Climate Debt and 0.37% of Fossil CO2 Emissions 2016)
2017
The diagram below shows ‘Share of global Climate Debt‘ in 2010, 2015 and 2017 of Norway, Ireland and Singapore (ranked 37th, 38th and 39th). Norway’s share is decreasing, whereas Singapore’s is increasing. Ireland’s impressive decrease seems to have reversed lately.
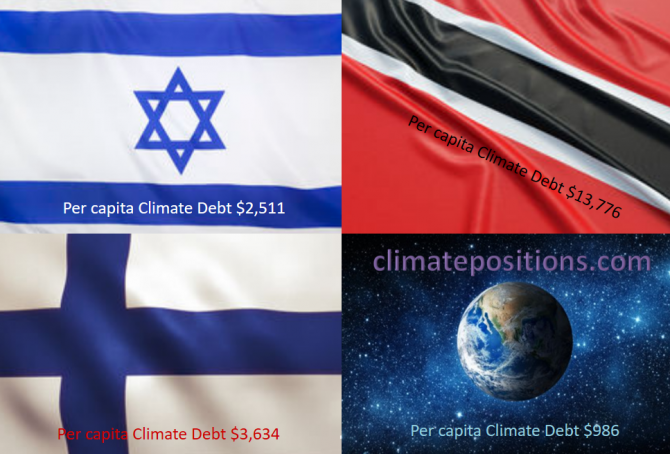
Share of global Climate Debt rank 34th, 35th and 36th: Israel, Finland and Trinidad and Tobago (combined responsible for 0.83% of Climate Debt and 0.42% of Fossil CO2 Emissions 2016)
2017
The diagram below shows ‘Share of global Climate Debt‘ in 2010, 2015 and 2017 of Israel, Finland and Trinidad and Tobago (ranked 34th, 35th and 36th). The shares of Israel and Finland have decreased continuously, whereas the one of Trinidad and Tobago is nearly stable.
Indicator updates: GDP-ppp 2016 and Climate Change Financing (now only Multilateral Funds)
2017
2016-updates of national per capita GDP(ppp-$) from ‘World Bank‘ is now available in ‘Calculation (Excel)‘. The world’s average per capita GDP(ppp-$) grew from $15,668 in 2015 to 16,136 in 2016 (3.0% growth). The diagram below shows the development in per capita GDP(ppp-$) 2000-2016 of the world’s five largest per capita emitters of CO2 from Fossil Fuel and cement: Qatar, Trinidad and Tobago, Kuwait, Bahrain and Brunei; in comparison with the world average.
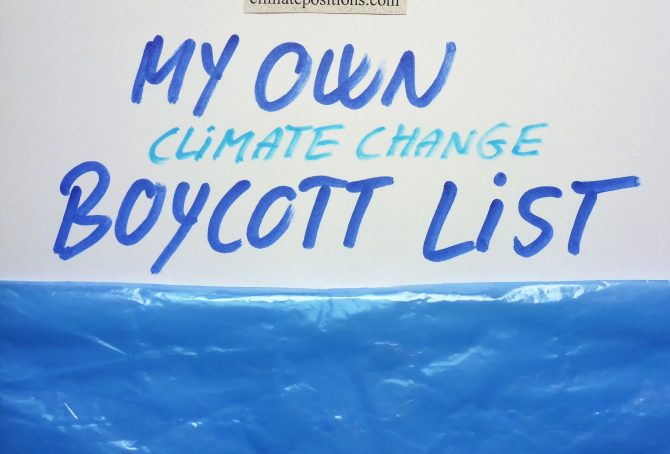
My own climate change boycott country-list
2017
Without been fanatical about it, I seek to boycott the greediest and most climate-destructive countries on the planet. For the fairness, I have divided the fifteen nominees into two leagues:
A) Countries with per capita Climate Debts more than 10 times world average: Qatar, Kuwait, Brunei, Luxembourg, Trinidad and Tobago, United Arab Emirates and Oman.
B) Countries with per capita Climate Debts between 5 and 10 times world average: Saudi Arabia, United States, Bahrain, Australia, Norway, Equatorial Guinea, Canada and South Korea.
Feel free to copy…
Among the fifteen countries only Luxembourg and South Korea are not among the world’s twenty largest per capita Fossil Fuel producers (read the article: ‘How green are the fossil fuel producers? (Correlation between fossil fuel production, CO2 Emissions, GDP and Climate Debt)‘.
The table below shows some key data of the fifteen countries. The table is read like this: 1) Between 1990 and 1999 Qatar emitted 55.1 tons of CO2 from Fossil Fuels (without bunker) and cement, annually per capita, 2) Between 2000 and 2015 Qatar emitted 51.7 tons (the average Climate Debt Free Level¹ was 32.4 tons), and 3) Qatars GDP(ppp) per capita was $143,788 in 2015.
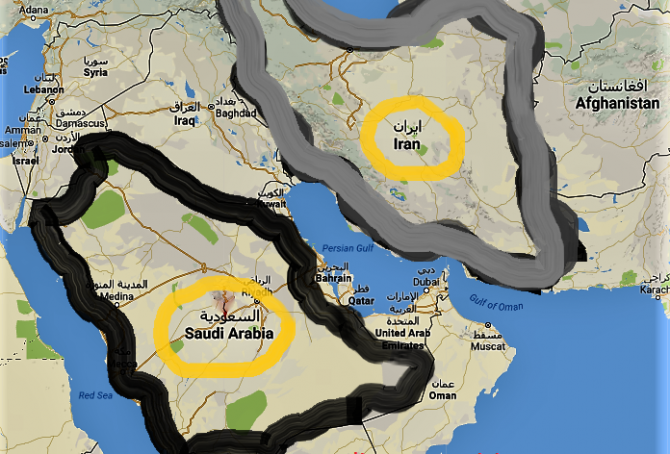
Climate change performance: Iran vs. Saudi Arabia (gas and oil)
2016
The large oil and gas producers Iran and Saudi Arabia are the world´s 7th and 8th largest emitters of CO2 from Fossil Fuels. The diagrams below show the per capita CO2 Emissions from Fossil Fuels (without bunkers) and cement, annually since 2000. The green bars show the Free Emission Level¹ – the exceedance is the basis for calculating the national Climate Debt. Iran and Saudi Arabia were responsible for 1.9% and 1.7% of global emissions in 2015.

Climate Debt: Norway ranks 9th (performance of top twenty from Human Development Index)
The so called ‘Human Development Index 2015’ (UN) ranks Norway 1st among 188 countries. The index is based on 1) Life expectancy at birth, 2) Expected years of schooling, 3) Mean years of schooling and 4) Gross national income (GNI) per capita. However, the wealthy Scandinavian oil state ‘Ranks‘ 9th among 148 countries on Climate Debt per capita. Norway is in other words a highly human developed demolisher of the climate, one might say! The following examines the climate performance of Norway in comparison with the other top five countries from Human Development Index: Australia, Switzerland, Denmark and Netherland.

How green are the fossil fuel producers? (Correlation between fossil fuel production, CO2 Emissions, GDP and Climate Debt)
2015
Greenhouse gas emissions from burning of fossil fuels (oil, natural gas and coal), is the main cause of manmade climate change. Comparable energy potentials of oil, natural gas and coal is defined as “tons oil equivalents”, meaning that the energy released from a given quantity of natural gas or coal is equivalent to one ton of oil. This way the total production of fossil fuels can be expressed in a single figure (not to be confused with market value, global warming potential or general usefulness) The world’s production in million tons oil equivalent, was in 2013: oil (4,130), natural gas (3,041 and coal (3,881).
The table below ranks the twenty countries with the largest per capita fossil fuel production (oil equivalents). Total production data of 68 countries is from ‘BPs Statistical Review of World Energy 2014’ (pdf, 48 pages).
Climate change performance of Norway (and the giant oil fund)
2015
Norway’s first oil field started production in 1971 and since 1996 petroleum revenue has been transferred to what’s now called the ‘Government Pension Fund Global’ – often referred to as Norway’s Oil Fund. Today, the fund’s market value is around $884 Billion. For comparison, the updated Norwegian Climate Contribution in ClimatePositions is $16.4 Billion and the climate financing¹ $1.5 Billion. Below are listed some perspectival per capita figures:
- The current market value of Norway’s Oil Fund is around $188,000 per capita (per Norwegian). In 2000 the market value was $11,000 per capita.
- The accumulated Climate Contribution in ClimatePositions is $3,490 per capita.
- The climate financing is $321 per capita (9% of the Climate Contribution which is world record; read this ‘article‘).
- The updated Climate Debt is $3,169 per capita which ranks Norway 15th in the world (see the ‘ranking’).
- The oil production per capita was 6th in the world in 2013, after Qatar, Kuwait, United Arab Emirates, Saudi Arabia and Equatorial Guinea – in 2000 Norway was 2nd. Norway’s oil production decreased by 46% between 2000 and 2013 … the world production increased by 17% during the same period.
- The natural gas production per capita was 4th in the world in 2012, after Qatar, Trinidad and Tobago and Brunei. Norway’s natural gas production increased by 106% between 2000 and 2012 … the world production increased by 37% during the same period.
The following examines Norway’s CO2 Emissions, Climate Debt over time, GDP(ppp-$) and the investment strategy of Norway’s Oil Fund.
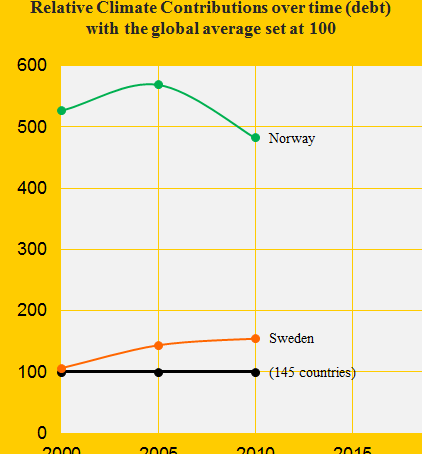
Sweden with Nuclear Power and Norway with oilfields
2014
In ClimatePositions 2010, Norway was the 14th worst performing country – Sweden was number 30. See the relative Contributions per capita over time in the diagram. Norway, with only 0.07% of the world’s population, produces 2.80% of the world’s oil (crude extracted from reserves). In 2011, Norway was the world’s 14th largest oil producer. The neighboring country Sweden has no oil production but has the world’s largest Nuclear Power generation per capita.
The following examines the indicators: CO2 Emissions, Ecological Footprint, GDP(ppp-$) and Nuclear Power.
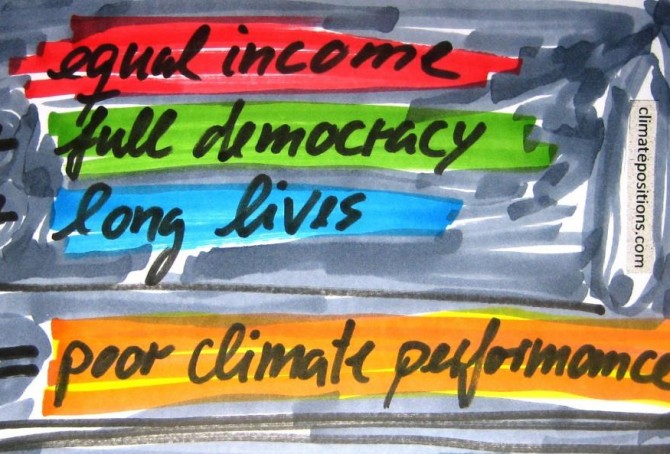
Income Equality, Life Expectancy, Democracy Index … and Climate Contributions
2014
123 out of 145 countries with full data in ClimatePositions are included in an inventory of Income Equality (see the source at the bottom), which shows how much the 10% poorest earns compared to the 10% richest. 53 out of the 123 countries are Contribution Free (no climate debt) in ClimatePositions 2010 and 70 countries are not.
The table below shows the difference between the two groups of countries in terms of Income Equality, Life Expectancy, number of Full Democracies and number of Authoritarian Regimes. To clarify the trend the 20 countries with the largest Climate Contributions appear at the top of the table. The 123 countries represent 95% of the world population.

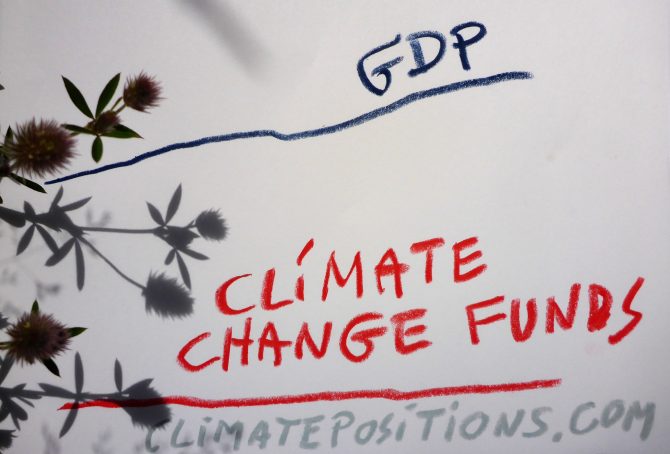
Updated climate change funding worldwide
2013
‘Climate Funds Update‘ is an independent website that provides information on international climate finance initiatives designed to help developing countries address the challenges of climate change. The site is a joint initiative of the ‘Heinrich Böll Stiftung‘ and the ‘Overseas Development Institute‘.
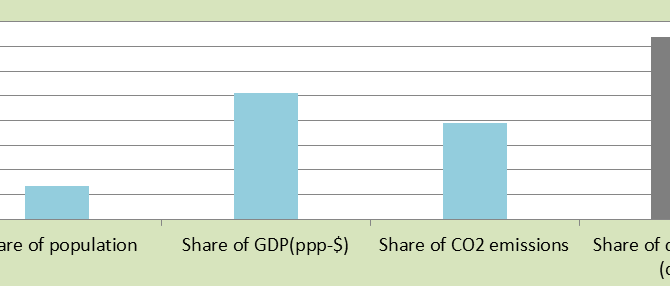
Full Democracies means large Climate Contributions (climate debt)
2013
The diagram shows 23 Full Democracy countries’ total share of the global: 1) Population (13%), 2) GDP(ppp-$) (51%), 3) CO2 Emissions (39%) and 4) Contributions (debt) (74%). Only 1/8 of the people on the planet live in other words in Full Democracies and they are accountable for 3/4 of the global Contributions (climate debt) in ClimatePositions 2010. Also the ecological footprint (excluding CO2 Emissions) of a majority of these 23 countries is very large, with an average of 2.7 EPI. Obviously democracies in general are still flawed when it comes to planet responsibility and climate change response. Costa Rica is the only Contribution Free country on the Full Democracy list (more about Costa Rica soon).