Singapore: Per Capita Climate Debt $6,565 (Ranked 11) – Fossil CO2 Emissions
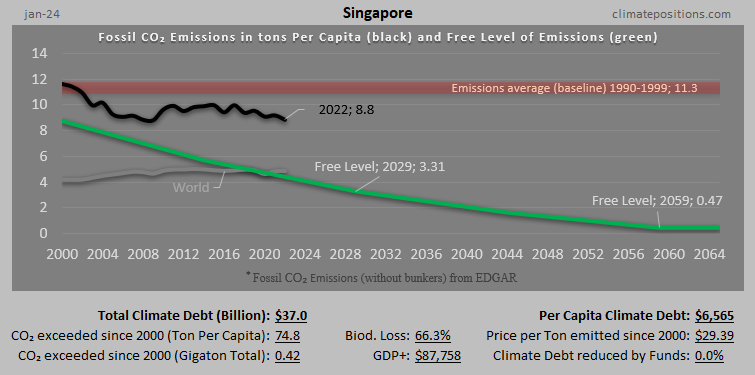
In 2024, Singapore is responsible for 0.47% of the Global Climate Debt accumulated since 2000. Below are some key figures in the calculations.

Malaysia – per capita Fossil CO2 Emissions and Climate Debt
2020
Malaysia’s current Climate Breakdown Pricing amounts to $20.82 per tons Fossil CO2 emitted since 2000. The Climate Debt grew from $1,454 per capita in 2015 to $2,902 in 2020. Updated Rankings of 165 countries are available in the menu “Climate Debt”.
The following diagrams expose the trends of Fossil CO2 Emissions, Climate Debt, GDP(ppp-$) and Ecological Footprint without carbon.

Indonesia – per capita Fossil CO2 Emissions and Climate Debt
2020
Indonesia’s current Climate Breakdown Pricing amounts to $4.50 per tons Fossil CO2 emitted since 2000. The Climate Debt grew from $82 per capita in 2015 to $147 in 2020. Updated Rankings of 165 countries are available in the menu “Climate Debt”.
The following diagrams expose the trends of Fossil CO2 Emissions, Climate Debt, GDP(ppp-$), Ecological Footprint without carbon, Forest Cover and Primary Forest.
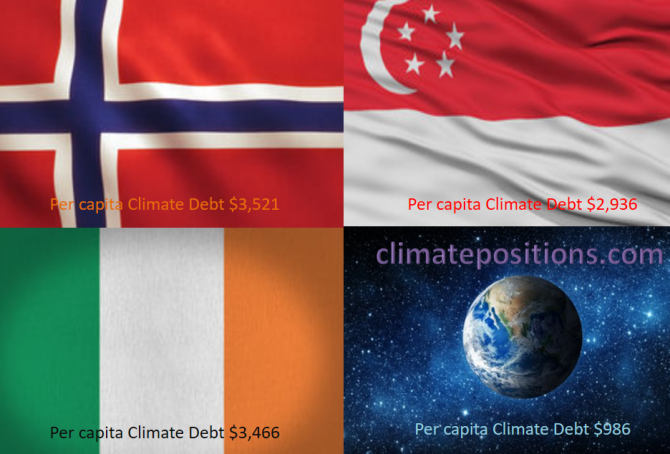
Share of global Climate Debt rank 37th, 38th and 39th: Norway, Ireland and Singapore (combined responsible for 0.71% of Climate Debt and 0.37% of Fossil CO2 Emissions 2016)
2017
The diagram below shows ‘Share of global Climate Debt‘ in 2010, 2015 and 2017 of Norway, Ireland and Singapore (ranked 37th, 38th and 39th). Norway’s share is decreasing, whereas Singapore’s is increasing. Ireland’s impressive decrease seems to have reversed lately.
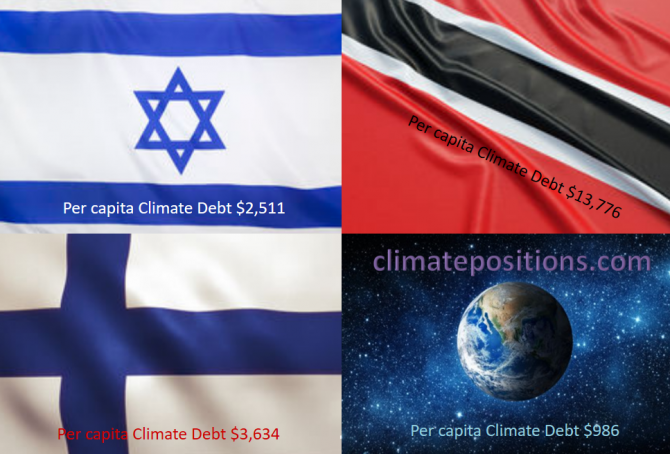
Share of global Climate Debt rank 34th, 35th and 36th: Israel, Finland and Trinidad and Tobago (combined responsible for 0.83% of Climate Debt and 0.42% of Fossil CO2 Emissions 2016)
2017
The diagram below shows ‘Share of global Climate Debt‘ in 2010, 2015 and 2017 of Israel, Finland and Trinidad and Tobago (ranked 34th, 35th and 36th). The shares of Israel and Finland have decreased continuously, whereas the one of Trinidad and Tobago is nearly stable.

Global Carbon Project (CDIAC), located in the United States, stops publishing carbon emissions data by country – will be replaced by EDGAR in ClimatePositions
2017
The Carbon Dioxide Information Analysis Center (CDIAC), located at the U.S. Department of Energy’s (DOE) Oak Ridge National Laboratory, has published annual Carbon Emissions from Fossil Fuels and cement production by country since 1959 (‘Global Carbon Project‘), but now this continuous time series has come to an end and 2015 will be the last data-year (as it seems).
Since carbon emissions data from CDIAC (Global Carbon Project) is the core ‘Indicator‘ in ClimatePositions’ calculation of Climate Debt, carbon emissions data will be replaced with nearly similar data from ‘EDGAR‘ (‘European Commission‘ / ‘Climate Action‘), retroactively since 1990, in connection with the coming updates [done 16-08-2017].
The following describes the differences between CO2 Emissions data from Global Carbon Project (CDIAC) and EDGAR (sourced: European Commission, Joint Research Centre (JRC)/Netherlands Environmental Assessment Agency (PBL). Emission Database for Global Atmospheric Research (EDGAR)), and the consequences in terms of Climate Debt in ClimatePositions – illustrated with a range of country examples. Note that other sources, such as ‘IEA‘, ‘EIA‘ and ‘BP‘, provides CO2 Emissions data-sets different from the ones of CDIAC and EDGAR.

Climate Debt: Norway ranks 9th (performance of top twenty from Human Development Index)
The so called ‘Human Development Index 2015’ (UN) ranks Norway 1st among 188 countries. The index is based on 1) Life expectancy at birth, 2) Expected years of schooling, 3) Mean years of schooling and 4) Gross national income (GNI) per capita. However, the wealthy Scandinavian oil state ‘Ranks‘ 9th among 148 countries on Climate Debt per capita. Norway is in other words a highly human developed demolisher of the climate, one might say! The following examines the climate performance of Norway in comparison with the other top five countries from Human Development Index: Australia, Switzerland, Denmark and Netherland.
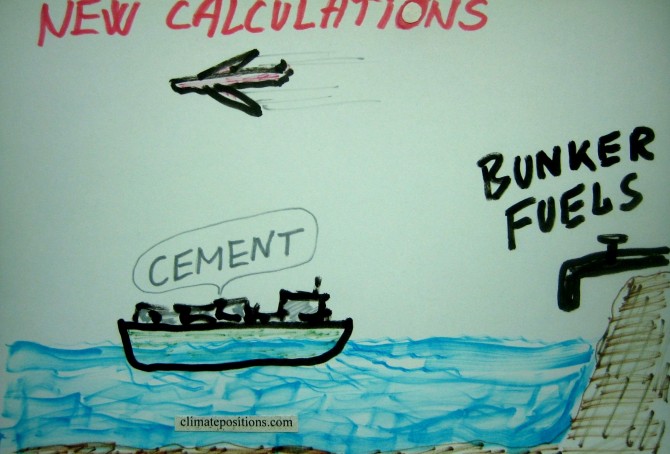
ClimatePositions: CO2 Emission-data now include cement production (and exclude bunker fuels)
So far, ‘EIA’ has been the source of national CO2 Emissions in ClimatePositions. EIA include emissions from burning of fossil fuel, including bunker fuels (fuels used for international aviation and maritime transport). Globally, bunker fuels account for about 3% of all fossil fuel CO2 Emissions.
By January 2016, the source of CO2 Emissions used in ClimatePositions switches to ‘Carbon Dioxide Information Analysis Center (CDIAC)’, or simply Global Carbon Project. CDIAC also include emissions from burning of fossil fuel, but exclude emissions from bunker fuels (fuels used for international aviation and maritime transport), and instead include ‘CO2 Emissions from cement production’. Emissions from cement production (and oxidation) amount to about 5% of all fossil fuel emissions, globally. The total annual national carbon emissions at the source are subsequently converted¹ to per capita CO2 Emissions for the use in ClimatePositions. Note that emissions 2012-2014 are preliminary estimates².
For comparison, the table below shows the national shares of the global Climate Debt, respectively, with CO2 Emission data from 1) Global Carbon Project (CDIAC) and 2) EIA. Countries with increased Climate Debt, relatively, due to the conversion of sources are marked in red. The global Climate Debt will only be slightly affected by the change (the global Climate Debt is 5.7 trillion by Januar 2016).
From today, Global Carbon Project will be used as source of CO2 Emissions in ClimatePositions. New rankings are available in the menu “Climate Debt”. More comments below the table.
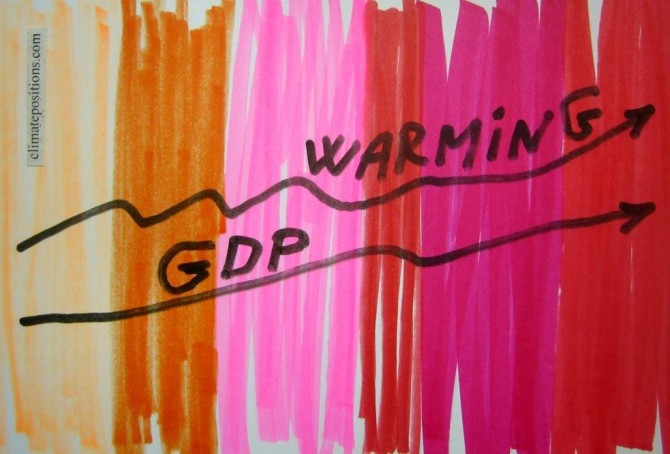
2014-updates of GDP(ppp-$) … rising along with the temperature
2015
The national Climate Debt in ClimatePositions increases with growing GDP(ppp-$)¹. 2014-updates of GDP from ‘World Bank’ are now available in ‘Calculation (Excel)’. The world’s average per capita GDP(ppp-$) grew from $14,417 in 2013 to $14,939 in 2014. The diagram below shows the development in GDP(ppp-$) in 2000-2014 of the world average and five of the world’s largest per capita fossil fuel CO2 Emitters (in 2012): Qatar (50.8 tons of CO2), United Arab Emirates (44.0 tons), Singapore (38.8 tons), Bahrain (25.8 tons) and Saudi Arabia (22.0 tons).

Top five in Climate Debt: Qatar, Kuwait, Singapore, United Arab Emirates and Trinidad and Tobago
2015
The updated Climate Debt per capita accumulated since 2000 of the five worst performing countries are:
- Qatar $35,565
- Kuwait $31,828
- Singapore $24,828
- United Arab Emirates $18,386
- Trinidad and Tobago $14,131
See the ‘ranking’ of 147 countries. The total population of the five small countries is 0.24% of the global population but the total Climate Debt is overwhelmingly 7.44% of the global Climate Debt (in 2012). The following analyses the indicators of GDP(ppp-$) and CO2 Emissions from fossil fuels (read about the issues of marine bunkers e.g. in Singapore at the bottom).

Pisa scores, CO2 Emissions and climate debt
2014
510,000 15-year old students from 65 countries were Pisa tested and ranked in Mathematics, Reading and Science in 2012. The following compares the average Pisa scores with 1) CO2 Emissions per capita and 2) Increase in Climate Contributions (climate debt) since 2010. The question is this: Do the countries which successfully emphasize “clever students” also emphasize climate responsibility and reductions in CO2 Emissions? Or may the student’s impressive skills be aimed at other national goals, such as economic growth?
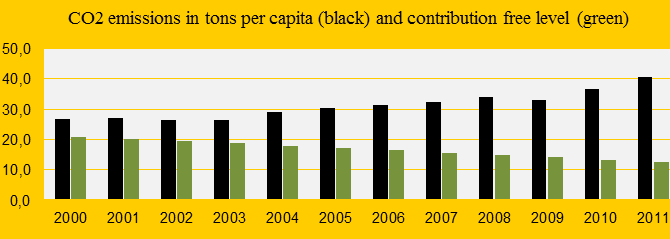
Is Singapore a climate change scoundrel?
2013
The island of Singapore was the 2nd worst performing country in ClimatePositions 2010 with a contribution (climate debt) of $9,924 per capita and there are no signs of improvement since. In the updated calculation the amount has increased to $12,364. The diagram shows the small hybrid regime’s outrageous annual CO2 Emissions (the green bars show the Contribution Free Level). Note that a large proportion of the emissions is due to marine bunkers.