
Climate performance of India, Pakistan and Bangladesh
2014
India, Pakistan and Bangladesh are all Contribution Free in ClimatePositions. With 23% of the world population, and 54% of the Contribution Free population, the three populous countries are natural candidates of climate change compensation. Bangladesh is considered one of the most vulnerable to climate change – where millions are expected to be displaced due to flooding. A Global Climate Fund could lead aid efforts, but this idea seems to be “stone dead” since the major of atmosphere-poisoning countries refuse to finance the damages they cause (see the country list in the menu “Contributions”). However, India has to be cautious of its own climate performance in the coming years.
Climate performance: Libya versus Chad
2014
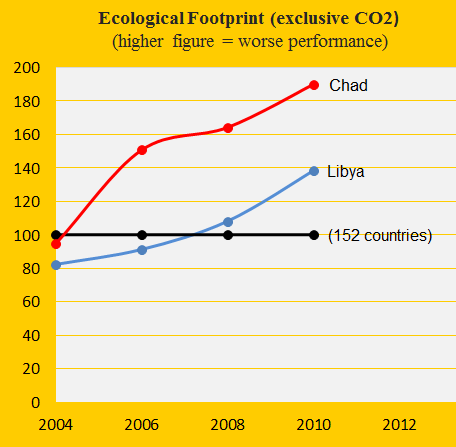
Libya was the 29th worst performing country out of 145 in ClimatePositions 2010 and thus the worst performing country in Africa (read more ‘here’). The authoritarian oil-regime’s Climate Contribution (climate debt) has increased to $819 per capita in the updated calculation. Chad is Contribution Free in spite of a surprisingly large Ecological Footprint (excluding CO2 Emissions) – see the diagram. The large footprint is partly due to large herds of commercial cattle, goats, sheep, horses and donkeys. The following examines the indicators: CO2 Emissions, GDP(ppp-$) and the Climate Contributions over time.
Sweden with Nuclear Power and Norway with oilfields
2014
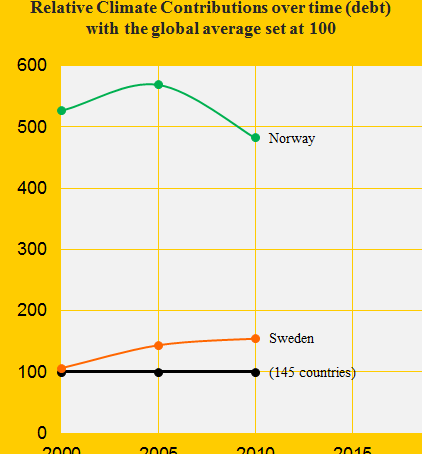
In ClimatePositions 2010, Norway was the 14th worst performing country – Sweden was number 30. See the relative Contributions per capita over time in the diagram. Norway, with only 0.07% of the world’s population, produces 2.80% of the world’s oil (crude extracted from reserves). In 2011, Norway was the world’s 14th largest oil producer. The neighboring country Sweden has no oil production but has the world’s largest Nuclear Power generation per capita.
The following examines the indicators: CO2 Emissions, Ecological Footprint, GDP(ppp-$) and Nuclear Power.
Indonesia fails on deforestation and CO2 Emissions
2013
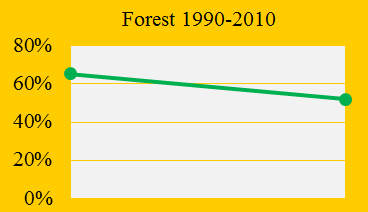
Indonesia was the 73rd worst performing country out of 145 in ClimatePositions 2010 with a total Climate Contribution (climate debt) of 5.6 billion US$. As shown in the front diagram Indonesia cut down the total forest cover (mainly rainforest) from 65.4% in 1990 to 52.1% in 2010. Had Indonesia maintained the forest cover since 1990, then the saving in Contribution would have been 4.6 billion US$. In the updated calculation the Contribution (debt) has increased to 6.5 billion US$.
Climate performance: Germany versus Poland
2013
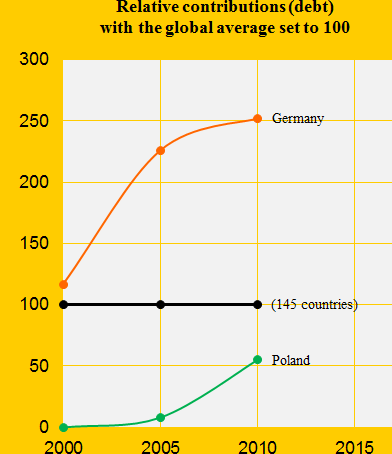
Germany was the 24th worst performing country out of 145 in ClimatePositions 2010 and Poland was the 46th. Five years earlier in 2005 the rankings were respectively 23th and 66th. The diagram shows the performance relatively with the global average set at 100. Germany has performed continuous irresponsible, though slightly less irresponsible in recent years and Poland seems to have given up all the good intentions around 2003. Below we highlight three of the national indicators in the calculations.

Putin’s Russia is deteriorating ecologically
2013
Russia was the world’s third largest CO2 Emitter (carbon dioxide) in 2006-2010 and the authoritarian regime was the 31st worst performing country in ClimatePositions 2010. In 2005 the ranking was 34th and in 2000 43rd. The negative development under Putin is unquestionable.
Climate performance: Canada versus United States
2013
North America’s 7% of the Global Population accounted for 47% of the global Climate Contributions (climate debt) in ClimatePositions 2010. Canada was the 8th worst performing country out of 145 and United States was the 7th. Most indicators on Canada and United States follow the same trends over time, some with slightly different levels, however.

Australia perform worst of democratic countries
2013
Australia was the 6th worst performing country in the world in ClimatePositions 2010 with a Climate Contribution of $4,387 per capita. In the latest calculation it had increased to $5,081. The total national Contribution (climate debt) is now 109 billion US$. Since no country in top 5 is Full Democracies, Australia is the worst performing democratic country. It can be assumed that the majority of the Australian voters are pleased with this destructive approach to the planet.
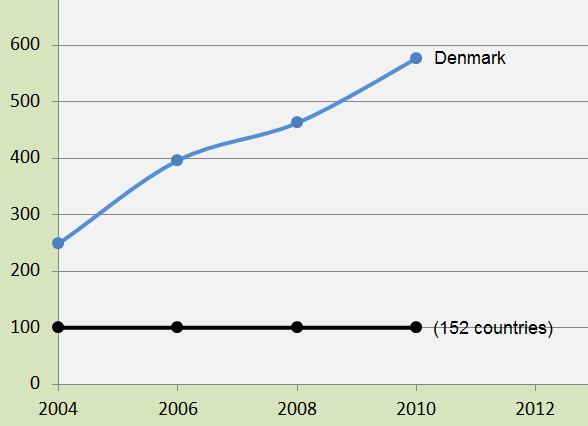
Denmark’s embarrassingly large Ecological Footprint
2013
Denmark did well according to ClimatePositions until 2002, where the Climate Contribution (climate debt) was $0, but under the liberal-conservative government 2001-2011 the performance deteriorated. Denmark was the 55th worst performing country out of 145 in 2005 and the 33rd in 2010.