
The Philippines beats Malaysia in climate change performance (what about the rainforests?)
2014
The Philippines is Contribution Free in ClimatePositions while Malaysia was the 36th worst performing country out of 145 in 2010. In 2014, the Malaysian Climate Contribution (climate debt) increased to $997 per capita and the present ranking is 31st (see ‘here’). The first diagram (below) illustrates the typical correlation between rapid economic growth and loss of sustainability that increases climate debt. The Malaysian climate debt, computed as a percentage of GDP(ppp-$) annually since 2000 increased from 0.38% in 2010 to 0.41% in 2014 (see the ranking ‘here’). This clearly demonstrates the lack of sustainable growth. The following examines the indicators of CO2 Emissions, Ecological Footprint, Forest Area and Marine Protection of the Philippines and Malaysia.

Climate change performance of Saudi Arabia and Yemen
2014
Saudi Arabia was the 12th worst performing country in ClimatePositions 2010 (see the ‘ranking’). In 2014 the total Climate Contribution (climate debt) of the rich authoritarian Islamic oil regime rose to $148 billion or 1.06% of the national GDP(ppp-$) annually since 2000 (ranked number 7; see ‘here’). The neighboring Yemen, the poor authoritarian Islamic regime is Contribution Free. The first diagram shows the development of GDP(ppp-$) of Saudi Arabia, Yemen, Oman, United Arab Emirates, Qatar and the world average. The following examines the indicators: CO2 Emissions, Ecological Footprint and Environmental Performance of Saudi Arabia and Yemen.
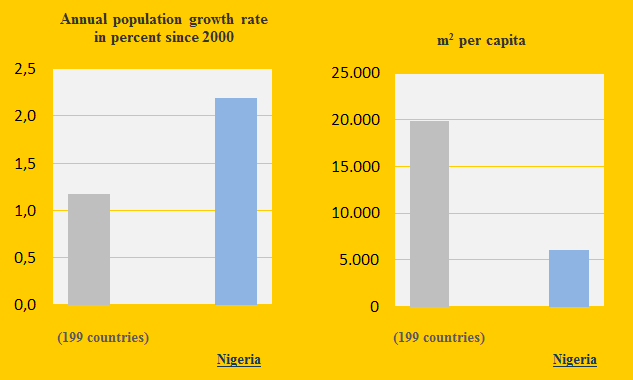
Climate performance of Nigeria and neighboring countries
2014
Nigeria and the neighboring countries Benin, Niger, Chad and Cameroon are Contribution Free in ClimatePositions. Nigeria is the world’s 8th most populous country and the annual population growth rate since 2000 is 2.2% or almost twice the world average (see the first diagram). The following examines the indicators of Forest, GDP(ppp), Environmental Performance, Ecological Footprint and CO2 Emissions (carbon dioxide).
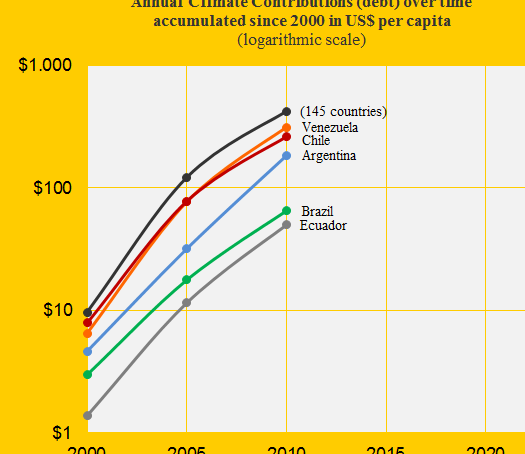
Venezuela loses big to Colombia in climate responsibility
2014
Colombia was Contribution Free in ClimatePositions 2010 and Venezuela was the 43rd worst performing country out of 145 (see the menu “Contributions”). The Venezuelan Climate Contribution (climate debt) was $313 per capita which was the 3rd largest in America after the extreme polluters United States and Canada. The diagram shows the Climate Contributions over time per capita of Venezuela, Chile, Argentina, Brazil, Ecuador and the world average (145 countries). In the updated calculation Venezuela’s Contribution has increased to $428 per capita (worsened two country rankings). The following examines Colombia’s and Venezuela’s CO2 Emissions, Ecological Footprint, Environmental Performance and forest cover.

Climate performance of India, Pakistan and Bangladesh
2014
India, Pakistan and Bangladesh are all Contribution Free in ClimatePositions. With 23% of the world population, and 54% of the Contribution Free population, the three populous countries are natural candidates of climate change compensation. Bangladesh is considered one of the most vulnerable to climate change – where millions are expected to be displaced due to flooding. A Global Climate Fund could lead aid efforts, but this idea seems to be “stone dead” since the major of atmosphere-poisoning countries refuse to finance the damages they cause (see the country list in the menu “Contributions”). However, India has to be cautious of its own climate performance in the coming years.
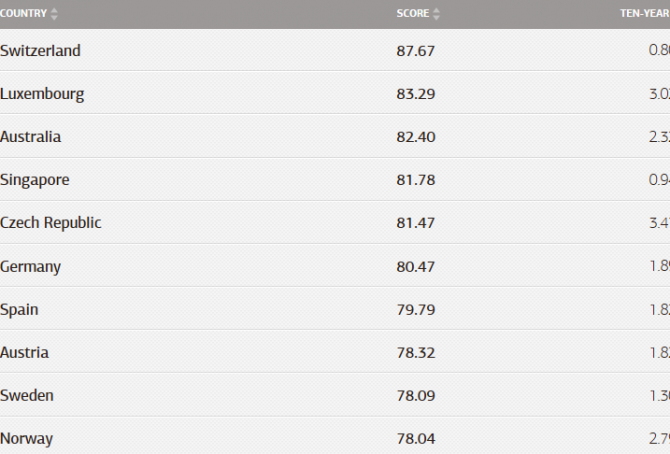
Environmental Performance Index 2014: Rankings of 178 countries
2014
Every second year Yale and Colombia Universities, in collaboration with the World Economic Forum, publish an Environmental Performance Index (EPI) with global rankings. The 2014 edition with rankings of 178 countries is now available ‘here’. The top ten countries are shown in the diagram. The Index ranks how well the countries perform on 1) Health Impacts (Air Quality, Water and Sanitation) and 2) Ecosystem Vitality (Water Resources, Agriculture, Forests, Fisheries, Biodiversity and Habitat, Climate and Energy). Underlying the nine issue categories are 20 indicators calculated from country-level data and statistics. Scores are converted to a scale of 0 to 100, with 0 being the worst observed value and 100 the best.
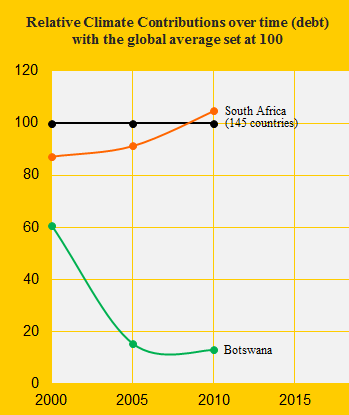
Climate performance: South Africa versus Botswana
2014
South Africa was the 38th worst performing country out of 145 in ClimatePositions 2010 while the neighboring Botswana was the 60th. The Climate Contributions (climate debt) were respectively $448 and $69 per capita (with the latest updates the amounts have increased to $592 and $84 per capita). See the relative Contributions in 2000, 2005 and 2010 in the diagram with the global average set at 100. Below we highlight some of the national indicators in the calculations.
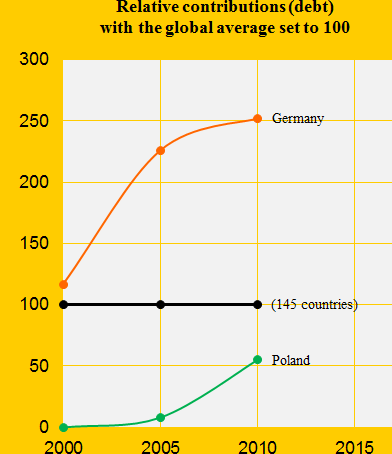
Climate performance: Germany versus Poland
2013
Germany was the 24th worst performing country out of 145 in ClimatePositions 2010 and Poland was the 46th. Five years earlier in 2005 the rankings were respectively 23th and 66th. The diagram shows the performance relatively with the global average set at 100. Germany has performed continuous irresponsible, though slightly less irresponsible in recent years and Poland seems to have given up all the good intentions around 2003. Below we highlight three of the national indicators in the calculations.

Putin’s Russia is deteriorating ecologically
2013
Russia was the world’s third largest CO2 Emitter (carbon dioxide) in 2006-2010 and the authoritarian regime was the 31st worst performing country in ClimatePositions 2010. In 2005 the ranking was 34th and in 2000 43rd. The negative development under Putin is unquestionable.

Australia perform worst of democratic countries
2013
Australia was the 6th worst performing country in the world in ClimatePositions 2010 with a Climate Contribution of $4,387 per capita. In the latest calculation it had increased to $5,081. The total national Contribution (climate debt) is now 109 billion US$. Since no country in top 5 is Full Democracies, Australia is the worst performing democratic country. It can be assumed that the majority of the Australian voters are pleased with this destructive approach to the planet.

Impressive performance by Costa Rica
2013
In 2010 ‘Costa Rica‘ was the only Contribution Free, full democratic country with a GDP(ppp-$) above the global average. The diagram above shows the national CO2 Emissions per capita (the black bars) and the Contribution Free Levels of CO2 Emissions (the green bars) in 2000-2011. Note that Costa Rica could have increased CO2 Emissions (carbon dioxide) from 1.2 ton CO2 per capita in 2000 to 1.9 tons in 2011 and still be Contribution free, due to other fine indicator values.
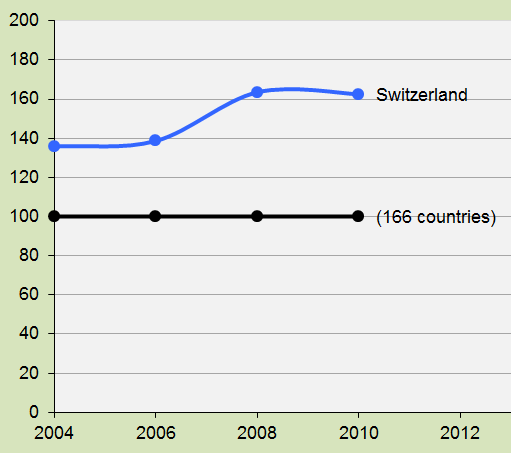
Switzerland benefits from a top Environmental Performance
2013
Switzerland was the 32nd worst performing country in ClimatePositions 2010 (see the menu Contributions/Per Capita US$ Rank), but the Environmental Performance was the best of all surveyed countries. The diagram illustrates Switzerlands Environmental Performance 2004-2010, in comparison with the global average set at 100 (166 countries are included).