
United States – per capita Fossil CO2 Emissions and Climate Debt
2020
The current Climate Breakdown Pricing of the United States amounts to $30.82 per tons Fossil CO2 emitted since 2000. The Climate Debt grew from $5,497 per capita in 2015 to $10,718 in 2020. Updated Rankings of 165 countries are available in the menu “Climate Debt”.
The following diagrams expose the trends of Fossil CO2 Emissions, Climate Debt, GDP(ppp-$) and Nuclear Power.
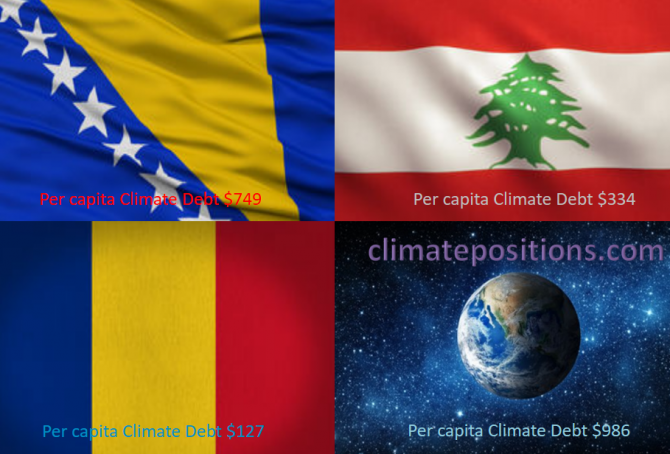
Share of global Climate Debt rank 64th, 65th and 66th: Bosnia and Herzegovina, Romania and Lebanon (combined responsible for 0.10% of Climate Debt and 0.35% of Fossil CO2 Emissions 2016)
2018
The diagram below shows ‘Share of global Climate Debt‘ in 2010, 2015 and 2017 of Bosnia and Herzegovina, Romania and Lebanon (ranked 64th, 65th and 66th). The shares of Romania and Lebanon are ups and downs, while the share of Bosnia and Herzegovina is steadier.
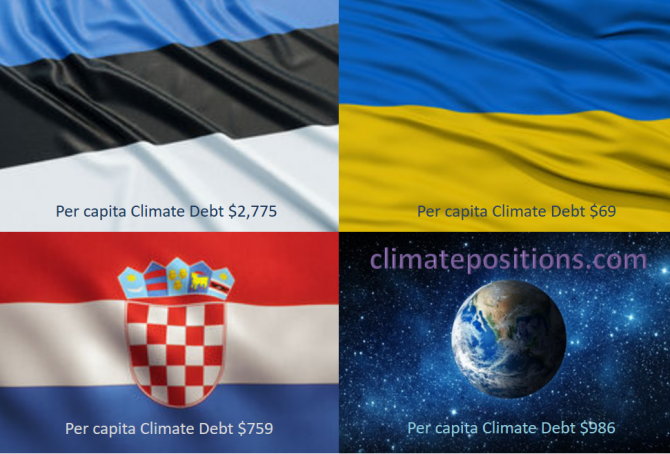
Share of global Climate Debt rank 61st, 62nd and 63rd: Estonia, Croatia and Ukraine (combined responsible for 0.14% of Climate Debt and 0.77% of Fossil CO2 Emissions 2016)
2018
The diagram below shows ‘Share of global Climate Debt‘ in 2010, 2015 and 2017 of Estonia, Croatia and Ukraine (ranked 61st, 62nd and 63rd). The shares of Estonia and Ukraine are increasing, whereas the share of Croatia is decreasing.
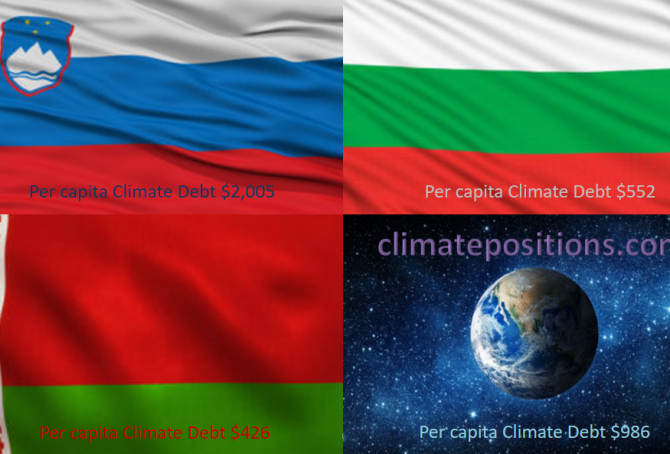
Share of global Climate Debt rank 58th, 59th and 60th: Slovenia, Belarus and Bulgaria (combined responsible for 0.17% of Climate Debt and 0.36% of Fossil CO2 Emissions 2016)
2018
The diagram below shows ‘Share of global Climate Debt‘ in 2010, 2015 and 2017 of Slovenia, Belarus and Bulgaria (ranked 58th, 59th and 60th). The share of Slovenia is decreasing, whereas the shares of Belarus and Bulgaria are increasing rather fast (Belarus had no Climate Debt in 2010).

Share of global Climate Debt rank 55th, 56th and 57th: Hungary, Slovakia and Serbia (combined responsible for 0.20% of Climate Debt and 0.41% of Fossil CO2 Emissions 2016)
2018
The diagram below shows ‘Share of global Climate Debt‘ in 2010, 2015 and 2017 of Hungary, Slovakia and Serbia (ranked 55th, 56th and 57th). The share of Serbia is decreasing, while the shares of Hungary and Slovakia are up and down.
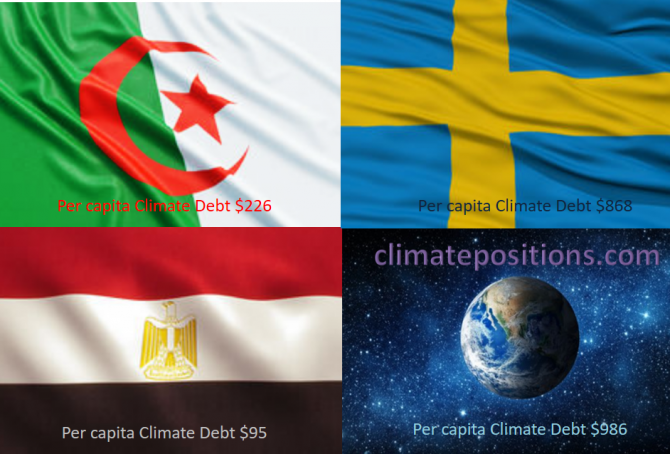
Share of global Climate Debt rank 46th, 47th and 48th: Algeria, Egypt and Sweden (combined responsible for 0.37% of Climate Debt and 1.18% of Fossil CO2 Emissions 2016)
2017
The diagram below shows ‘Share of global Climate Debt‘ in 2010, 2015 and 2017 of Algeria, Egypt and Sweden (ranked 46th, 47th and 48th). The Algerian share has increased continuously, whereas the Egyptian and the Swedish shares appear to have peaked around 2015.
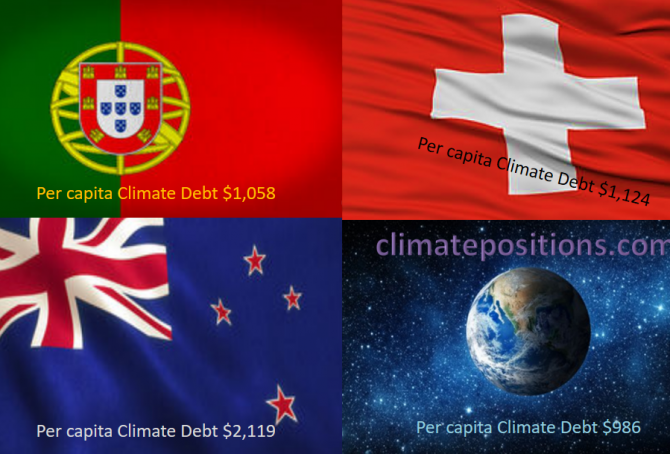
Share of global Climate Debt rank 43rd, 44th and 45th: Portugal, New Zealand and Switzerland (combined responsible for 0.42% of Climate Debt and 0.34% of Fossil CO2 Emissions 2016)
2017
The diagram below shows ‘Share of global Climate Debt‘ in 2010, 2015 and 2017 of Portugal, New Zealand and Switzerland (ranked 43rd, 44th and 45th). The shares of Portugal and New Zealand are decreasing, whereas the Swiss share is stable.
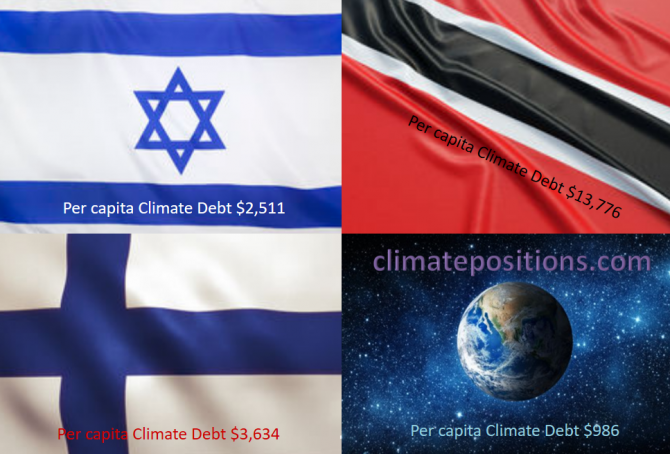
Share of global Climate Debt rank 34th, 35th and 36th: Israel, Finland and Trinidad and Tobago (combined responsible for 0.83% of Climate Debt and 0.42% of Fossil CO2 Emissions 2016)
2017
The diagram below shows ‘Share of global Climate Debt‘ in 2010, 2015 and 2017 of Israel, Finland and Trinidad and Tobago (ranked 34th, 35th and 36th). The shares of Israel and Finland have decreased continuously, whereas the one of Trinidad and Tobago is nearly stable.
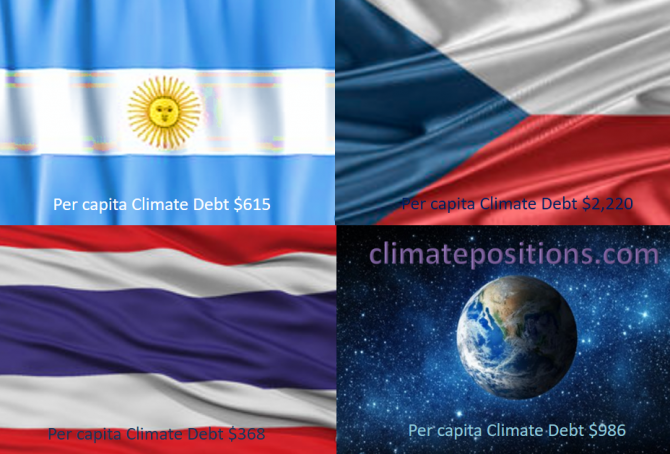
Share of global Climate Debt rank 31st, 32nd and 33rd: Argentina, Thailand and Czech Republic (combined responsible for 1.0% of Climate Debt and 1.6% of Fossil CO2 Emissions 2016)
2017
The diagram below shows ‘Share of global Climate Debt‘ in 2010, 2015 and 2017 of Argentina, Thailand and Czech Republic (ranked 31st, 32nd and 33rd). The share of Argentina is increasing while the share of Thailand has flattened out.
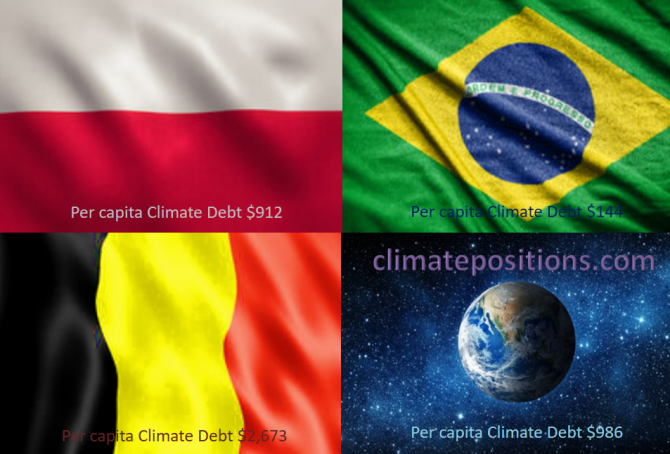
Share of global Climate Debt rank 25th, 26th and 27th: Poland, Belgium and Brazil (combined responsible for 1.3% of Climate Debt and 2.4% of Fossil CO2 Emissions 2016)
2017
The diagram below shows ‘Share of global Climate Debt‘ in 2010, 2015 and 2017 of Poland, Belgium and Brazil (ranked 25th, 26th and 27th). By 2015, the shares of the three countries were similar. Since then, the Polish performance has declined, relatively.
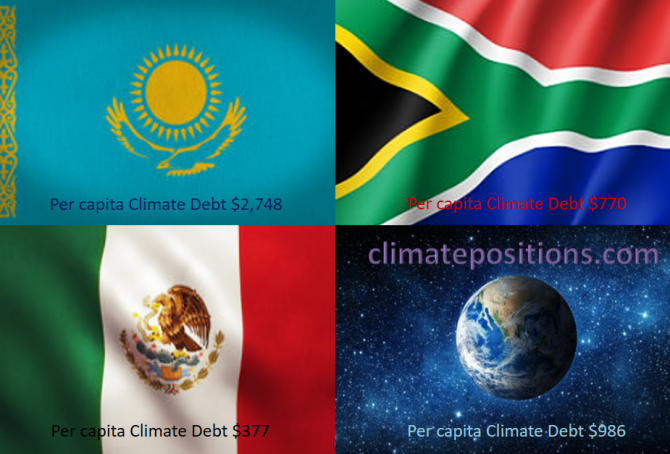
Share of global Climate Debt rank 22nd, 23rd and 24th: Kazakhstan, Mexico and South Africa (combined responsible for 1.9% of Climate Debt and 3.0% of Fossil CO2 Emissions 2016)
2017
The diagram below shows ‘Share of global Climate Debt‘ in 2010, 2015 and 2017 of Kazakhstan, Mexico and South Africa (ranked 22nd, 23rd and 24th). Kazakhstan’s share increased dramatically in a short period of time due to growing Fossil CO2 Emissions.
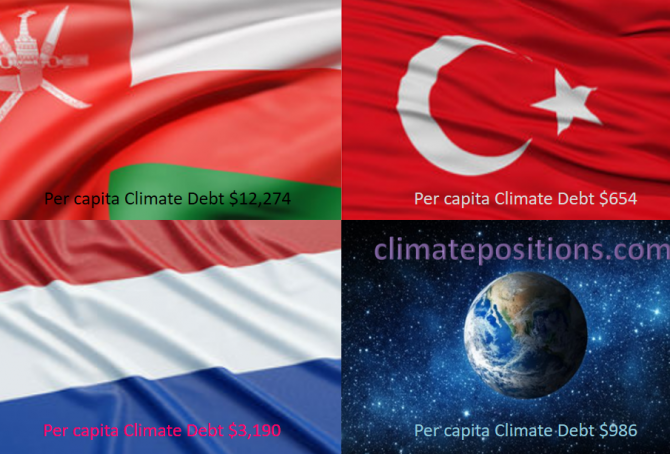
Share of global Climate Debt rank 19th, 20th and 21st: Oman, Netherlands and Turkey (combined responsible for 2.2% of Climate Debt and 1.7% of Fossil CO2 Emissions 2016)
2017
The diagram below shows ‘Share of global Climate Debt‘ in 2010, 2015 and 2017 of Oman, Netherlands and Turkey (ranked 19th, 20th and 21st). The share Netherlands is decreasing steadily, whereas Turkey’s is increasing.
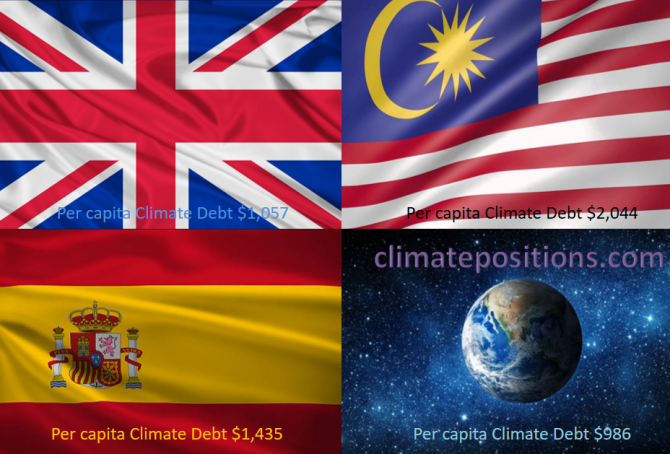
Share of global Climate Debt rank 16th, 17th and 18th: The United Kingdom, Spain and Malaysia (combined responsible for 2.8% of Climate Debt and 2.5% of Fossil CO2 Emissions 2016)
2017
The diagram below shows ‘Share of global Climate Debt‘ in 2010, 2015 and 2017 of the United Kingdom, Spain and Malaysia (ranked 16th, 17th and 18th). The shares of the United Kingdom and Spain are decreasing, while the Malaysian share is increasing.
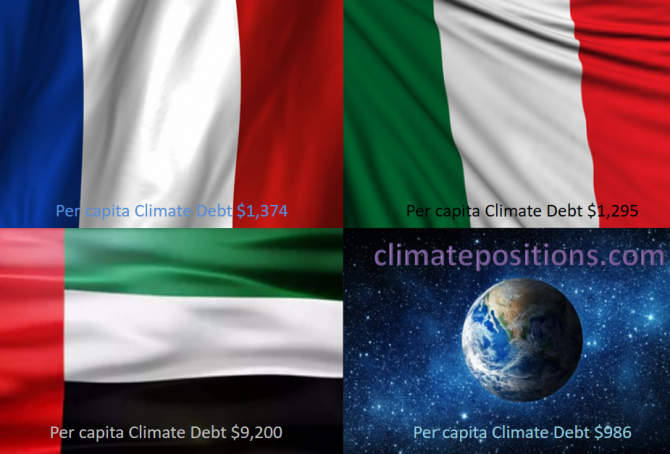
Share of global Climate Debt rank 13th, 14th and 15th: France, United Arab Emirates and Italy (combined responsible for 3.5% of Climate Debt and 2.5% of Fossil CO2 Emissions 2016)
2017
The diagram below shows ‘Share of global Climate Debt‘ in 2010, 2015 and 2017 of France, United Arab Emirates and Italy (ranked 13th, 14th and 15th). The share of United Arab Emirates has increased along with an extreme population growth.
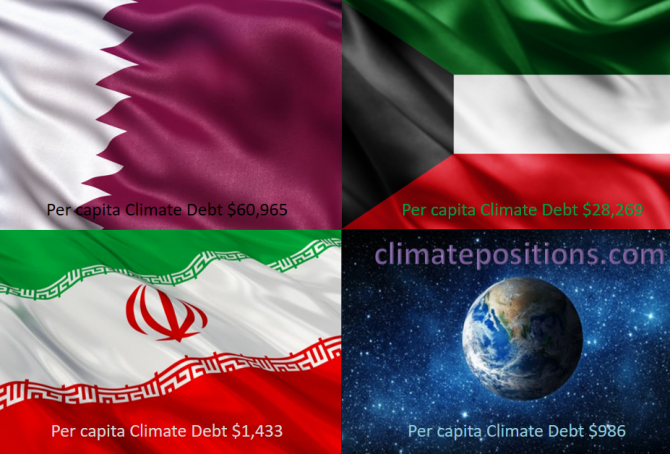
Share of global Climate Debt rank 10th, 11th and 12th: Qatar, Iran and Kuwait (combined responsible for 5.4% of Climate Debt and 2.4% of Fossil CO2 Emissions 2016)
2017
The diagram below shows ‘Share of global Climate Debt‘ in 2010, 2015 and 2017 of Qatar, Iran and Kuwait (ranked 10th, 11th and 12th). The share of Qatar has increased fast along with the extreme population growth. All three countries seem to have peaked on global shares around 2015.
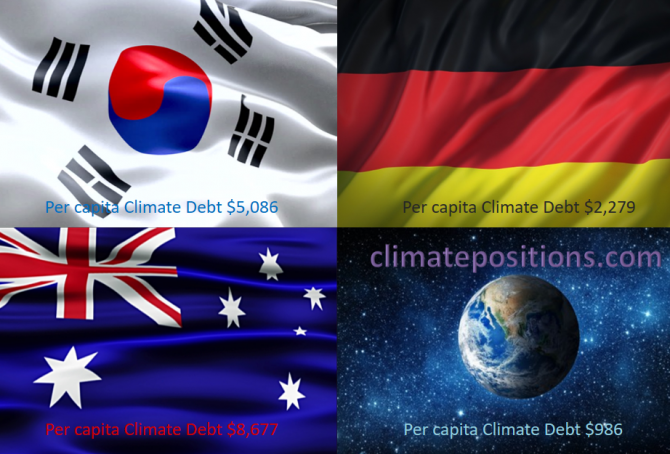
Share of global Climate Debt rank 7th, 8th and 9th: South Korea, Australia and Germany (combined responsible for 9% of Climate Debt and 5% of Fossil CO2 Emissions 2016)
2017
The diagram below shows ‘Share of global Climate Debt‘ in 2010, 2015 and 2017 of South Korea, Australia and Germany (ranked 7th, 8th and 9th). The South Korean share is stable over time, Australia’s is decreasing although at a slower rate lately, while Germany’s is increasing.
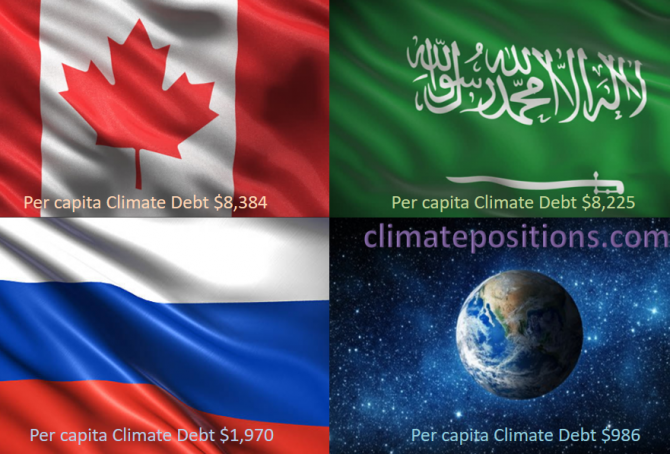
Share of global Climate Debt rank 4th, 5th and 6th: Canada, Russia and Saudi Arabia (combined responsible for 12% of Climate Debt and 8% of Fossil CO2 Emissions 2016)
2017
The diagram below shows ‘Share of global Climate Debt‘ in 2010, 2015 and 2017 of Canada, Russia and Saudi Arabia (ranked 4th, 5th and 6th). Canada’s share is decreasing, while Russia’s and Saudi Arabia’s are increasing. Global Climate Debt accumulated since 2000 is $7.2 Trillion.
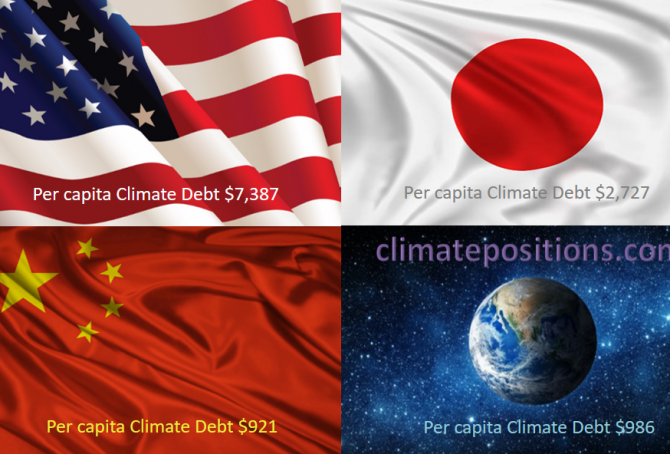
Share of global Climate Debt rank 1st, 2nd and 3rd: The United States, China and Japan (combined responsible for 55% of Climate Debt and 47% of Fossil CO2 Emissions 2016)
2017
The diagram below shows ‘Share of global Climate Debt‘ in 2010, 2015 and 2017 of the United States, Japan and China (ranked 1st, 2nd and 3rd). The shares of the United States and Japan are decreasing at slower rates lately, whereas China’s is increasing fast. Global Climate Debt accumulated since 2000 is $7.2 Trillion.

Indicator update: Nuclear Power 2016
2017
In ClimatePositions Nuclear Power generation is not accepted as a national CO2 Emission reduction instrument and the generation must be phased out parallel to CO2 Emissions from Fossil Fuels and cement production¹.
The table below shows the Nuclear Power generation in billion kWh in 2014, 2015 and 2016, of all 32 countries and the world. The global generation 2016 was 2% higher than in 2015. However, the increase was caused sole by China’s 49% increase.
Climate change performance: Egypt vs. Ukraine
Egypt and Ukraine are the world’s 25th and 26th largest emitters of CO2 from Fossil Fuels and cement. Combined, the two countries were responsible for 1.2% of global CO2 Emissions in 2015. The following examines the ‘Indicators‘ of CO2 Emissions, GDP(ppp-$), Ecological Footprint and the Ukrainian Nuclear Power.
The diagrams below show the per capita CO2 Emissions from Fossil Fuel (without bunkers) and cement, since 2000. The green bars show the Free Emission Level¹ – the exceedance is the basis for calculating the national Climate Debt.