
Global Carbon Project (CDIAC), located in the United States, stops publishing carbon emissions data by country – will be replaced by EDGAR in ClimatePositions
2017
The Carbon Dioxide Information Analysis Center (CDIAC), located at the U.S. Department of Energy’s (DOE) Oak Ridge National Laboratory, has published annual Carbon Emissions from Fossil Fuels and cement production by country since 1959 (‘Global Carbon Project‘), but now this continuous time series has come to an end and 2015 will be the last data-year (as it seems).
Since carbon emissions data from CDIAC (Global Carbon Project) is the core ‘Indicator‘ in ClimatePositions’ calculation of Climate Debt, carbon emissions data will be replaced with nearly similar data from ‘EDGAR‘ (‘European Commission‘ / ‘Climate Action‘), retroactively since 1990, in connection with the coming updates [done 16-08-2017].
The following describes the differences between CO2 Emissions data from Global Carbon Project (CDIAC) and EDGAR (sourced: European Commission, Joint Research Centre (JRC)/Netherlands Environmental Assessment Agency (PBL). Emission Database for Global Atmospheric Research (EDGAR)), and the consequences in terms of Climate Debt in ClimatePositions – illustrated with a range of country examples. Note that other sources, such as ‘IEA‘, ‘EIA‘ and ‘BP‘, provides CO2 Emissions data-sets different from the ones of CDIAC and EDGAR.
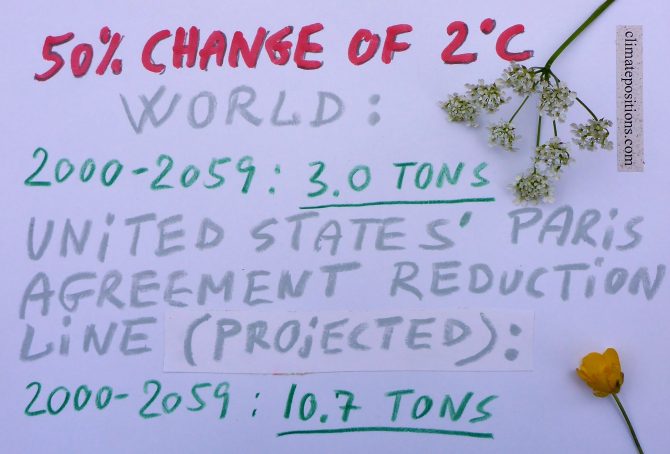
World CO2 Emissions 2000-2059: with 50% risk of 2C global warming (two per capita emission-scenarios for the United States, Denmark, Spain, China, India and Nigeria)
2017
In continuation of the previous article ‘Carbon Brief: Global Carbon Budget and CO2 Emission scenarios (50% risk of 1.5°C, 2.0°C and 3.0°C warming)‘, the following examines the per capita CO2 Emission budget 2000-2059, with a 50% risk of 2°C global warming (which of course is unacceptable). The outcome is then compared with Climate Debt Free CO2 Emission levels (in ClimatePositions) of the United States, Denmark, Spain, China, India and Nigeria, during the same 60-year period. Also, the Paris Agreements reduction commitment of the United States is put into perspective.

Climate change performance: Malaysia vs. Spain
2017
Malaysia and Spain are the world’s 23rd and 24th largest emitters of CO2 from Fossil Fuels and cement. Combined, the two countries were responsible for 1.4% of world CO2 Emissions in 2015. The following examines the ‘Indicators‘ of CO2 Emissions, GDP(ppp-$), Forest Cover (and Primary Forest) and Environmental Performance.
The diagrams below show the per capita CO2 Emissions from Fossil Fuel (without bunkers) and cement, since 2000. The green bars show the Free Emission Level¹ – the exceedance is the basis for calculating the national Climate Debt. The Spanish reductions are pretty much balanced by the Malaysian increases … which is world symptomatic.
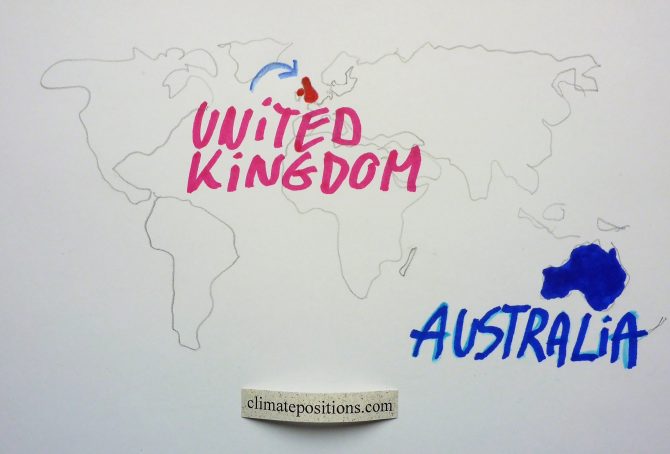
Climate change performance: The United Kingdom vs. Australia
2017
The United Kingdom and Australia and are the world’s 15th and 16th largest emitters of CO2 from Fossil Fuels and cement. Combined, the two countries were responsible for 2.2% of world CO2 Emissions in 2015. The following examines the ‘Indicators’ of CO2 Emissions, GDP(ppp-$) and Ecological Footprint (without carbon footprint).
The diagrams below show the per capita CO2 Emissions from Fossil Fuel (without bunkers) and cement, since 2000. The green bars show the Free Emission Level¹ – the exceedance is the basis for calculating the national Climate Debt.

Climate change performance: South Korea vs. Indonesia (peatlands in Southeast Asia)
2017
In 2015 South Korea and Indonesia accounted for 3.60% and 0.51% of the global Climate Debt, respectively (see the ‘Ranking‘). The following examines the ‘Indicators‘ of CO2 Emissions, GDP(ppp-$), Forest Cover (and peatlands) and Primary Forest.
The first two diagrams show the per capita CO2 Emissions from Fossil Fuel (without bunkers) and cement, annually since 2000, of South Korea and Indonesia. The green bars show the Free Emission Level¹ – the exceedance is the basis for calculating the national Climate Debt. The world’s 9th and 10th largest CO2-emitters were responsible for 1.7% (South Korea) and 1.5% (Indonesia) of global emissions in 2015, respectively. South Korea’s per capita emissions were 11.7 tons in 2015 (preliminary), while Indonesia’s were 2.1 tons (preliminary), which was 2.2% above the 2014-level.
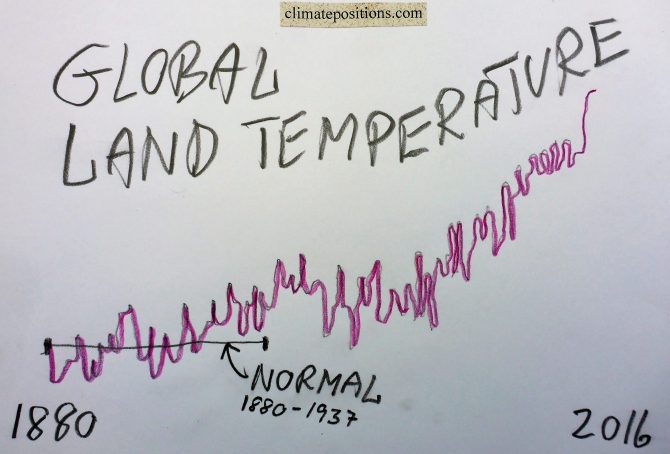
Global Indicator Update: Land Temperature 2016 (warmest year on record)
2017
The year 2016 was by far the hottest on planet Earth since measurements began in 1880. Both global Land (air) Temperature and Ocean (air) Temperature were the hottest on record. See the development in Land Temperature between 1960 and 2016 in the diagram below. The average temperature rise 1880-1937 is set at 0°C (baseline 1880-1937) and 2016 was 1.73°C warmer. The development since 1880 in Land Temperature and Ocean Temperature (and the two combined) are available at ‘ncdc.noaa.gov‘.
Added 22-01-17: The Ocean Temperature 2016 was 0.94°C warmer compared to baseline 1880-1937, and Land and Ocean Temperature combined was 1.15°C warmer. Note that other sources may refer to baseline 1881-1910 or even 1951-1980.
Added 07-02-2017: Soon, the global temperature ‘Indicator’ in ClimatePosition will be changed from Land (air) Temperature (10-years average) to Land/Ocean (air) Temperature (10-years average). The change will not affect the current accumulated Climate Debt of any country, only the future calculation.

Climate change performance: China vs. the United States (wealth inequality)
2016
The diagrams below show the per capita CO2 Emissions from Fossil Fuel (without bunkers) and cement, annually since 2000, of China and the United States. The green bars show the Free Emission Level¹ – the exceedance is the basis for calculating the national Climate Debt. The world’s two largest CO2-emitters were responsible for 29% (China) and 15% of global emissions in 2015.
Apparently, China’s per capita emissions have peaked, while the moderate reduction-rate 2006-2012 of the United States, has flattened out.

Final Update 2015: new rankings of 159 countries’ Climate Debt, accumulated since 2000
2016
Every five year, since 2005, Final Updates of national Climate Debts are completed in ClimatePositions and 2015-updates¹ are now available in ‘Calculation (Excel)‘. New rankings in six categories, of 159 countries, are available in the menu “Climate Debt”. In the coming months, the climate change performances of selected countries will be analyzed in articles, starting with the United States and China.
The following illustrate Final Update 2015 in two ways: 1) The change of Climate Debt as percentage of the global Climate Debt, annually since 2000, of the 10 largest CO2 emitters, and 2) Key-figures of the United States.
The table below of the 10 largest CO2 emitters (representing 70% of the global emissions in 2015) shows the national shares of the global Climate Debt in 2015 and 2010. China, Russia and Saudi Arabia stand out with extremely harmful developments, while the United States still has by far the largest Climate Debt. See the latest ‘Ranking’ of 159 countries.
Update: GDP(ppp-$) 2015
2016
2015-updates of national per capita GDP(ppp-$) from ‘World Bank’ is now available in ‘Calculation (Excel)’. The world’s average per capita GDP(ppp-$) grew from $15,065 in 2014 to $15,470 in 2015 (2.7% growth). In the midst of an unprecedented man-made climate catastrophe and the ‘Sixth mass extinction’ in progress, the human economy keeps growing.
The diagram below shows the development in per capita GDP(ppp-$) 2000-2015 of the world’s five largest emitters of CO2 from Fossil Fuel and cement: China (27.0% of the global emissions), the United States (14.7%), India (7.2%), Russia (4.9%) and Japan (3.4%), in comparison with the world’s average.
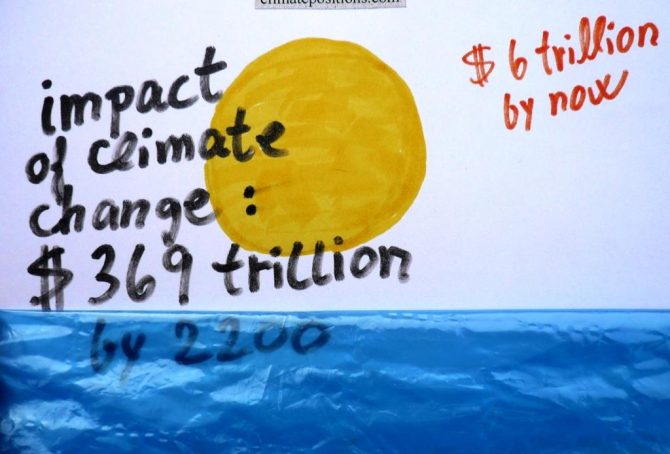
Predicted impact of climate change: $369 trillion by 2200 (study)
2016
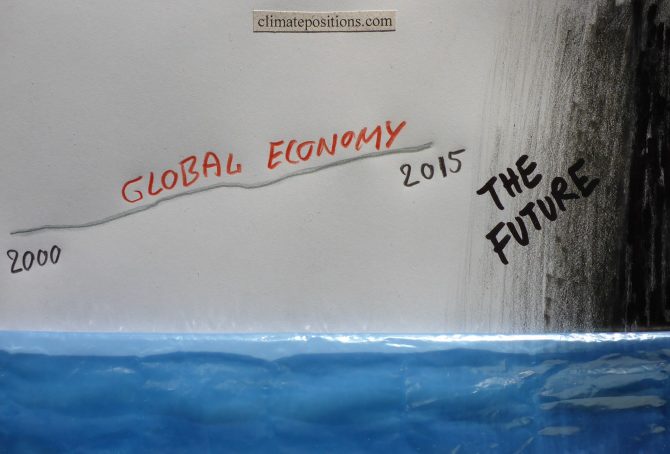
Nobody knows how high the costs of global warming will be in the future. However, ‘Studies’ predict a total of $369 trillion by 2200, assuming that humans will have stopped emitting greenhouse gases from burning Fossil Fuels around 2100 and atmospheric CO2 concentrations will have reached 700 ppm. The calculations include accelerating release of methane from melting permafrost (13% of the total costs).
ClimatePositions calculates the ‘Climate Debt’, accumulated since 2000, for 148 countries with full data. The global Climate Debt amounted to $0.8 trillion in 2005, $2.6 trillion in 2010 and around $6.0 trillion in 2015 (preliminary estimate). The diagram below illustrates the accumulated Climate Debts (red dots) “smooth climbing” towards the predicted costs of $369 trillion by 2200 (black dot) … all speculatively of course!
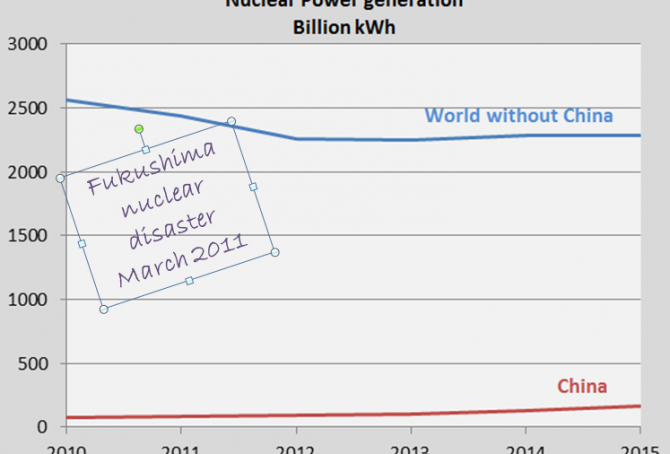
World’s Nuclear Power generation 2015: 1.3% growth compared to 2014
The world’s Nuclear Power generation increased by 1.3% in 2015 compared to 2014 (and 4.0% increase compared to 2012). The table below shows the generation in billion kWh of all Nuclear Power nations and the global generation, since 2010. China increased the generation by 30.2% in 2015 compared to 2014, while the rest of the world the decreased the generation by 0.3%. The global generation level in 2015 is still 7.1% below the 2010-level.

Climate Debt: Australia ranks 8th (performance of the twenty largest coal producers)
2016
Australia covers around 5.7% of planet’s land area and populates 0.3% of its people. The Climate Debt of the 24 million Australian’s amounts to $132 billion, or $5,613 per capita, which ‘Ranks’ Australia 8th among 148 countries – in 2010 the ranking was 6th. Australia is the world’s 5th largest coal producer and the 2nd largest per capita CO2 emitter from coal combustion … and coal is the most efficient climate destroyer. The table below reveals some key figures of the world’s twenty largest coal producers. Subsequently, Australia’s climate change performance is examined in comparison with four other top-five countries on CO2 Emissions from coal combustion (per capita): Kazakhstan (ranked 1), South Africa (3), the United States (4) and Poland (5).
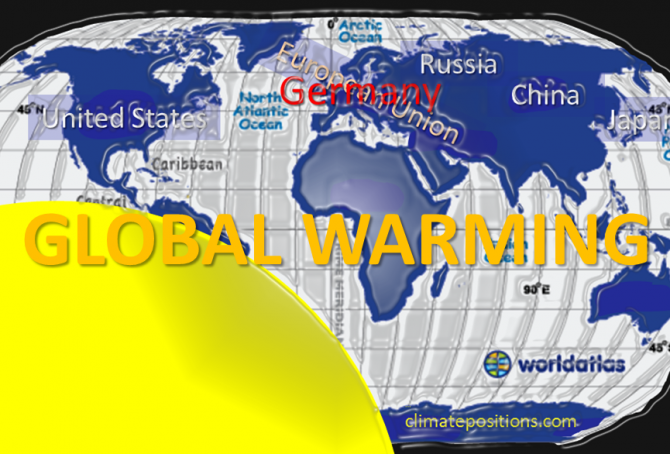
Climate Debt of Germany & the European Union … versus the United States, China, Japan and Russia
The Climate Debt of ‘the 28 member states of the European Union (EU-28)’, China, the United States, Japan and Russia, combined, amounts to nearly 70% of the world’s total Climate Debt of around $5,700 billion. The following compares 1) EU-28 with the four countries, 2) Germany with EU-28, and 3) Germany with the four other countries.
The table below shows the per capita Climate Debt, the total Climate Debt and the share of the global Climate Debt, of EU-28¹, China, the United States, Japan and Russia. Rankings of 148 countries by 2010 and January 2016 (preliminary estimates) are available in the menu “Climate Debt”.
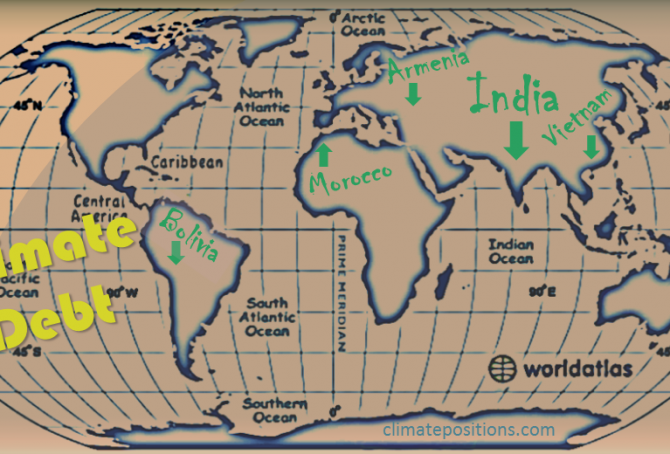
India’s Climate Debt is on track for something big
2016
India’s accumulated Climate Debt is $13 per capita which ranks the populous country 84th among 148 countries (see the ‘Ranking’). The current share of the fast growing global Climate Debt is 0.29%, compared to 0.04% in 2010. The following examines India’s CO2 Emissions (the increase-rates is compared to the historic Chinese rates), Environmental Performance, GDP(ppp-$) and Climate Debt in comparison with Vietnam, Morocco, Armenia and Bolivia, all ranked between 77th and 82nd.

China’s share of the global Climate Debt is growing fast
In 2010 China’s share of the global Climate Debt was 7.4% and by January 2016 it has grown dramatically to 13.3% (see the ‘ranking’). Since 2000 the Chinese share of the growing global CO2 Emissions has grown from 13.7% to about 29.0% (preliminary emissions by 2014). Luckily, the populous superpower has committed itself to pursue “efforts to limit the temperature increase to 1.5 °C” … according to the COP21 Paris Agreement. The following examines the development of CO2 Emissions, Environmental Performance, GDP(ppp-$), Climate Debt and Population (with respect to the one-child policy).

The United States’ huge share of the growing global Climate Debt is decreasing
Worldwide, eyes are on the United States due to its massive historic greenhouse gas emissions and its sabotage of attempts to reach a fair and globally binding reduction agreement. Instead, the world is stocked with “intended nationally determined contributions towards achieving the objective […] consistent with holding the increase in the global average temperature to well below 2°C above preindustrial levels and pursuing efforts to limit the temperature increase to 1.5°C.” If this baloney-goal is to be taken seriously, then the United States must cut emissions from fossil fuels by around 80% (give and take), within fifteen years, or so. The following examines the development of CO2 Emissions, Environmental Performance, GDP(ppp-$) and accumulated Climate Debt.

Update 2015: CO2 Content in the atmosphere has passed 400 ppm
The carbon dioxide content in the atmosphere passed 400 ppm (parts per million) in 2015 (mean). In 2014 the content was 398.61 ppm and in 2015 it was 400.83 ppm – the annually updated figure is used in ClimatePositions.
See the alarming development 1960-2015 in the diagram below. The pre-industrial level was below 300 ppm and 350 ppm is considered the relatively safe limit. Human-caused CO2 Emissions is the main cause of global warming, melting ice sheets, sea level rise and escalation of extreme weather events.

Preliminary Carbon Dioxide Emissions 2014, by country
2015
’The Global Carbon Project’ at Carbon Dioxide Information Analysis Center (CDIAC) has published preliminary CO2 Emissions from fossil fuels and cement for 2014, for more than 200 countries. The data is being used in a preliminary calculation of accumulated Climate Debt in ClimatePositions¹. The table below shows the estimated per capita emissions plus the updated Climate Debts, of the twenty largest total emitters (responsible for 77% of the global emissions in 2014).
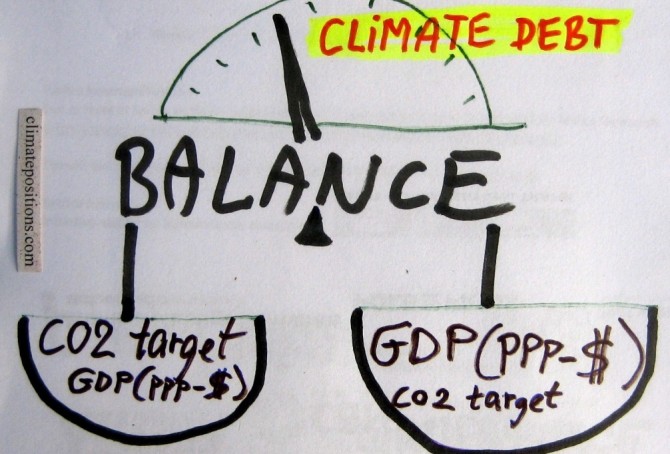
Analyses of the global CO2 target and GDP(ppp-$)
2015
The calculation of Climate Debt in ClimatePositions is based on a balance between many ‘indicators’ and a common global per capita CO2 target. To illustrate the nature of this balance twelve countries are analyzed in this article in terms of the indicator of GDP(ppp-$) and the global CO2 target. The 12-Countries Group represents 38% of the global population, 65% of the global CO2 Emissions from fossil fuels and around 70% of the global Climate Debt.
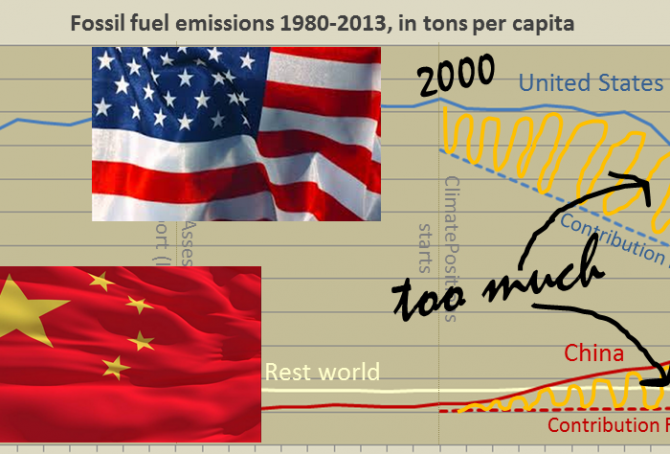
Per capita fossil fuel Carbon Dioxide Emissions: China vs. United States
2015
In different ways, China and the United States are main responsible for the continuing Climate Destruction. Combined the two superpowers, holding 24% of the world population, emitted 43% of the global CO2 from fossil fuels in 2012 and they accounted for 47% of the global Climate Debt¹. Had the two countries consistently promoted a fair and globally binding climate agreement, not thwarted it, then COP21 in Paris in December would not be such an incomprehensible mission impossible². The diagram below shows the per capita fossil fuel carbon dioxide emissions, between 1980 and 2013, of China, the United States and Rest World. The stippled lines indicate the Contribution Free Level of CO2 Emissions in ClimatePositions. More comments below the diagram.