United Arab Emirates: Per Capita Climate Debt $4,444 (Ranked 16) – Fossil CO2 Emissions
In 2024, United Arab Emirates is responsible for 0.54% of the Global Climate Debt accumulated since 2000. Below are some key figures in the calculations.

Oman – per capita Fossil CO2 Emissions and Climate Debt
2020
Oman’s current Climate Breakdown Pricing amounts to $44.28 per tons Fossil CO2 emitted since 2000. The Climate Debt grew from $9,261 per capita in 2015 to $13,602 in 2020. Updated Rankings of 165 countries are available in the menu “Climate Debt”.
The following diagrams expose the trends of Fossil CO2 Emissions, Climate Debt, GDP(ppp-$), Population growth and Ecological Footprint without carbon.

Qatar – per capita Fossil CO2 Emissions and Climate Debt
2020
Qatar’s current Climate Breakdown Pricing amounts to $89.58 per tons Fossil CO2 emitted since 2000. The Climate Debt grew from $51,261 per capita in 2015 to $76,176 in 2020. Qatar is by far the most climate-criminal nation on the planet. Updated Rankings of 165 countries are available in the menu “Climate Debt”.
The following diagrams expose the trends of Fossil CO2 Emissions, Climate Debt, GDP(ppp-$) and Population.
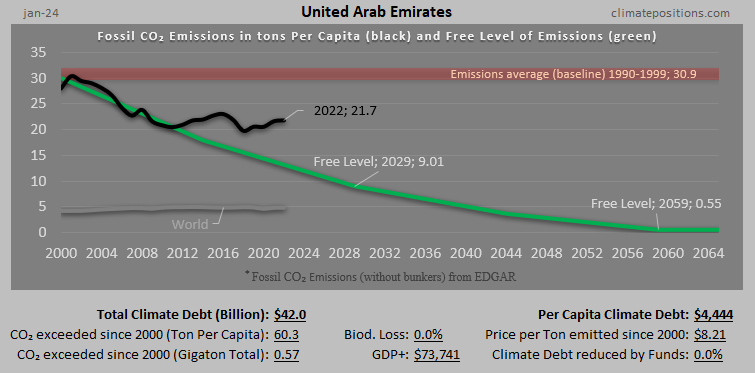
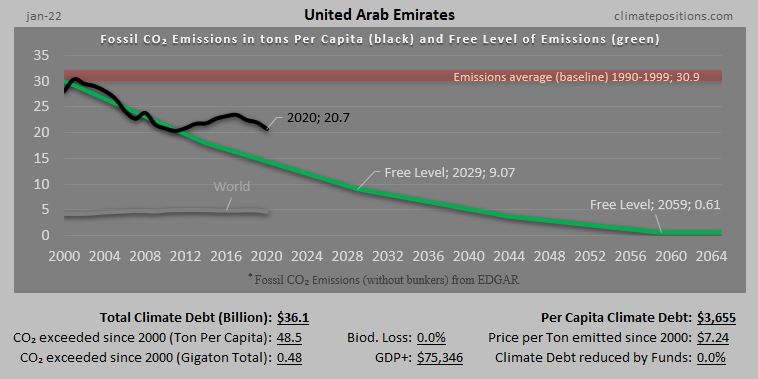
United Arab Emirates (UAE) – per capita Fossil CO2 Emissions and Climate Debt
2020
The current Climate Breakdown Pricing of The United Arab Emirates (UAE) amounts to $30.81 per tons Fossil CO2 emitted since 2000. The Climate Debt grew from $6,522 per capita in 2015 to $14,139 in 2020. Updated Rankings of 165 countries are available in the menu “Climate Debt”.
The following diagrams expose the trends of Fossil CO2 Emissions, Climate Debt, GDP(ppp-$), Population and Ecological Footprint without carbon.
Saudi Arabia – per capita Fossil CO2 Emissions and Climate Debt
2020
Saudi Arabia’s current Climate Breakdown Pricing amounts to $45.11 per tons Fossil CO2 emitted since 2000. The Climate Debt grew from $5,683 per capita in 2015 to $13,955 in 2020. Updated Rankings of 165 countries are available in the menu “Climate Debt”.
The following diagrams expose the trends of Fossil CO2 Emissions, Climate Debt, GDP(ppp-$) and Ecological Footprint without carbon.
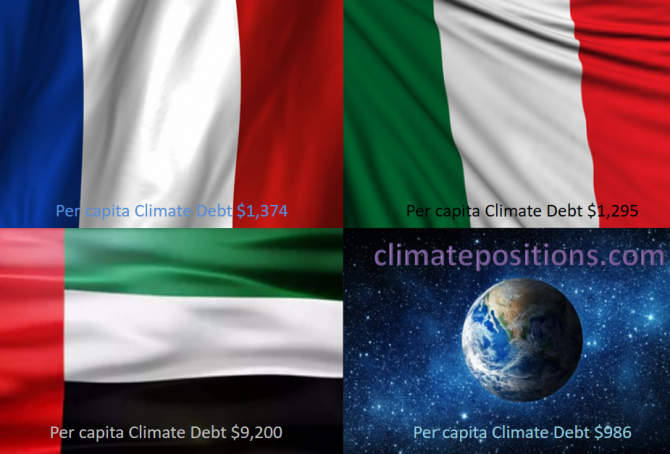
Share of global Climate Debt rank 13th, 14th and 15th: France, United Arab Emirates and Italy (combined responsible for 3.5% of Climate Debt and 2.5% of Fossil CO2 Emissions 2016)
2017
The diagram below shows ‘Share of global Climate Debt‘ in 2010, 2015 and 2017 of France, United Arab Emirates and Italy (ranked 13th, 14th and 15th). The share of United Arab Emirates has increased along with an extreme population growth.
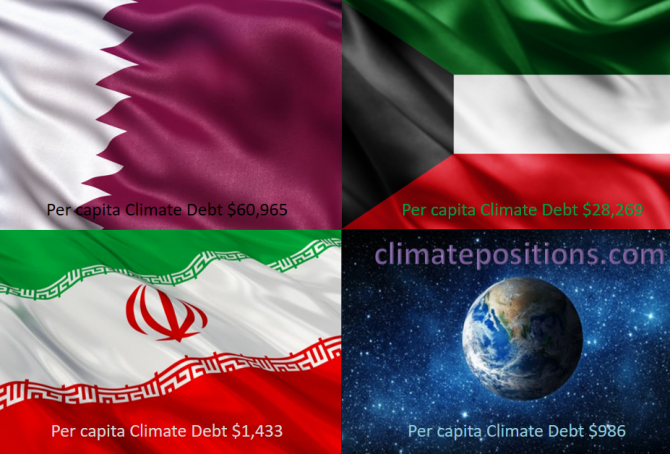
Share of global Climate Debt rank 10th, 11th and 12th: Qatar, Iran and Kuwait (combined responsible for 5.4% of Climate Debt and 2.4% of Fossil CO2 Emissions 2016)
2017
The diagram below shows ‘Share of global Climate Debt‘ in 2010, 2015 and 2017 of Qatar, Iran and Kuwait (ranked 10th, 11th and 12th). The share of Qatar has increased fast along with the extreme population growth. All three countries seem to have peaked on global shares around 2015.
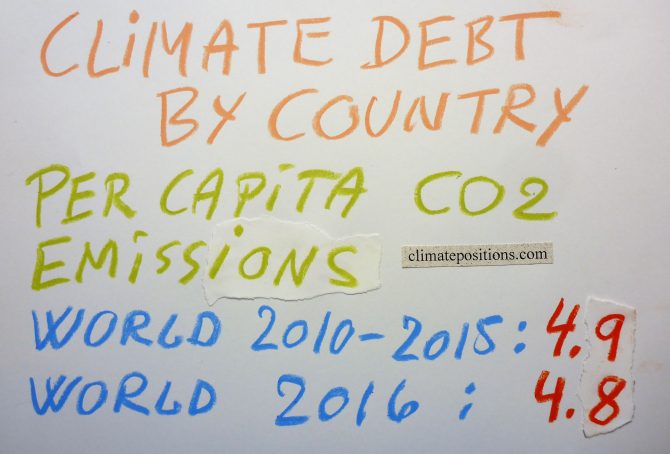
Updated Climate Debt of 163 countries (per capita Fossil CO2 Emissions 1990-2016)
2017
National per capita CO2 Emissions from Fossil Fuels (without bunkers) and industrial processes in 2016 have been released by ‘EDGAR‘. At the same time, recalculated historic emissions have been released, which for some countries make a considerable difference¹ (also with regard to Climate Debt in ClimatePositions). The updated calculations are available in ‘Calculation (Excel)‘, and new rankings of 163 countries are available in the menu “Climate Debt”.
The table below shows World average, and the 15 countries with the largest per capita CO2 Emissions from Fossil Fuels and industrial processes in 2016, in tons, in comparison with average emissions 1990-1999, 2000-2009 and 2010-2015.

Global Carbon Project (CDIAC), located in the United States, stops publishing carbon emissions data by country – will be replaced by EDGAR in ClimatePositions
2017
The Carbon Dioxide Information Analysis Center (CDIAC), located at the U.S. Department of Energy’s (DOE) Oak Ridge National Laboratory, has published annual Carbon Emissions from Fossil Fuels and cement production by country since 1959 (‘Global Carbon Project‘), but now this continuous time series has come to an end and 2015 will be the last data-year (as it seems).
Since carbon emissions data from CDIAC (Global Carbon Project) is the core ‘Indicator‘ in ClimatePositions’ calculation of Climate Debt, carbon emissions data will be replaced with nearly similar data from ‘EDGAR‘ (‘European Commission‘ / ‘Climate Action‘), retroactively since 1990, in connection with the coming updates [done 16-08-2017].
The following describes the differences between CO2 Emissions data from Global Carbon Project (CDIAC) and EDGAR (sourced: European Commission, Joint Research Centre (JRC)/Netherlands Environmental Assessment Agency (PBL). Emission Database for Global Atmospheric Research (EDGAR)), and the consequences in terms of Climate Debt in ClimatePositions – illustrated with a range of country examples. Note that other sources, such as ‘IEA‘, ‘EIA‘ and ‘BP‘, provides CO2 Emissions data-sets different from the ones of CDIAC and EDGAR.

Climate Change Performance: Vietnam vs. United Arab Emirates (UAE)
2017
The difference in climate change performance of Vietnam and United Arab Emirates (UAE) is somewhat educational. Vietnam’s Climate Debt is $14 per capita, while the authoritarian oil state of UAEs is $10,884 (see the latest ‘Ranking‘). The two countries are the world’s 27th and 28th largest emitters of CO2 from Fossil Fuels (without bunker) and cement – combined, they emitted 0.52 % of the global CO2 in 2015. The following examines the ‘Indicators‘ of CO2 Emissions, Population, GDP(ppp-$) and Forest Cover (including Primary Forest).
First, the diagram below shows the national shares of the global Climate Debt, in 2017 and 2012. Both countries increased their shares in recent years, although at completely different levels and in unalike ways.
My own climate change boycott country-list
2017
Without been fanatical about it, I seek to boycott the greediest and most climate-destructive countries on the planet. For the fairness, I have divided the fifteen nominees into two leagues:
A) Countries with per capita Climate Debts more than 10 times world average: Qatar, Kuwait, Brunei, Luxembourg, Trinidad and Tobago, United Arab Emirates and Oman.
B) Countries with per capita Climate Debts between 5 and 10 times world average: Saudi Arabia, United States, Bahrain, Australia, Norway, Equatorial Guinea, Canada and South Korea.
Feel free to copy…
Among the fifteen countries only Luxembourg and South Korea are not among the world’s twenty largest per capita Fossil Fuel producers (read the article: ‘How green are the fossil fuel producers? (Correlation between fossil fuel production, CO2 Emissions, GDP and Climate Debt)‘.
The table below shows some key data of the fifteen countries. The table is read like this: 1) Between 1990 and 1999 Qatar emitted 55.1 tons of CO2 from Fossil Fuels (without bunker) and cement, annually per capita, 2) Between 2000 and 2015 Qatar emitted 51.7 tons (the average Climate Debt Free Level¹ was 32.4 tons), and 3) Qatars GDP(ppp) per capita was $143,788 in 2015.

Climate Debt: The United Arab Emirates ranks 4th (climate destruction branded by sports!) … soon with Nuclear Power
The per capita Climate Debt of the United Arab Emirates (UAE), accumulated since 2000, is $11,865, which ranks the rich oil-state 4th among 148 countries (see the ‘Ranking‘ by January 2016). Before proceeding, read these ten pinpoints of the intolerable situation:
2014-updates of GDP(ppp-$) … rising along with the temperature
2015
The national Climate Debt in ClimatePositions increases with growing GDP(ppp-$)¹. 2014-updates of GDP from ‘World Bank’ are now available in ‘Calculation (Excel)’. The world’s average per capita GDP(ppp-$) grew from $14,417 in 2013 to $14,939 in 2014. The diagram below shows the development in GDP(ppp-$) in 2000-2014 of the world average and five of the world’s largest per capita fossil fuel CO2 Emitters (in 2012): Qatar (50.8 tons of CO2), United Arab Emirates (44.0 tons), Singapore (38.8 tons), Bahrain (25.8 tons) and Saudi Arabia (22.0 tons).

How green are the fossil fuel producers? (Correlation between fossil fuel production, CO2 Emissions, GDP and Climate Debt)
2015
Greenhouse gas emissions from burning of fossil fuels (oil, natural gas and coal), is the main cause of manmade climate change. Comparable energy potentials of oil, natural gas and coal is defined as “tons oil equivalents”, meaning that the energy released from a given quantity of natural gas or coal is equivalent to one ton of oil. This way the total production of fossil fuels can be expressed in a single figure (not to be confused with market value, global warming potential or general usefulness) The world’s production in million tons oil equivalent, was in 2013: oil (4,130), natural gas (3,041 and coal (3,881).
The table below ranks the twenty countries with the largest per capita fossil fuel production (oil equivalents). Total production data of 68 countries is from ‘BPs Statistical Review of World Energy 2014’ (pdf, 48 pages).

Top five in Climate Debt: Qatar, Kuwait, Singapore, United Arab Emirates and Trinidad and Tobago
2015
The updated Climate Debt per capita accumulated since 2000 of the five worst performing countries are:
- Qatar $35,565
- Kuwait $31,828
- Singapore $24,828
- United Arab Emirates $18,386
- Trinidad and Tobago $14,131
See the ‘ranking’ of 147 countries. The total population of the five small countries is 0.24% of the global population but the total Climate Debt is overwhelmingly 7.44% of the global Climate Debt (in 2012). The following analyses the indicators of GDP(ppp-$) and CO2 Emissions from fossil fuels (read about the issues of marine bunkers e.g. in Singapore at the bottom).

United Arab Emirates goes sky high in CO2 Emissions
2013
In 2000 United Arab Emirates (UAE) was one of 76 Contribution Free countries in ClimatePositions, due to a slight reduction in CO2 Emissions (carbon dioxide). In 2005 however, the country was the 17th worst performer and in 2010 the 4th. The diagram shows UAE’s annual CO2 Emissions in tons per capita in the decades 1990-1999 and 2000-2009, and in 2010-2011 (the black bars). For comparison, the gray bars show the average global CO2 Emissions per capita.