Climate performance: Canada versus United States
2013
North America’s 7% of the Global Population accounted for 47% of the global Climate Contributions (climate debt) in ClimatePositions 2010. Canada was the 8th worst performing country out of 145 and United States was the 7th. Most indicators on Canada and United States follow the same trends over time, some with slightly different levels, however.
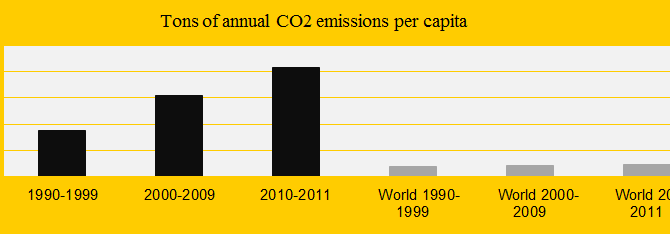
Trinidad and Tobago uses the planet as CO2 dump
2013
The islands Trinidad and Tobago close to Venezuela in South America gives a damn in global warming. The diagram shows the country’s CO2 Emissions (carbon dioxide) per decade compared to the global average. In 1990-1999 emissions were on average 17.4 tons of CO2 and in 2011 the figure was 42.4 tons. In ClimatePositions 2010 Trinidad and T. was the 5th worst performing country in the world with a Contribution (climate debt) of $6,805 per capita.
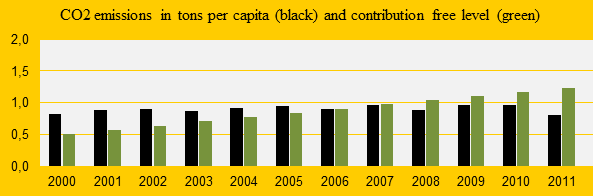
Guatemala is close to being Contribution Free
2013
Guatemala was the 82nd worst performing country out of 145 full data countries in ClimatePositions 2010. The national Contribution (climate debt) was $4 per capita, but in the latest calculation this amount is cut in half thanks to decreasing CO2 Emissions (carbon dioxide) in 2011 (see the front diagram). In a few months Guatemala may be Contribution Free.
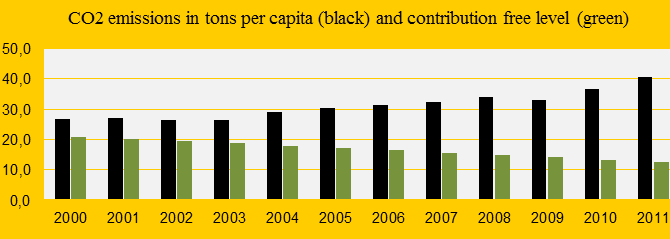
Is Singapore a climate change scoundrel?
2013
The island of Singapore was the 2nd worst performing country in ClimatePositions 2010 with a contribution (climate debt) of $9,924 per capita and there are no signs of improvement since. In the updated calculation the amount has increased to $12,364. The diagram shows the small hybrid regime’s outrageous annual CO2 Emissions (the green bars show the Contribution Free Level). Note that a large proportion of the emissions is due to marine bunkers.

Questions and answers (1-5)
2013
Question 1: Are the contributions in ClimatePositions a valuation of the losses of the planet’s natural heritage?
No, the planet’s nature (biodiversity) is miraculous and priceless. ClimatePositions is a proposal to a fair financial breakdown of the unavoidable additional expenses towards sustainability and climate change actions. The level of Contributions worldwide can be changed with a single entry in the spreadsheet.

Australia perform worst of democratic countries
2013
Australia was the 6th worst performing country in the world in ClimatePositions 2010 with a Climate Contribution of $4,387 per capita. In the latest calculation it had increased to $5,081. The total national Contribution (climate debt) is now 109 billion US$. Since no country in top 5 is Full Democracies, Australia is the worst performing democratic country. It can be assumed that the majority of the Australian voters are pleased with this destructive approach to the planet.

Brazil and the world’s rainforests
2013
Brazil was the 63rd worst performing country in ClimatePositions 2010 with a total Climate Contribution (climate debt) of 12.4 billion US$. In the latest calculation the debt has increased to 15.3 billion US$. Between 1990 and 2010 Brazil cut down the total forest cover (mainly rainforest) from 69.0% to 62.4%.

Obama hoping for change
2013
United States is not only notorious for illegal surveillance, waterboarding, illegal wars and imprisonments without trial – the country is also primarily responsible for climate change. While the oceans are rising Barak Obama is hoping for change (see the Sea Level rise in the diagram below).

54 countries with incomplete data
2013
199 countries are included in ClimatePositions (Excel) but 54 countries have incomplete data (0.5% of the Global Population). The front image shows the 20 largest CO2 Emitters (carbon dioxide) per capita in 2011 among the 54 countries. Without full data it is not possible to calculate the national Climate Contribution (climate debt). See the country list below with the missing data mentioned in brackets. Notes that the national Contributions can be estimated by using indicator assumptions – see an example with Bahrain in the bottom.
About calculation of national climate contributions
2013
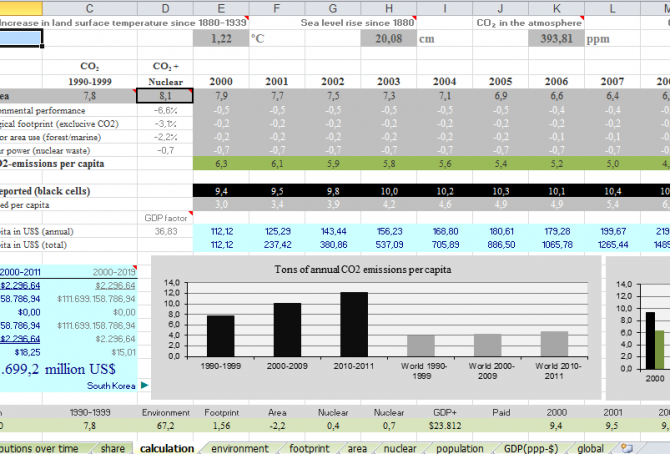
The calculations in ClimatePositions are complex and yet the same for all countries. The progressive national indicator updates since 2000 ensure that the countries multifaceted performances are reflected directly in the Climate Contributions (climate debt). The front image shows the main calculation spreadsheet (Excel) in ClimatePositions. All updated indicator values are entered the spreadsheet and by copying a country from the country list (with all the numerical values) and insert in the country box (cell A30) – all calculations are done automatically and the national Contribution per capita appears (cell B20).
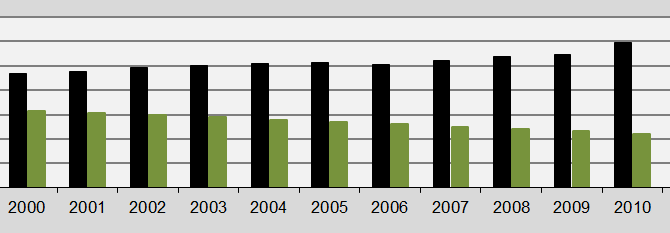
South Korea is going backwards in climate performance
2013
South Korea was the 15th worst performing country out of 145 in ClimatePositions 2010 with a Climate Contribution (climate debt) of $1,904 per capita. As shown in the front diagram the South Korean annual CO2 Emissions (carbon dioxide) have continued to increase in 2011 (12.5 tons per capita) and today the Contribution is $2,297 per capita. The updated calculations for all 145 countries are available in the submenu “Calculations (Excel)”.
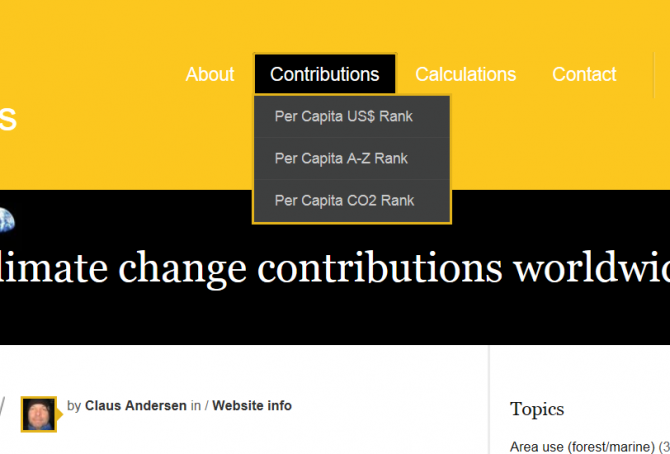
About this website
2013
The resources behind climatepositions.com are independent of economic, political and national interests. The website’s aim is to identify national climate change positions worldwide and thus expose incompetence, hypocrisy and cynicism – and uplifting achievements.
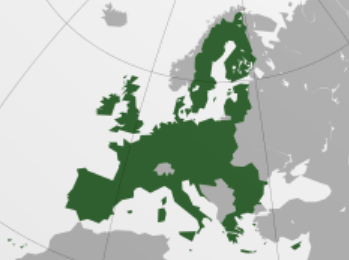
European Union perform poorly
2013
The map (from Wikipedia) shows the very different countries in ‘European Union‘ (EU). As a whole EU perform poorly on the climate challenge and only Romania was Contribution Free in ClimatePositions 2010. Both Netherlands and Belgium are among the top 10 worst performing countries in the world. Se the EU rank at the end and the global ranking in the menu “Contributions/Per Capita US$ Rank”).
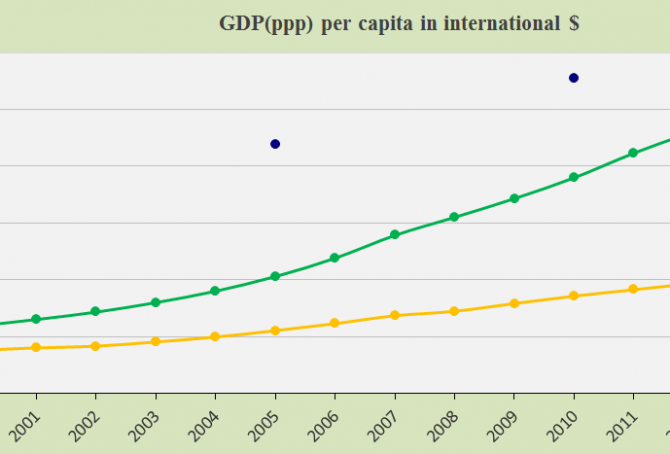
India keeps the balance between growth and CO2 emissions
2013
India is the 4th largest CO2 Emitter in the world (in 2006-2010) but Contribution Free due to a balanced increase in economic growth and CO2 Emissions per capita. The front diagram show India’s annual GDP(ppp-$) in comparison with China and the global average (the blue dots). Subject to modifications in the data source. Economic growths in these two countries are causing an increasing proportion of the global CO2 Emissions (28.3% in 2006-2010) and thus climate change.
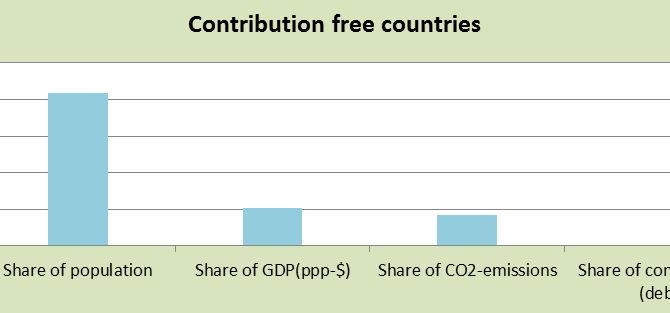
63 countries are Contribution Free in ClimatePositions
2013
63 of 145 countries with full data are Contribution Free in ClimatePositions 2010. See the list below. The diagram above show these countries’ total share of the global: 1) Population (41.9%), 2) GDP(ppp-$) (10.4%), 3) CO2 Emission (8.4%) and 4) Contribution (0.0%). The total global Climate Contribution (climate debt) was 2,834 billion US$ in 2010 but the world’s most powerful leaders defend their national economic privileges with immature persistence!