Global indicator updates: Land-Ocean Air Temperature, Sea Level, CO2 in the Atmosphere and Population
2019
The four global Indicators: 1) Land-Ocean Air Temperature, 2) Sea Level, 3) CO2 in the Atmosphere and 4) Population, have all been updated in ClimatePositions. Combined, the updates resulted in significant increases in national Climate Debts (the first two, due to adjustments of the national GDP-Factor and the last two, due to adjustments of the global Fossil CO2 Emission target). As an example, India’s Climate Debt increased from $0.30 per capita (rounds to zero), to $2 per capita, only because of the global Indicator updates.
Diagrams with the four global Indicators are shown below.
Global indicator updates: Land-Ocean Temperature, Sea Level, CO2 in the Atmosphere and Population
2018
The four global Indicators: Land-Ocean Temperature, Sea Level, CO2 in the Atmosphere and Population have been updated in ‘ClimatePositions (Excel)‘. Combined, the updates resulted in significant increases in national Climate Debts. Land-Ocean Temperature and Sea level due to adjusting the national GDP-Factor, while CO2 in the Atmosphere and Population due to adjusting the global Fossil CO2 Emission Target.
Diagrams with the four global Indicators are shown below [diagram were replaced 15-02-2018].

Global Indicator Updates 2016: Sea Level, Population and CO2 Content in the atmosphere
2017
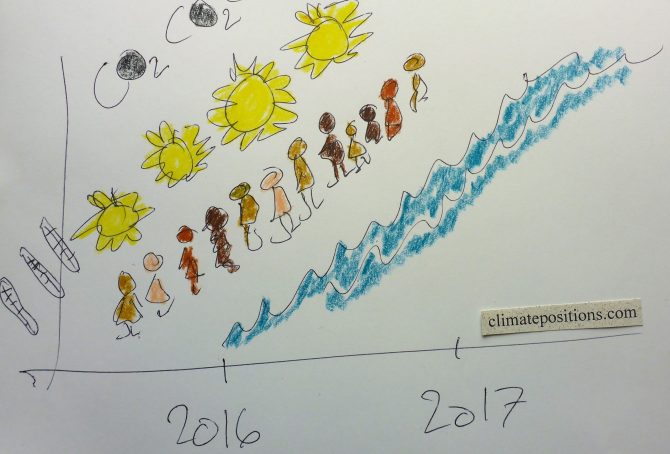
The estimated annual global Sea Level rise since 1993 increased from 3.3 mm (±0.4 mm) in 2015 to 3.4 mm (±0.4 mm) in 2016. The increase suggests an accelerating rate of Sea Level rise, which is illustrated in the diagram below. The growing volume of the oceans is caused by two effects of global warming: melting ice and warmer oceans. In ClimatePositions the Sea Level rise between 1880 and 1993 is set at 1.2 mm annually, or 14 cm during the 113-year period. The total estimated Sea Level rise between 1880 and 2016 adds up to 21.82 cm and this figure is used as an ‘Indicator‘ in ClimatePositions.
The Sea Level rise between 2004 and 2016 is shown below (Sea Level 1880 and 1993 is set at 0 cm and 14 cm, respectively) – the unscientific polynomial trend line projects the scary tendency by 2100.
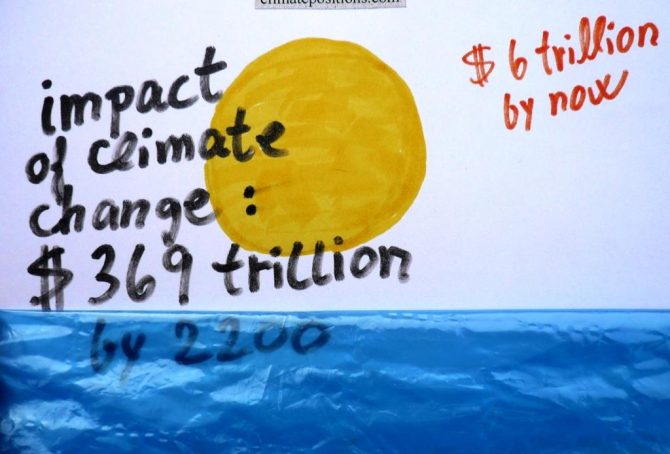
Predicted impact of climate change: $369 trillion by 2200 (study)
2016
Nobody knows how high the costs of global warming will be in the future. However, ‘Studies’ predict a total of $369 trillion by 2200, assuming that humans will have stopped emitting greenhouse gases from burning Fossil Fuels around 2100 and atmospheric CO2 concentrations will have reached 700 ppm. The calculations include accelerating release of methane from melting permafrost (13% of the total costs).
ClimatePositions calculates the ‘Climate Debt’, accumulated since 2000, for 148 countries with full data. The global Climate Debt amounted to $0.8 trillion in 2005, $2.6 trillion in 2010 and around $6.0 trillion in 2015 (preliminary estimate). The diagram below illustrates the accumulated Climate Debts (red dots) “smooth climbing” towards the predicted costs of $369 trillion by 2200 (black dot) … all speculatively of course!
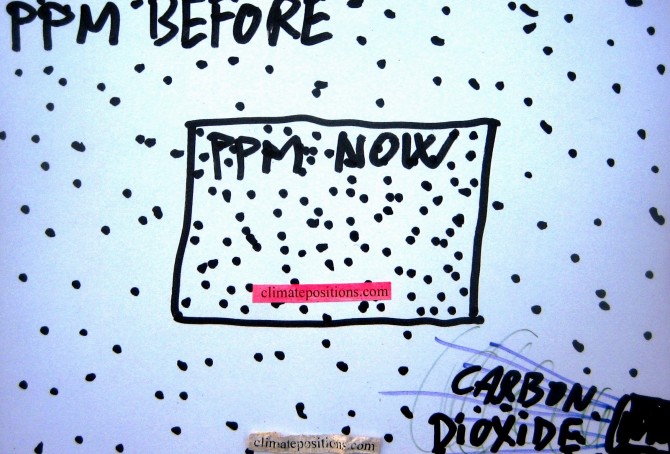
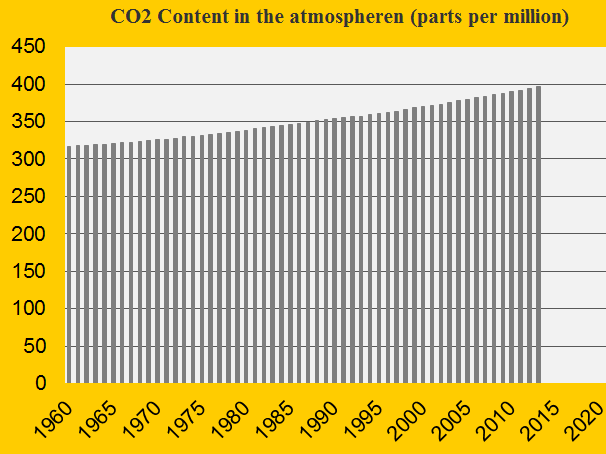
Update 2015: CO2 Content in the atmosphere has passed 400 ppm
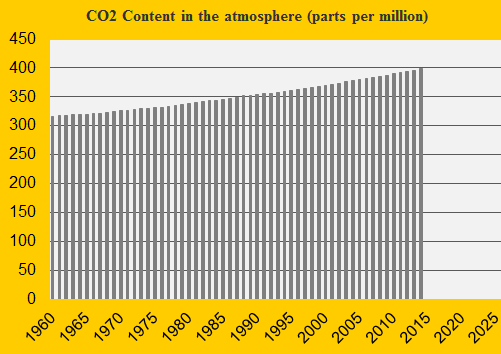
The carbon dioxide content in the atmosphere passed 400 ppm (parts per million) in 2015 (mean). In 2014 the content was 398.61 ppm and in 2015 it was 400.83 ppm – the annually updated figure is used in ClimatePositions.
See the alarming development 1960-2015 in the diagram below. The pre-industrial level was below 300 ppm and 350 ppm is considered the relatively safe limit. Human-caused CO2 Emissions is the main cause of global warming, melting ice sheets, sea level rise and escalation of extreme weather events.
Greenhouse gas emissions and COP negotiation strategies
2015
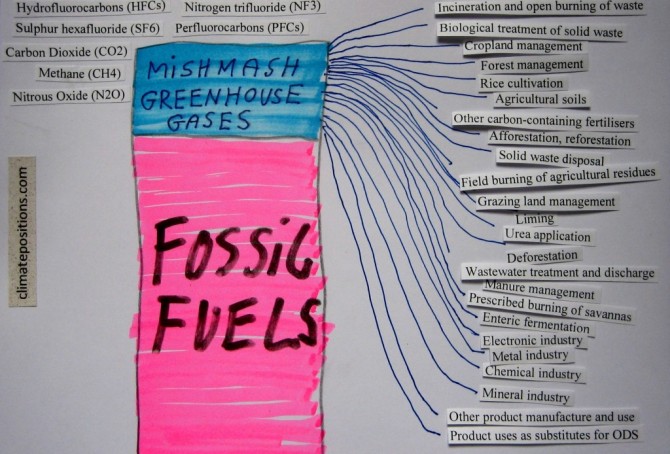
This article is about the different greenhouse gases and what appears to be a delaying COP negotiation strategy on the road to a potentially very costly global greenhouse gas reduction agreement. The essential climate change problem (as I see it) is the greenhouse gas emissions related to fossil fuels. As an example, around 82% of all anthropologic greenhouse gases in the United States are related to coal, oil or natural gas. This measure includes emissions of three different greenhouse gases: carbon dioxide (CO2), methane (CH4) and nitrous oxide (N2O).
Since 1990 the atmospheric concentrations of these three gases has increases by around 13% (carbon dioxide), 7% (methane) and 6% (nitrous oxide). However, the three gases are also emitted from other sources than fossil fuels, including many natural sources … in addition, the potent synthetic fluorinated gases (F-gases) are not related to fossil fuels at all. On a global scale the overall picture is extremely complicated. Note that water vapor is the dominant greenhouse gas among all, but it is not considered relevant to the anthropogenic global warming – and therefore water vapor is usually not regarded as a greenhouse gas.
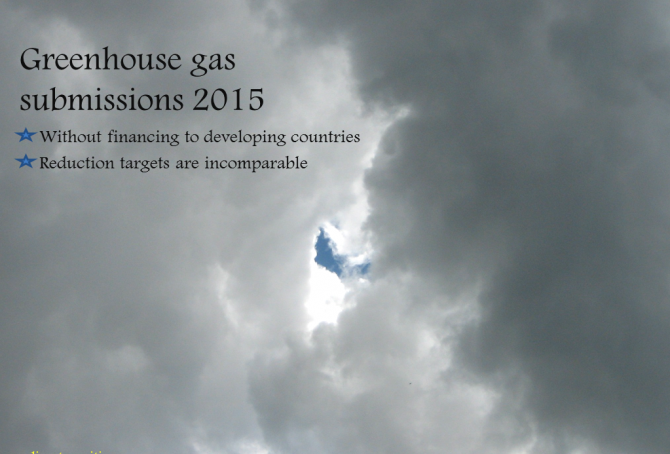
Greenhouse gas submissions of the United States, the European Union and Russia, by March 2015
Submissions of 33 countries (including ‘EU-28‘) with “intended nationally determined” greenhouse gas reductions have so far reached the United Nation’s ‘COP process website’. The greenhouse gas reductions proclaimed in the submissions include, besides carbon dioxide (CO2), gases such as methane, nitrous oxide, perfluorocarbons, hydrofluorocarbons, sulphur hexafluoride and nitrogen trifluoride – and changes in land-use and forestry. This mixture of different sources together with different parties, base years and target years, make the intended greenhouse gas reductions both muddy and incomparable between nations. None of the submissions so far include future financing to developing countries.
The following compares the submissions of the United States, the European Union (EU-28) and Russia – combined these 30 countries were responsible of 34% of the global carbon dioxide emissions from fossil fuels in 2012.
Update 2014 of the CO2 Content in the atmosphere
2015
The CO2 Content in the atmosphere measured in ppm (parts per million) set a new record in 2014 (as in all years in decades). In 2013 the content was 396.48 ppm and in 2014 it was 398.55 ppm – this updated figure is used in ClimatePositions.
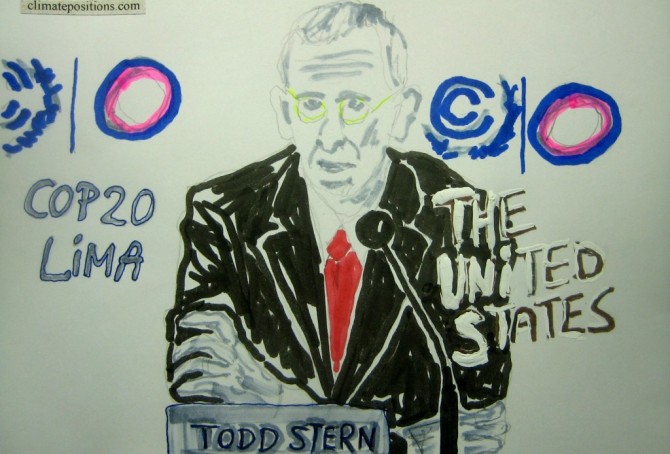
COP20 in Lima: Derailed negotiations and depressed scientists
2014
Since ‘COP1 in Berlin’ in 1995 the global CO2 Emissions from fossil fuels have increased by 50% (in addition to increased greenhouse gas emissions from deforestation, cement production, melting permafrost, etc.). The purpose of COP1, COP2, COP3, COP4, COP5, COP6, COP7, COP8, COP9, COP10, COP11, COP12, COP13, COP14, COP15, COP16, COP17, COP18 and COP19 were to reduce dangerous greenhouse gases and counteract global warming. The current COP20 in Lima builds on twenty years of mushrooming in a flawed system without tools to secure meaningful negotiations and reject derailments caused by powerful nations such as the United States and China. Meanwhile, depression¹ is spreading from climate scientists to larger parts of the planet’s population.
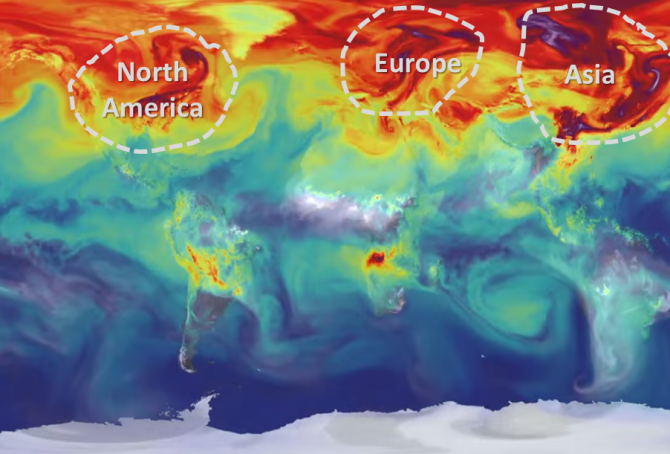
NASA video showing one year of carbon dioxide emissions swirling in the atmosphere
2014
‘NASA’ has released this simulated ‘video 3:10’ showing the global carbon dioxide emissions in 2006 in three minutes. The simulation illustrates plumes of CO2 swirling and shifting as winds disperse the emissions away from its sources. The animation also shows the swings in concentrations as the growth cycle of plants and trees changes with the seasons. ‘CO Emissions’ (monoxide) from forest fires are also visualized in the video.
Since 2006 the global CO2 Emissions from fossil fuels have increased by 14% and the CO2 content in the atmosphere has increased from 382 ppm in 2006 to 396 ppm in 2013. Below are ranked the twenty countries¹ with the largest CO2 Emissions per capita in 2012, with the climate dept per capita and the percentage of the global Climate Contribution (climate debt). The calculations of climate debt and the data of all countries are available in the menu ‘Calculations (Excel)’.
Carbon cycle for beginners
2014
Carbon is one out of 118 known chemical elements and symbolized with a “C” (as in CO2). Carbon is globally spread and essential for all life (18.5% of the human body mass is carbon). However, only around 0.003% of the carbon on earth is within living organisms and possibly the double occur in ancient organic deposits of coal, oil, gas and peat. Pure carbon can be chemically composed several ways, for example in the form of diamond, graphite, graphene or simply as amorphous carbon. See this short instructive video: ‘Carbon – Periodic Table of Videos (10:02)’. Carbon forms almost ten million known compounds with other chemical components, which is more than any other chemical element. Carbon dioxide (or CO2) is one compound, composed of one atom of carbon (C) and two atoms of oxygen (O2). Methane (or CH4) is another, composed of one atom of carbon and four atoms of hydrogen.

Videos about Global Warming
2014
Climate Change science is one thing, but dissemination of quality information through the media is another. Below you will find thirteen selected free videos on various topics related to Global Warming. Film and video make the often technical discussion around Climate Change more accessible and dramatic. If after reviewing the videos you are curious to know which countries are the most resistant to reason, you can see the country ranking ‘here‘.
NOAA Research (Earth System Research Laboratory): “Time history of atmospheric Carbon Dioxide from 800,000 years ago until January 2012”: ‘video 3:35‘.
Update 2013 of the CO2 Content in the atmosphere
2014
The CO2 Content in the atmosphere measured in ppm (parts per million) is skyrocketing because of the increase in human-caused emissions. In 2012 the content was 393.82 ppm and in 2013 it was 396.48 (this updated figure is used in ClimatePositions). Some scientists estimate that 350 ppm is the “safe” limit of CO2 in the atmosphere. See the development 1960-2013 in the diagram. This is the main cause of Global Warming, Climate Change (extreme weather phenomena) and rising Sea Level.
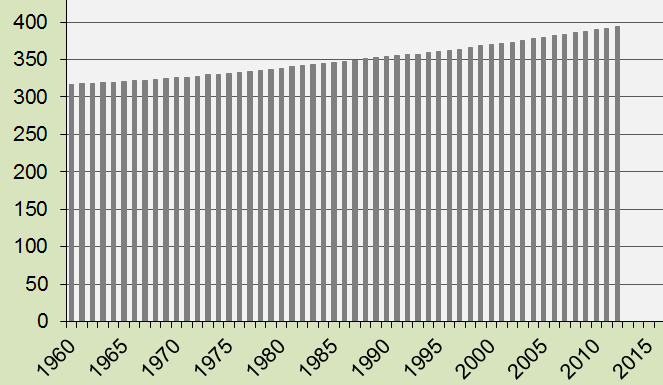
CO2 Content in the atmosphere since 1960
2013
The diagram shows the concentration of CO2 (carbon dioxide) in the atmosphere as parts per million (ppm) 1960-2012. In 1960 the figure was 317 ppm and in 2012 it was 394 ppm. The annually updated figure is included in the latest version of ClimatePositions with impact on the national Climate Contributions.