Climate change performance: Egypt vs. Ukraine
Egypt and Ukraine are the world’s 25th and 26th largest emitters of CO2 from Fossil Fuels and cement. Combined, the two countries were responsible for 1.2% of global CO2 Emissions in 2015. The following examines the ‘Indicators‘ of CO2 Emissions, GDP(ppp-$), Ecological Footprint and the Ukrainian Nuclear Power.
The diagrams below show the per capita CO2 Emissions from Fossil Fuel (without bunkers) and cement, since 2000. The green bars show the Free Emission Level¹ – the exceedance is the basis for calculating the national Climate Debt.

Climate change performance: Malaysia vs. Spain
2017
Malaysia and Spain are the world’s 23rd and 24th largest emitters of CO2 from Fossil Fuels and cement. Combined, the two countries were responsible for 1.4% of world CO2 Emissions in 2015. The following examines the ‘Indicators‘ of CO2 Emissions, GDP(ppp-$), Forest Cover (and Primary Forest) and Environmental Performance.
The diagrams below show the per capita CO2 Emissions from Fossil Fuel (without bunkers) and cement, since 2000. The green bars show the Free Emission Level¹ – the exceedance is the basis for calculating the national Climate Debt. The Spanish reductions are pretty much balanced by the Malaysian increases … which is world symptomatic.
Climate change performance: Kazakhstan vs. Poland
2017
In 2015 Kazakhstan and Poland were the world’s 2nd and 4th largest per capita coal producers. No wonder, the two countries, inhabited by 0.76% of the global population, emitted as much as 1.58% of the CO2 from Fossil Fuels (without bunkers) and cement.
The diagrams below show the per capita CO2 Emissions from Fossil Fuels (without bunkers) and cement, annually since 2000. The green bars show the Free Emission Level¹ – the exceedance is the basis for calculating the national Climate Debt.
Climate change performance: Thailand vs. France
2017
Thailand and France are the world’s 19th and 20th largest emitters of CO2 from Fossil Fuels and cement. Combined, the two countries were responsible for 1.8% of world CO2 Emissions in 2015. The following examines the ‘Indicators‘ of CO2 Emissions, GDP(ppp-$), Ecological Footprint, Forest Cover and Nuclear Power.
The diagrams below show the per capita CO2 Emissions from Fossil Fuel (without bunkers) and cement, since 2000. The green bars show the Free Emission Level¹ – the exceedance is the basis for calculating the national Climate Debt.
Climate change performance: Turkey vs. Italy
2017
Turkey and Italy are the world’s 17th and 18th largest emitters of CO2 from Fossil Fuels and cement. Combined, the two countries were responsible for 2.0% of world CO2 Emissions in 2015. The following examines the ‘Indicators‘ of CO2 Emissions, GDP(ppp-$) and Forest Cover (including Primary Forest).
The diagrams below show the per capita CO2 Emissions from Fossil Fuel (without bunkers) and cement, since 2000. The green bars show the Free Emission Level¹ – the exceedance is the basis for calculating the national Climate Debt.
My own climate change boycott country-list
2017
Without been fanatical about it, I seek to boycott the greediest and most climate-destructive countries on the planet. For the fairness, I have divided the fifteen nominees into two leagues:
A) Countries with per capita Climate Debts more than 10 times world average: Qatar, Kuwait, Brunei, Luxembourg, Trinidad and Tobago, United Arab Emirates and Oman.
B) Countries with per capita Climate Debts between 5 and 10 times world average: Saudi Arabia, United States, Bahrain, Australia, Norway, Equatorial Guinea, Canada and South Korea.
Feel free to copy…
Among the fifteen countries only Luxembourg and South Korea are not among the world’s twenty largest per capita Fossil Fuel producers (read the article: ‘How green are the fossil fuel producers? (Correlation between fossil fuel production, CO2 Emissions, GDP and Climate Debt)‘.
The table below shows some key data of the fifteen countries. The table is read like this: 1) Between 1990 and 1999 Qatar emitted 55.1 tons of CO2 from Fossil Fuels (without bunker) and cement, annually per capita, 2) Between 2000 and 2015 Qatar emitted 51.7 tons (the average Climate Debt Free Level¹ was 32.4 tons), and 3) Qatars GDP(ppp) per capita was $143,788 in 2015.
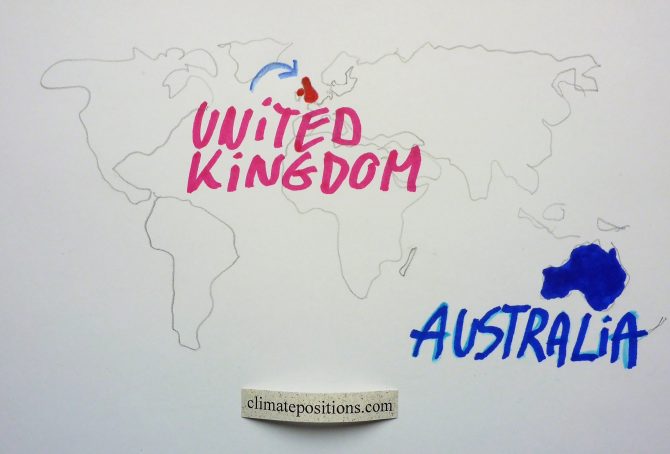
Climate change performance: The United Kingdom vs. Australia
2017
The United Kingdom and Australia and are the world’s 15th and 16th largest emitters of CO2 from Fossil Fuels and cement. Combined, the two countries were responsible for 2.2% of world CO2 Emissions in 2015. The following examines the ‘Indicators’ of CO2 Emissions, GDP(ppp-$) and Ecological Footprint (without carbon footprint).
The diagrams below show the per capita CO2 Emissions from Fossil Fuel (without bunkers) and cement, since 2000. The green bars show the Free Emission Level¹ – the exceedance is the basis for calculating the national Climate Debt.
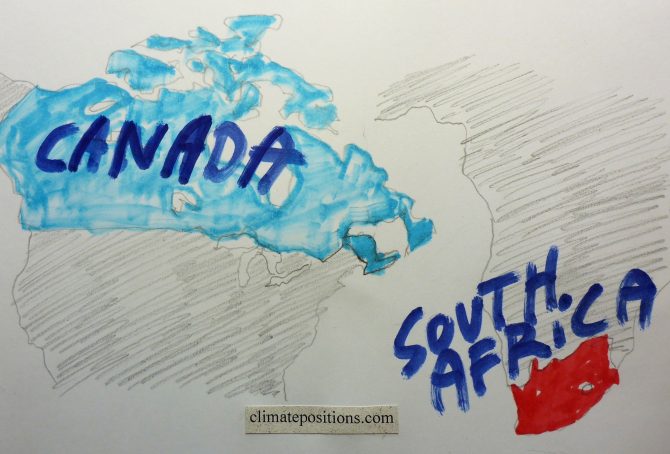
Climate change performance: Canada vs. South Africa
2017
Canada and South Africa are the world’s 13th and 14th largest emitters of CO2 from Fossil Fuels and cement. Combined, the two countries were responsible for 2.6% of world CO2 Emissions in 2015. The following examines the ‘Indicators‘ of CO2 Emissions, GDP(ppp-$), Ecological Footprint and Nuclear Power.
The diagrams below show the per capita CO2 Emissions from Fossil Fuel (without bunkers) and cement, since 2000. The green bars show the Free Emission Level¹ – the exceedance is the basis for calculating the national Climate Debt. Canada’s emissions from coal decreased by 41.3% between 2000 and 2014 (coal caused 13% of the CO2 Emissions from Fossil Fuels in 2014). South Africa’s emissions from coal increased by 6.4% between 2010 and 2014 (coal caused 83% of the CO2 Emissions from Fossil Fuels in 2014).
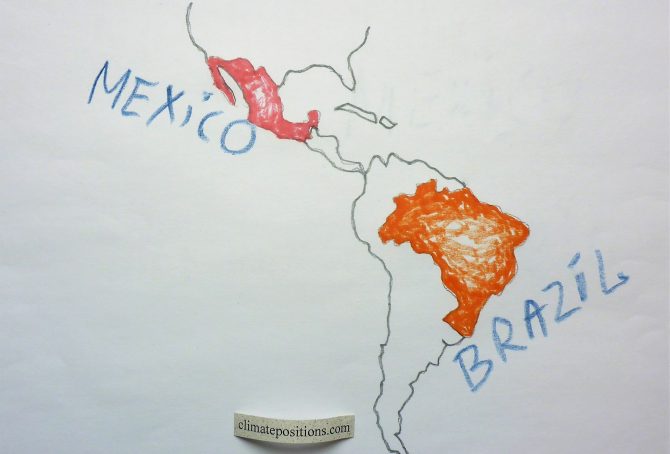
Climate change performance: Brazil vs. Mexico
2017
Brazil and Mexico are the world’s 11th and 12th largest emitters of CO2 from Fossil Fuels and cement. Combined, the two countries were responsible for 2.8% of world CO2 Emissions in 2015. The following examines the ‘Indicators‘ of CO2 Emissions, GDP(ppp-$), Forest Cover, Primary Forest and Ecological Footprint (without carbon footprint).
The diagrams below show the per capita CO2 Emissions from Fossil Fuel (without bunkers) and cement, since 2000. The green bars show the Free Emission Level¹ – the exceedance is the basis for calculating the national Climate Debt.
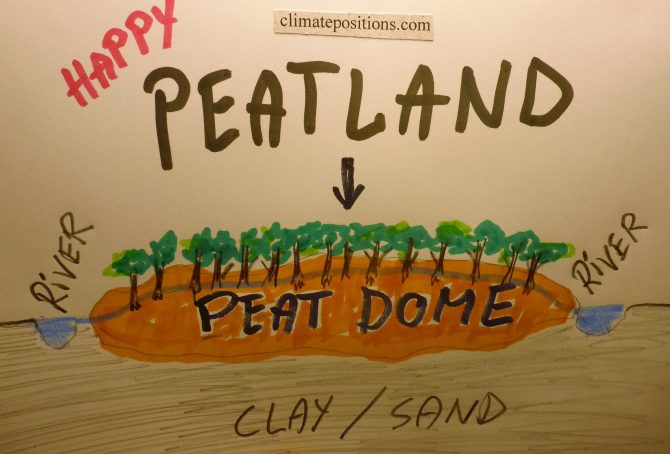
Climate change performance: South Korea vs. Indonesia (peatlands in Southeast Asia)
2017
In 2015 South Korea and Indonesia accounted for 3.60% and 0.51% of the global Climate Debt, respectively (see the ‘Ranking‘). The following examines the ‘Indicators‘ of CO2 Emissions, GDP(ppp-$), Forest Cover (and peatlands) and Primary Forest.
The first two diagrams show the per capita CO2 Emissions from Fossil Fuel (without bunkers) and cement, annually since 2000, of South Korea and Indonesia. The green bars show the Free Emission Level¹ – the exceedance is the basis for calculating the national Climate Debt. The world’s 9th and 10th largest CO2-emitters were responsible for 1.7% (South Korea) and 1.5% (Indonesia) of global emissions in 2015, respectively. South Korea’s per capita emissions were 11.7 tons in 2015 (preliminary), while Indonesia’s were 2.1 tons (preliminary), which was 2.2% above the 2014-level.
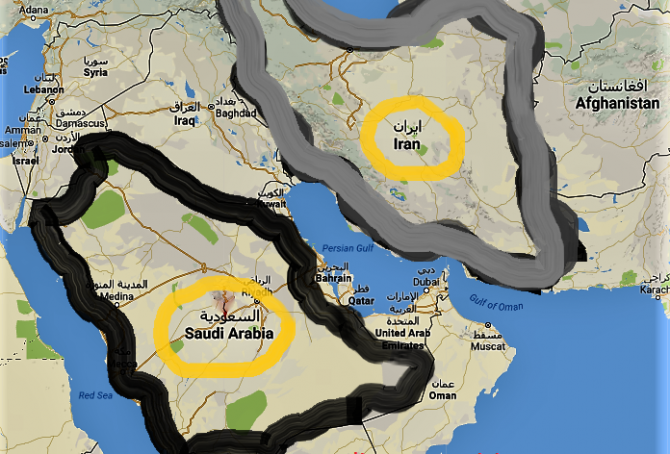
Climate change performance: Iran vs. Saudi Arabia (gas and oil)
2016
The large oil and gas producers Iran and Saudi Arabia are the world´s 7th and 8th largest emitters of CO2 from Fossil Fuels. The diagrams below show the per capita CO2 Emissions from Fossil Fuels (without bunkers) and cement, annually since 2000. The green bars show the Free Emission Level¹ – the exceedance is the basis for calculating the national Climate Debt. Iran and Saudi Arabia were responsible for 1.9% and 1.7% of global emissions in 2015.
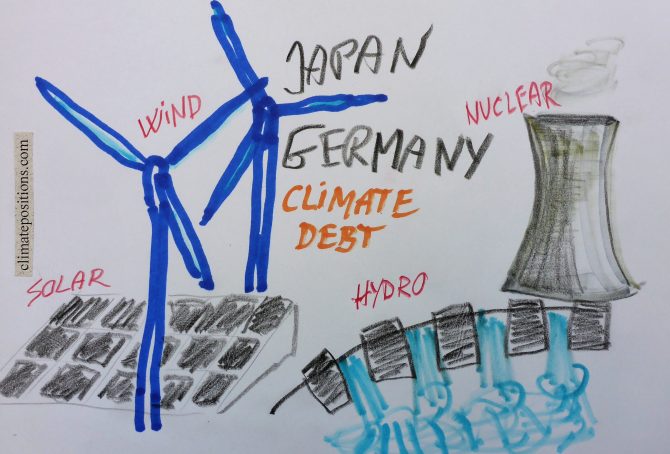
Climate change performance: Japan vs. Germany (Renewable Energy and Nuclear Power)
2016
The world’s 5th and 6th largest emitters of CO2 from Fossil Fuel (without bunkers) and cement Japan and Germany, were responsible for 3.4% and 2.1% of the global emissions in 2015. The diagrams below show the per capita CO2 Emissions, annually since 2000. The green bars show the Free Emission Level¹ – the exceedance is the basis for calculating the national Climate Debt.
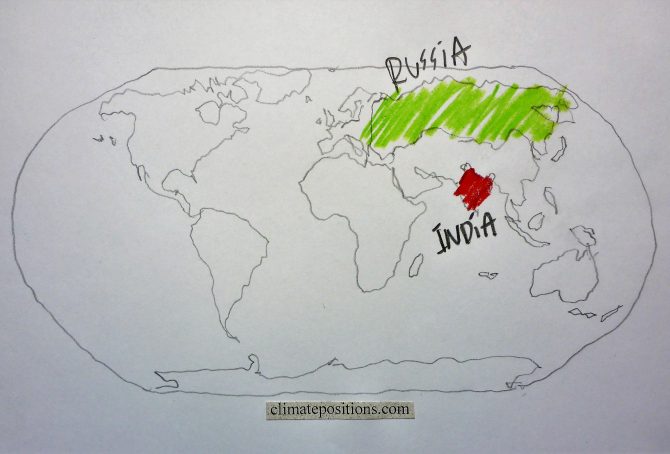
Climate change performance: India vs. Russia (CO2 Emissions from coal)
2016
The diagrams below show the per capita CO2 Emissions from Fossil Fuel (without bunkers) and cement, annually since 2000, of India and Russia. The green bars show the Free Emission Level¹ – the exceedance is the basis for calculating the national Climate Debt. The world’s 3rd and 4th largest CO2-emitters were responsible for 6.5% (India) and 4.9% (Russia) of global emissions in 2015. India’s per capita emissions were 1.7 tons in 2015 (preliminary), which was 4.0% above the 2014-level.

Climate change performance: China vs. the United States (wealth inequality)
2016
The diagrams below show the per capita CO2 Emissions from Fossil Fuel (without bunkers) and cement, annually since 2000, of China and the United States. The green bars show the Free Emission Level¹ – the exceedance is the basis for calculating the national Climate Debt. The world’s two largest CO2-emitters were responsible for 29% (China) and 15% of global emissions in 2015.
Apparently, China’s per capita emissions have peaked, while the moderate reduction-rate 2006-2012 of the United States, has flattened out.
Update: GDP(ppp-$) 2015
2016
2015-updates of national per capita GDP(ppp-$) from ‘World Bank’ is now available in ‘Calculation (Excel)’. The world’s average per capita GDP(ppp-$) grew from $15,065 in 2014 to $15,470 in 2015 (2.7% growth). In the midst of an unprecedented man-made climate catastrophe and the ‘Sixth mass extinction’ in progress, the human economy keeps growing.
The diagram below shows the development in per capita GDP(ppp-$) 2000-2015 of the world’s five largest emitters of CO2 from Fossil Fuel and cement: China (27.0% of the global emissions), the United States (14.7%), India (7.2%), Russia (4.9%) and Japan (3.4%), in comparison with the world’s average.
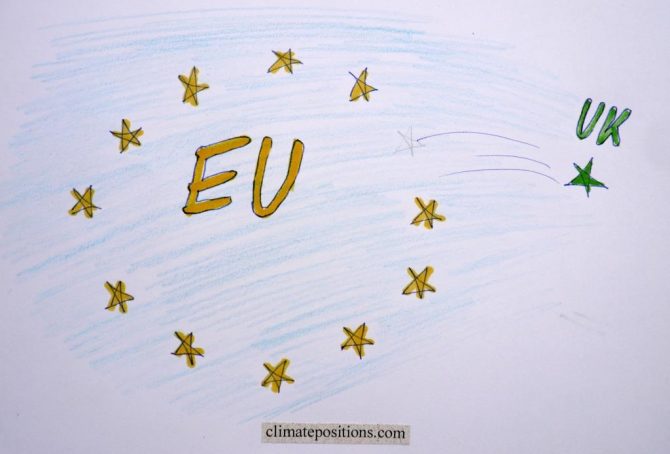
Climate change performance of the United Kingdom in comparison with the European Union
2016
Given that the United Kingdom (UK) has decided to leave the European Union (EU), the following examines the development of CO2 Emissions, Ecological Footprint, GDP(ppp-$) and Climate Debt of the UK in comparison with EU.
Between 1860 and 1890 the UK was the world’s largest greenhouse gas emitter and as late as 1966 the UK was still the 4th largest emitter. See this ‘Interactive timeline of the world’s top 20 emitters‘. When it comes to CO2 Emissions from fossil fuels (without bunker fuels) and cement production the UK was the world’s 15th largest emitter in 2014 (preliminary).
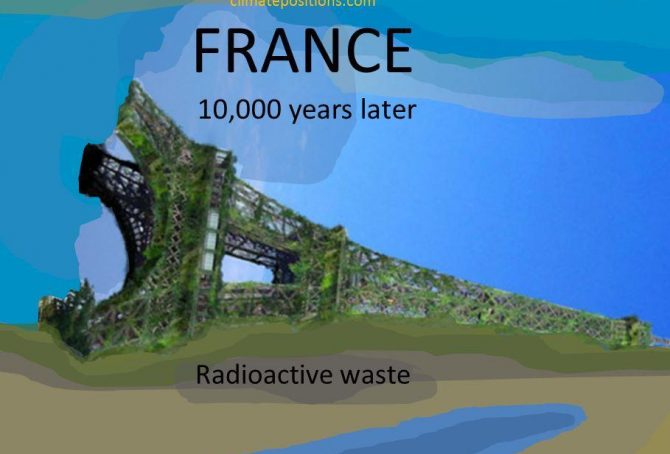
Climate Debt: France ranks 35th among 148 countries
2016
France is responsible for 1.3% of the global Climate Debt of $5.7 trillion, accumulated since 2000. The French per capita Climate Debt by January 2016 was $1,148 which ‘Ranked’ France 35th among 148 countries, compared to 28th in 2010. Different rankings are available in the menu “Climate Debt”. The following examines the CO2 Emissions, Nuclear Power, Environmental Performance, GDP(ppp-$) and Climate Debt of France, in comparison with four countries with significant French-speaking populations: Canada, Belgium, Switzerland and Algeria.
The first diagram shows the French per capita CO2 Emissions from fossil fuels (without bunker fuels) and cement production in decades in comparison with the world average. CO2 Emissions since 2012 are preliminary estimates. From 6.2 tons in the 1990s the level decreased to 5.7 tons on average between 2000 and 2014 (preliminary). The green bars are the Contribution Free Level in ClimatePositions, determined by the level of emissions in the 1990s and a number of continuously updated ‘Indicators’.

Climate Debt: Ireland ranks 14th … however, with significant CO2 reductions over the last decade
2016
Ireland’s current Climate Debt is $2,704 per capita and the ‘Ranking’ by January 2016 was 14th among 148 countries. The following examines the Irish climate change performance in comparison with the United Kingdom, France, Canada and the United States.
The first diagram shows Ireland’s per capita CO2 Emissions from fossil fuels (without bunker fuels) and cement production in decades in comparison with the world average. CO2 Emissions since 2012 are preliminary estimates. From 9.4 tons emitted in the 1990s the level increased to 10.4 tons on average between 2000 and 2009 – and then dropped to 8.0 tons on average between 2010 and 2014 (preliminary). The green bars are the Contribution Free Level in ClimatePositions, determined by the level of emissions in the 1990s and a number of continuously updated ‘Indicators’.
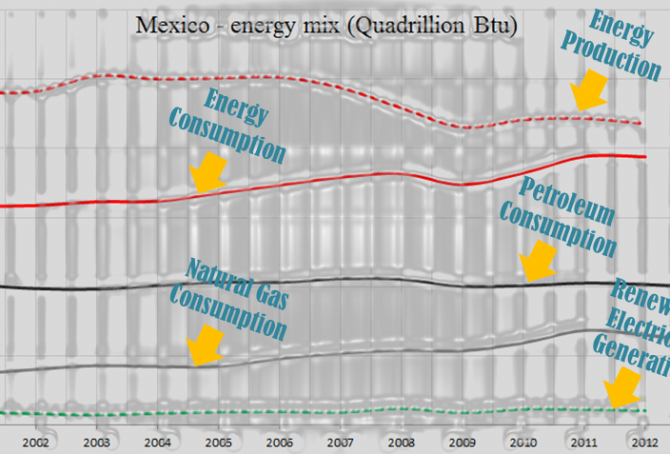
Mexico – the world’s 14th largest CO2 emitter (with an enormous solar potential)
Mexico’s current Climate Debt is $346 per capita and the ‘Ranking’ was 56th among 148 countries by January 2016. The following examines the Mexican CO2 Emissions, Climate Debt, Environmental Performance and GDP(ppp-$), in comparison with the United States, China, Brazil and Germany.
South Africa – the world’s 13th largest CO2 emitter (coal, coal and more coal … and inequality)
South Africa populates 0.7% of the planet’s people and emits 1.3% of the world’s CO2 from fossil fuels (without bunkers) and cement production. The Climate Debt of the 54 million South African’s amounts to $39 billion, or $720 per capita, and the ‘Ranking’ was 42nd among 148 countries by January 2016 – in 2010 the ranking was 45th.
The first diagram shows South Africa’s per capita CO2 Emissions from fossil fuels (without bunker fuels) and cement production in decades in comparison with the world average. CO2 Emissions 2012-2014 are preliminary estimates. The green bars are the Contribution Free Level, determined by the level of CO2 Emissions in the 1990s and a number of continuously updated ‘Indicators’.