Climate performance of Nigeria and neighboring countries
2014
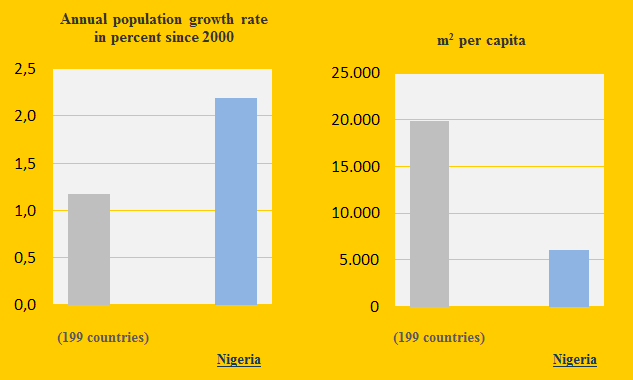
Nigeria and the neighboring countries Benin, Niger, Chad and Cameroon are Contribution Free in ClimatePositions. Nigeria is the world’s 8th most populous country and the annual population growth rate since 2000 is 2.2% or almost twice the world average (see the first diagram). The following examines the indicators of Forest, GDP(ppp), Environmental Performance, Ecological Footprint and CO2 Emissions (carbon dioxide).

Climate change performance and religious beliefs
2014
Nothing suggests that religiosity is a brake on the ongoing climate destruction caused by humans – simply because 84% of the global population is considered more or less religious. The following looks at the possible correlation between Climate Contribution (climate debt) and the world religions: Christianity, Islam, Hinduism and Buddhism – and Other Religions and the Residual Group (including non-religious). All figures must be interpreted with great caution due to uncertainties and dilemmas in the compilation methods.
Climate performance of Asia, the Americas and Europe
2014
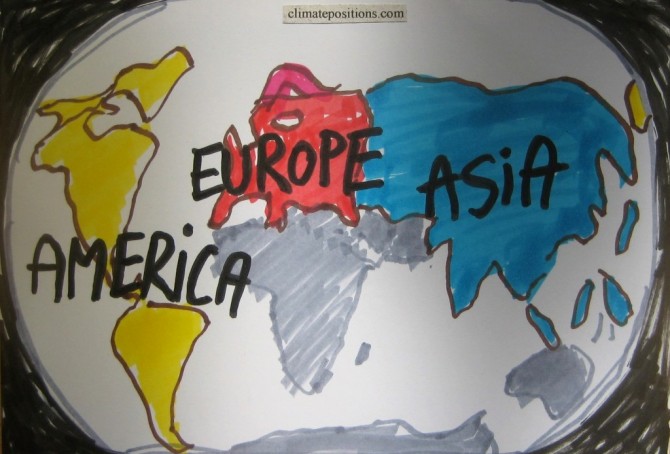
83 countries out of 145 in ClimatePositions are located in Asia, the Americas or Europe. The 83 countries represent 82% of the included population and they are responsible for 88% of the Climate Contribution (climate debt). The 145 countries represent 96% of the global population. The following compares the climate performance of Asia, the Americas and Europe. Also read the posts on ‘Africa‘ and ‘Australia‘.
Climate performance of Mexico and neighboring countries
2014
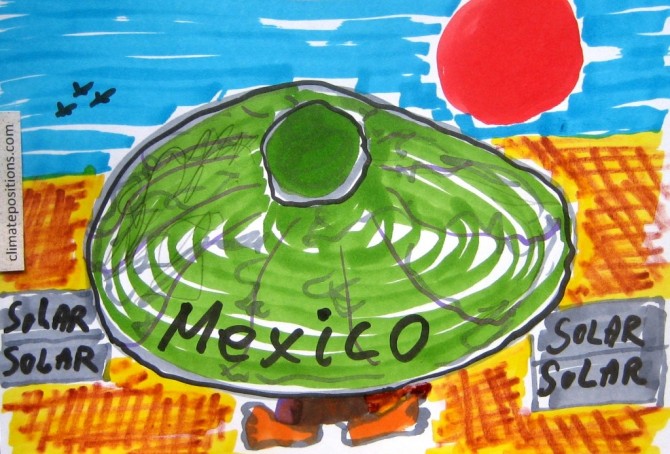
The Mexican CO2 Emissions per capita over time are similar to the world trend (see the diagram) and Mexico is the world’s 12th largest CO2 emitter. Together with the neighboring countries Mexico represent the full range of Climate Contributions (climate debt) worldwide. The following examines the statistics of Mexico in comparison with United States, Guatemala, El Salvador and Honduras.
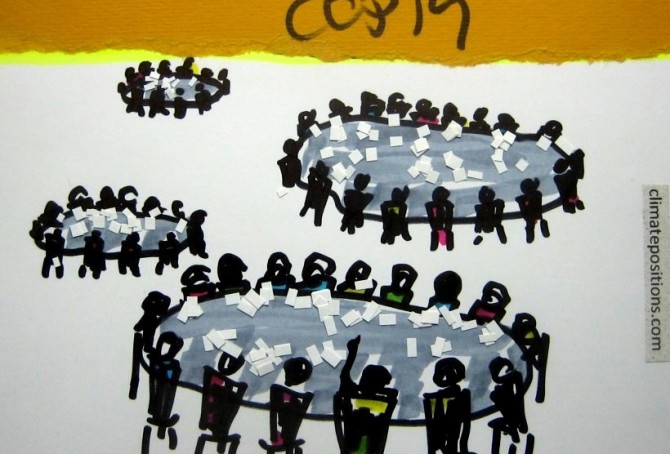
COP19 negotiating positions: China, United States, India, Russia and Japan
2014
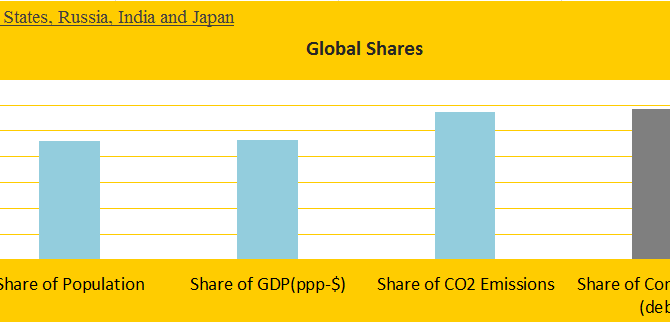
The world’s five largest CO2 emitters – China, United States, Russia, India and Japan – are responsible for 57% of global CO2 Emissions (2006-2010) and 58% of the Climate Contributions (climate debt) in ClimatePositions 2010 (see the front diagram). Add to the group the populous Contribution Free countries Pakistan, Bangladesh, Nigeria, Philippines and Ethiopia and the total share would almost reflect the world average of Population (56%), CO2 Emissions (59%) and Climate Contributions (58%). Leaders of these ten countries sitting around an imaginary negotiating table should be able to create a global climate agreement with binding CO2 reductions and full financing – but it will not happen!
The following depicts the submissions, basic statistics and negotiating positions at COP19 in Warsaw of the five largest CO2 emitters. See the five countries’ Contributions over time ‘here‘, the Contributions as a percentage of GDP ‘here‘ and read about the COP19 country groups ‘here‘.
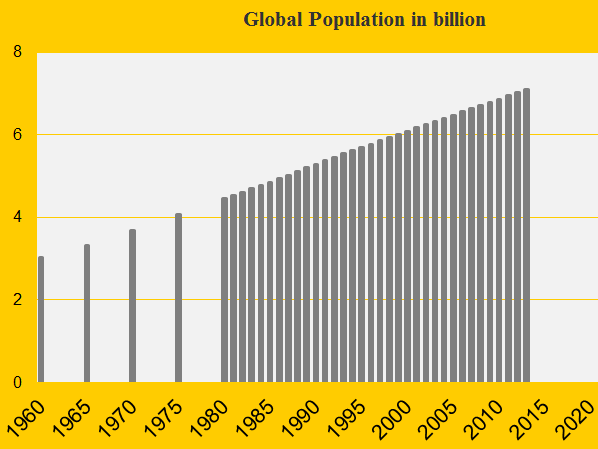
Global Population update 2013
2014
The growing Global Population puts additional pressure on the distressed nature (deforestation, pollution, declining biodiversity, etc.) and increases the total CO2 Emissions. From 2012 to 2013 the population is estimated to have increased from 7.02 to 7.09 billion – an increase of 77 million in one year. See the development 1960-2013 in the diagram.
Country groups and positions at COP19
2013
The negotiation process during COP19 in Warsaw in November 2013 was frustrating and largely fruitless and the following organizations and movements withdrew from the climate conference in protest: ‘Aksyon Klima Pilipinas‘, ‘ActionAid‘, ‘Bolivian Platform on Climate Change‘, ‘Construyendo Puentes‘ (Latin America), ‘Friends of the Earth‘ (Europe), ‘Greenpeace‘, ‘Ibon International‘, ‘International Trade Union Confederation‘, ‘LDC Watch‘, ‘Oxfam International‘, ‘Pan African Climate Justice Alliance‘, ‘Peoples’ Movement on Climate Change‘ (Philippines) and ‘WWF‘.
First step to understanding the inherent conflicts of interest in the COP process would be to examine the nature of the COP country groups (submission groups) – a detailed study of the complex negotiating proces is another matter.
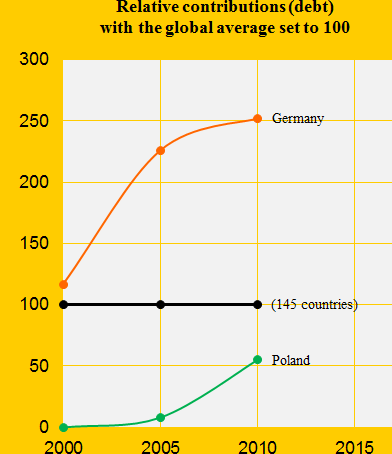
Climate performance: Germany versus Poland
2013
Germany was the 24th worst performing country out of 145 in ClimatePositions 2010 and Poland was the 46th. Five years earlier in 2005 the rankings were respectively 23th and 66th. The diagram shows the performance relatively with the global average set at 100. Germany has performed continuous irresponsible, though slightly less irresponsible in recent years and Poland seems to have given up all the good intentions around 2003. Below we highlight three of the national indicators in the calculations.

Putin’s Russia is deteriorating ecologically
2013
Russia was the world’s third largest CO2 Emitter (carbon dioxide) in 2006-2010 and the authoritarian regime was the 31st worst performing country in ClimatePositions 2010. In 2005 the ranking was 34th and in 2000 43rd. The negative development under Putin is unquestionable.
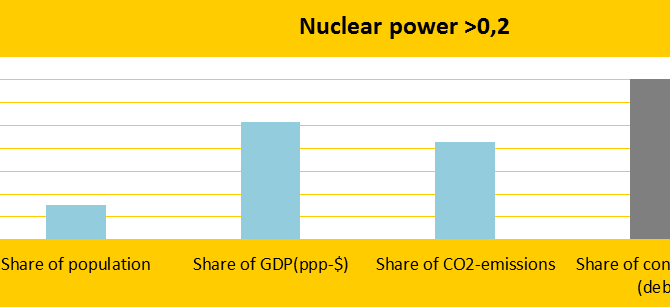
Nuclear Power countries fail on climate responsibility
2013
Seen as a group the top twenty Nuclear Power generating countries (kWh per capita) perform miserable on the climate change challenge. The diagram shows the twenty countries’ total share of the global: 1) Population (15.4%), 2) GDP(ppp-$) (51.5%), 3) CO2 emissions (42.9%) and 4) Contributions (70.6%). The nuclear power counts in calculations of the national Contributions (climate debt) as if the energy was produced with oil.

Five Eyes Alliance is watching you
2013
Australia, Canada, New Zealand, United Kingdom and United States are secretly watching private mails, phone calls etc. worldwide – secretly until Snowden whistled. All five countries’ are defined as Full Democracies but the self-righteous surveillance activities take place in the closed Five Eyes Alliance (see ‘UKUSA Agreement‘ and ‘Echelon‘) with United States (read NSA) as Big Brother.
Guatemala is close to being Contribution Free
2013
Guatemala was the 82nd worst performing country out of 145 full data countries in ClimatePositions 2010. The national Contribution (climate debt) was $4 per capita, but in the latest calculation this amount is cut in half thanks to decreasing CO2 Emissions (carbon dioxide) in 2011 (see the front diagram). In a few months Guatemala may be Contribution Free.
European Union perform poorly
2013
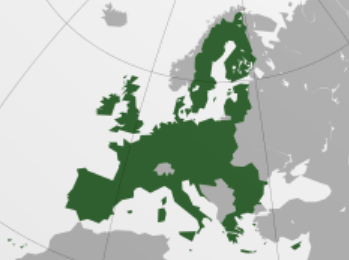
The map (from Wikipedia) shows the very different countries in ‘European Union‘ (EU). As a whole EU perform poorly on the climate challenge and only Romania was Contribution Free in ClimatePositions 2010. Both Netherlands and Belgium are among the top 10 worst performing countries in the world. Se the EU rank at the end and the global ranking in the menu “Contributions/Per Capita US$ Rank”).
India keeps the balance between growth and CO2 emissions
2013
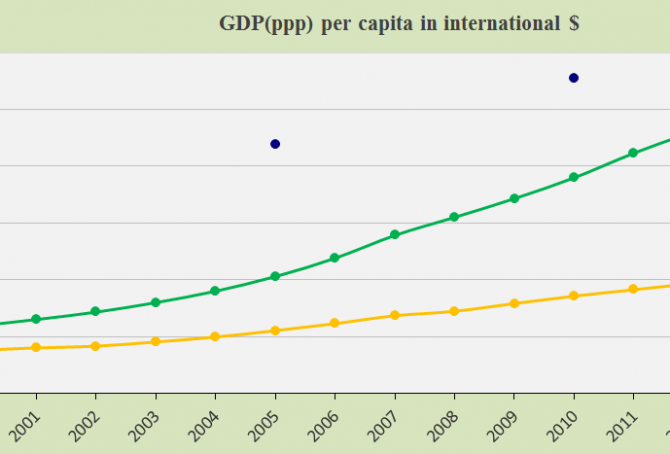
India is the 4th largest CO2 Emitter in the world (in 2006-2010) but Contribution Free due to a balanced increase in economic growth and CO2 Emissions per capita. The front diagram show India’s annual GDP(ppp-$) in comparison with China and the global average (the blue dots). Subject to modifications in the data source. Economic growths in these two countries are causing an increasing proportion of the global CO2 Emissions (28.3% in 2006-2010) and thus climate change.
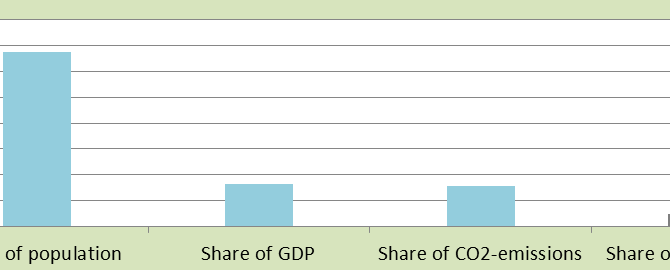
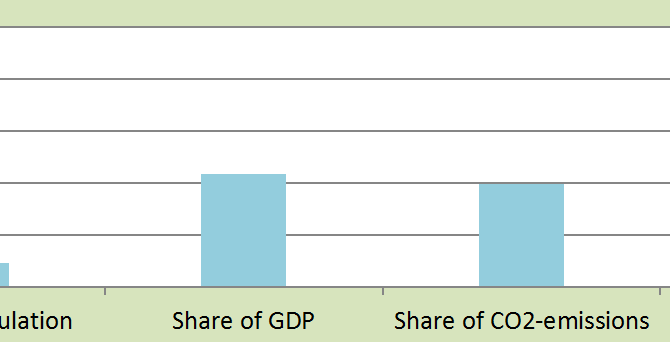
63 countries are Contribution Free in ClimatePositions
2013
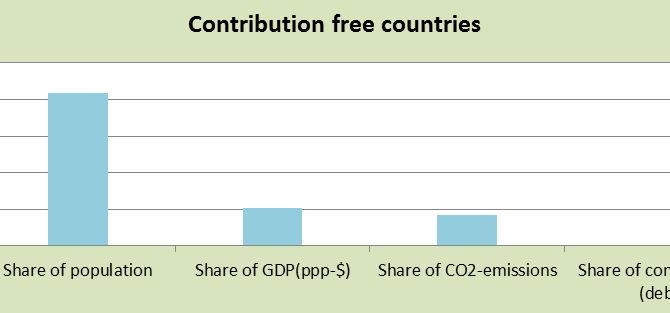
63 of 145 countries with full data are Contribution Free in ClimatePositions 2010. See the list below. The diagram above show these countries’ total share of the global: 1) Population (41.9%), 2) GDP(ppp-$) (10.4%), 3) CO2 Emission (8.4%) and 4) Contribution (0.0%). The total global Climate Contribution (climate debt) was 2,834 billion US$ in 2010 but the world’s most powerful leaders defend their national economic privileges with immature persistence!

Global warming: China in its own CO2 Emission league
2013
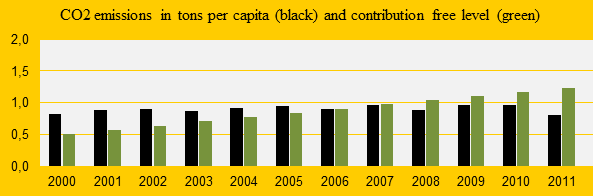
Global warming is caused mainly by human CO2 Emissions.The diagram above shows China’s annual CO2 Emissions (carbon dioxide) in tons per capita 2000-2011 (the black bars). The green bars show the Contribution Free Levels in ClimatePositions. The free level of CO2 Emissions is dependent on various indicators (see the menu “Calculations/Indicators”). China was the 57th worst performing country out of 145, in terms of Contribution (climate debt) per capita. The total national Contribution increased from 26 billion US$ in 2005 to 185 billion in 2010. This explosive negative development is outstanding in the world and China is now by far the largest CO2 Emitter.
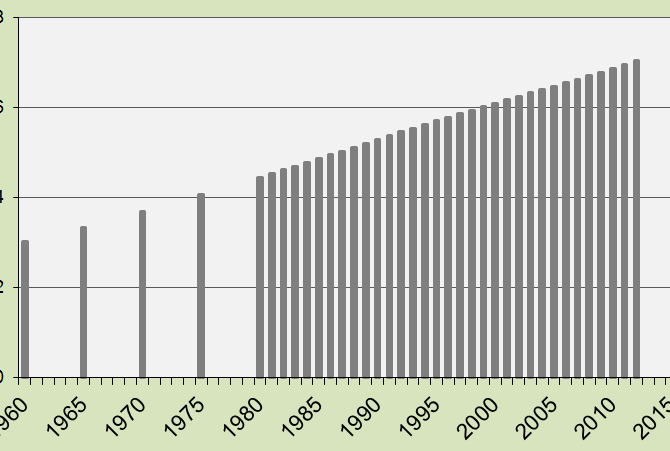
Global Population 1960-2012
2013
The diagram shows the Global Population the last 52 years. In 1960 the Global Population was 3.02 billion and in 2012 it was 7.03 billion. The annually updated figure is included in the latest version of ClimatePositions with impact on the national Climate Contributions (climate debt).
Africa is almost Contribution Free
2013
35 African countries are Contribution Free in ClimatePositions 2010 – 8 countries are not. See the global country list in the menu “Contributions”. The diagram shows Africa’s share of the global: 1) Population 13.52%, 2) GDP(ppp-$) 3.30%, 3) CO2 Emissions (2006-2010) 3.15%, and 4) Climate Contributions 0.95%. Africa is obviously not responsible for the climate change.
United States’ giant share of the global Climate Contributions (climate debt)
2013
United States was the 7th worst performing country out of 145 in ClimatePositions 2010 (see the menu Contributions/ Per Capita US$ Rank). What make United States the major climate problem on a global scale however, is the country’s size, wealth and failed performance.