Russia: Per Capita Climate Debt $2,058 (Ranked 30) – Fossil CO2 Emissions
In 2024, Russia is responsible for 3.78% of the Global Climate Debt accumulated since 2000. Below are some key figures in the calculations.


Turkmenistan – per capita Fossil CO2 Emissions and Climate Debt
2020
Turkmenistan’s current Climate Breakdown Pricing amounts to $12.37 per tons Fossil CO2 emitted since 2000. The Climate Debt grew from $1,300 per capita in 2015 to $2,799 in 2020. Updated Rankings of 165 countries are available in the menu “Climate Debt”.
The following diagrams expose the trends of Fossil CO2 Emissions, Climate Debt, GDP(ppp-$) and Ecological Footprint without carbon.

Oman – per capita Fossil CO2 Emissions and Climate Debt
2020
Oman’s current Climate Breakdown Pricing amounts to $44.28 per tons Fossil CO2 emitted since 2000. The Climate Debt grew from $9,261 per capita in 2015 to $13,602 in 2020. Updated Rankings of 165 countries are available in the menu “Climate Debt”.
The following diagrams expose the trends of Fossil CO2 Emissions, Climate Debt, GDP(ppp-$), Population growth and Ecological Footprint without carbon.
Uzbekistan – per capita Fossil CO2 Emissions and Climate Debt
2020
Uzbekistan’s current Climate Breakdown Pricing amounts to $1.20 per tons Fossil CO2 emitted since 2000. The Climate Debt grew from $43 per capita in 2015 to $93 in 2020. Updated Rankings of 165 countries are available in the menu “Climate Debt”.
The following diagrams expose the trends of Fossil CO2 Emissions, Climate Debt, GDP(ppp-$) and Environmental Performance.
Vietnam – per capita Fossil CO2 Emissions and Climate Debt
2020
Vietnam’s current Climate Breakdown Pricing amounts to $0.88 per tons Fossil CO2 emitted since 2000. The Climate Debt grew from $6 per capita in 2015 to $26 in 2020. Updated Rankings of 165 countries are available in the menu “Climate Debt”.
The following diagrams expose the trends of Fossil CO2 Emissions, Climate Debt, GDP(ppp-$), Forest Cover, Primary Forest and Ecological Footprint without carbon.

Thailand – per capita Fossil CO2 Emissions and Climate Debt
2020
Thailand’s current Climate Breakdown Pricing amounts to $7.92 per tons Fossil CO2 emitted since 2000. The Climate Debt grew from $265 per capita in 2015 to $535 in 2020. Updated Rankings of 165 countries are available in the menu “Climate Debt”.
The following diagrams expose the trends of Fossil CO2 Emissions, Climate Debt, GDP(ppp-$) and Ecological Footprint without carbon.
Kazakhstan – per capita Fossil CO2 Emissions and Climate Debt
2020
Kazakhstan’s current Climate Breakdown Pricing amounts to $16.18 per tons Fossil CO2 emitted since 2000. The Climate Debt grew from $2,041 per capita in 2015 to $4,025 in 2020. Updated Rankings of 165 countries are available in the menu “Climate Debt”.
The following diagrams expose the trends of Fossil CO2 Emissions, Climate Debt, GDP(ppp-$) and Ecological Footprint without carbon.
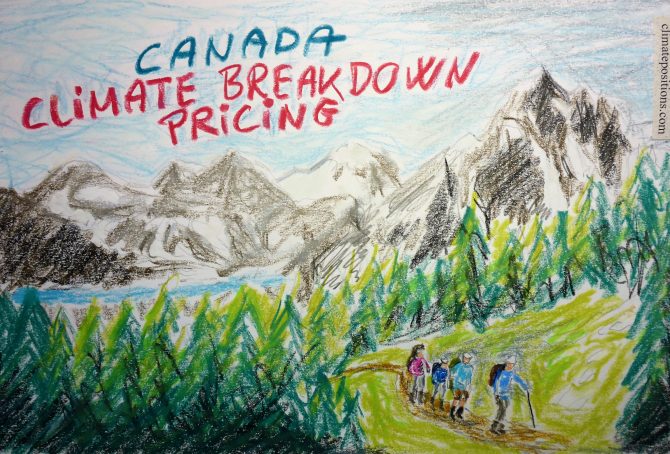
Canada – per capita Fossil CO2 Emissions and Climate Debt
2020
Canada’s current Climate Breakdown Pricing amounts to $29.84 per tons Fossil CO2 emitted since 2000. The Climate Debt grew from $6,452 per capita in 2015 to $9,685 in 2020. Updated Rankings of 165 countries are available in the menu “Climate Debt”.
The following diagrams expose the trends of Fossil CO2 Emissions, Climate Debt, GDP(ppp-$), Nuclear Power and Ecological Footprint without carbon.

Iran – per capita Fossil CO2 Emissions and Climate Debt
2020
Iran’s current Climate Breakdown Pricing amounts to $15.69 per tons Fossil CO2 emitted since 2000. The Climate Debt grew from $1,095 per capita in 2015 to $2,153 in 2020. Updated Rankings of 165 countries are available in the menu “Climate Debt”.
The following diagrams expose the trends of Fossil CO2 Emissions, Climate Debt, GDP(ppp-$), Ecological Footprint (without carbon) and Nuclear Power.

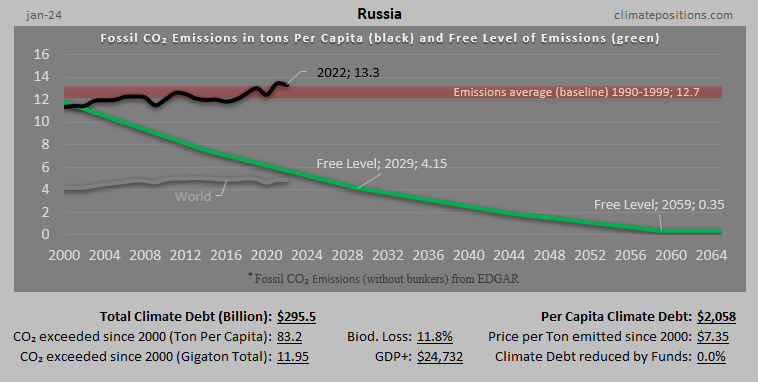
Russia – per capita Fossil CO2 Emissions and Climate Debt
2020
Russia’s current Climate Breakdown Pricing amounts to $12.16 per tons Fossil CO2 emitted since 2000. The Climate Debt grew from $1,346 per capita in 2015 to $2,676 in 2020. Updated Rankings of 165 countries are available in the menu “Climate Debt”.
The following diagrams expose the trends of Fossil CO2 Emissions, Climate Debt, GDP(ppp-$) and Ecological Footprint without carbon.
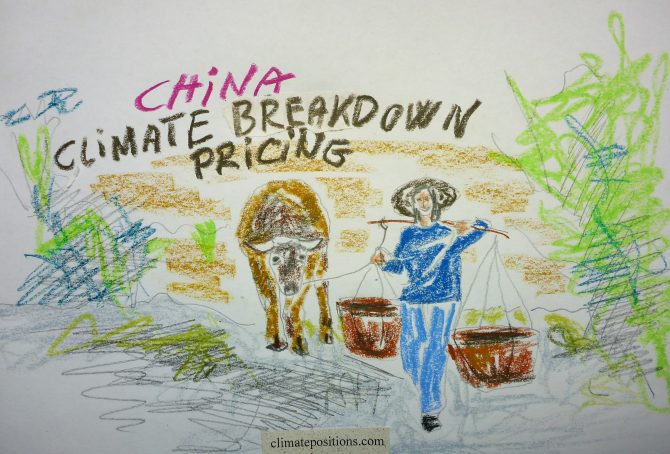
China – per capita Fossil CO2 Emissions and Climate Debt
2020
China’s current Climate Breakdown Pricing amounts to $12.33 per tons Fossil CO2 emitted since 2000. The Climate Debt grew from $593 per capita in 2015 to $1,395 in 2020. Updated Rankings of 165 countries are available in the menu “Climate Debt”.
The following diagrams expose the trends of Fossil CO2 Emissions, Climate Debt, GDP(ppp-$) and Ecological Footprint without carbon.
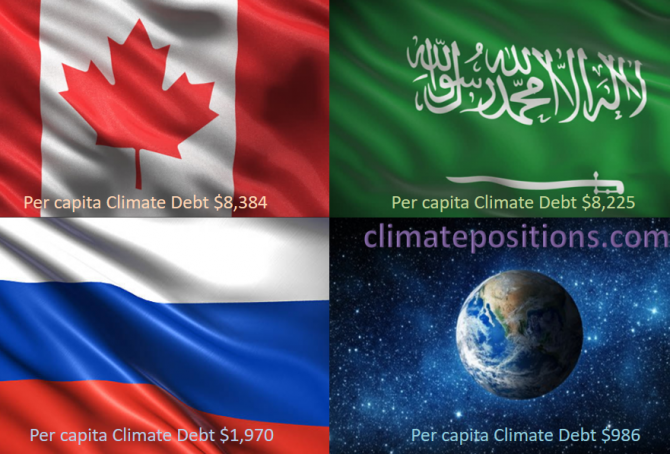
Share of global Climate Debt rank 4th, 5th and 6th: Canada, Russia and Saudi Arabia (combined responsible for 12% of Climate Debt and 8% of Fossil CO2 Emissions 2016)
2017
The diagram below shows ‘Share of global Climate Debt‘ in 2010, 2015 and 2017 of Canada, Russia and Saudi Arabia (ranked 4th, 5th and 6th). Canada’s share is decreasing, while Russia’s and Saudi Arabia’s are increasing. Global Climate Debt accumulated since 2000 is $7.2 Trillion.
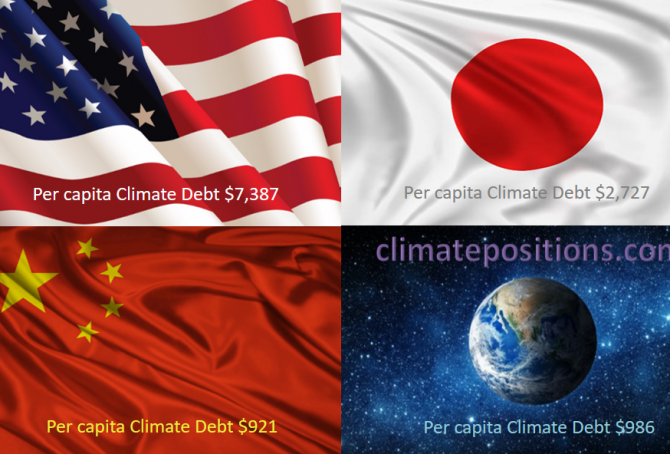
Share of global Climate Debt rank 1st, 2nd and 3rd: The United States, China and Japan (combined responsible for 55% of Climate Debt and 47% of Fossil CO2 Emissions 2016)
2017
The diagram below shows ‘Share of global Climate Debt‘ in 2010, 2015 and 2017 of the United States, Japan and China (ranked 1st, 2nd and 3rd). The shares of the United States and Japan are decreasing at slower rates lately, whereas China’s is increasing fast. Global Climate Debt accumulated since 2000 is $7.2 Trillion.

Global Carbon Project (CDIAC), located in the United States, stops publishing carbon emissions data by country – will be replaced by EDGAR in ClimatePositions
2017
The Carbon Dioxide Information Analysis Center (CDIAC), located at the U.S. Department of Energy’s (DOE) Oak Ridge National Laboratory, has published annual Carbon Emissions from Fossil Fuels and cement production by country since 1959 (‘Global Carbon Project‘), but now this continuous time series has come to an end and 2015 will be the last data-year (as it seems).
Since carbon emissions data from CDIAC (Global Carbon Project) is the core ‘Indicator‘ in ClimatePositions’ calculation of Climate Debt, carbon emissions data will be replaced with nearly similar data from ‘EDGAR‘ (‘European Commission‘ / ‘Climate Action‘), retroactively since 1990, in connection with the coming updates [done 16-08-2017].
The following describes the differences between CO2 Emissions data from Global Carbon Project (CDIAC) and EDGAR (sourced: European Commission, Joint Research Centre (JRC)/Netherlands Environmental Assessment Agency (PBL). Emission Database for Global Atmospheric Research (EDGAR)), and the consequences in terms of Climate Debt in ClimatePositions – illustrated with a range of country examples. Note that other sources, such as ‘IEA‘, ‘EIA‘ and ‘BP‘, provides CO2 Emissions data-sets different from the ones of CDIAC and EDGAR.
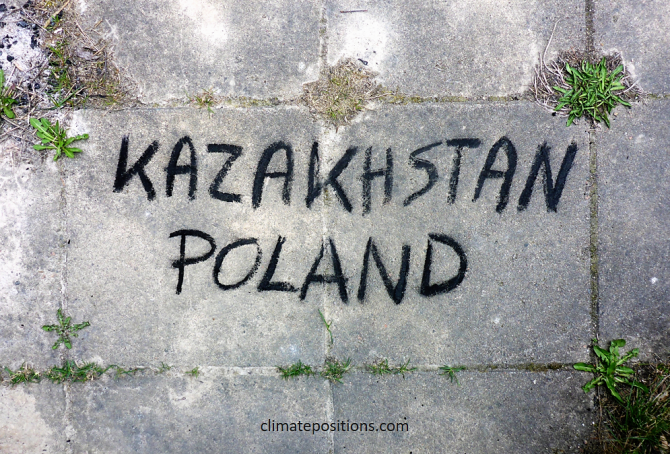
Climate change performance: Kazakhstan vs. Poland
2017
In 2015 Kazakhstan and Poland were the world’s 2nd and 4th largest per capita coal producers. No wonder, the two countries, inhabited by 0.76% of the global population, emitted as much as 1.58% of the CO2 from Fossil Fuels (without bunkers) and cement.
The diagrams below show the per capita CO2 Emissions from Fossil Fuels (without bunkers) and cement, annually since 2000. The green bars show the Free Emission Level¹ – the exceedance is the basis for calculating the national Climate Debt.
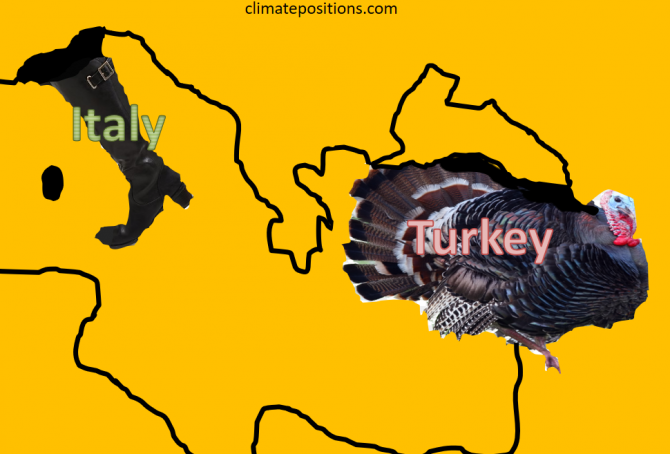
Climate change performance: Turkey vs. Italy
2017
Turkey and Italy are the world’s 17th and 18th largest emitters of CO2 from Fossil Fuels and cement. Combined, the two countries were responsible for 2.0% of world CO2 Emissions in 2015. The following examines the ‘Indicators‘ of CO2 Emissions, GDP(ppp-$) and Forest Cover (including Primary Forest).
The diagrams below show the per capita CO2 Emissions from Fossil Fuel (without bunkers) and cement, since 2000. The green bars show the Free Emission Level¹ – the exceedance is the basis for calculating the national Climate Debt.
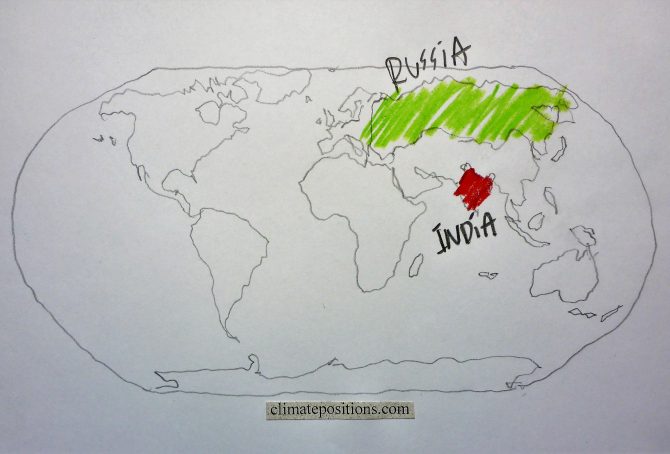
Climate change performance: India vs. Russia (CO2 Emissions from coal)
2016
The diagrams below show the per capita CO2 Emissions from Fossil Fuel (without bunkers) and cement, annually since 2000, of India and Russia. The green bars show the Free Emission Level¹ – the exceedance is the basis for calculating the national Climate Debt. The world’s 3rd and 4th largest CO2-emitters were responsible for 6.5% (India) and 4.9% (Russia) of global emissions in 2015. India’s per capita emissions were 1.7 tons in 2015 (preliminary), which was 4.0% above the 2014-level.

Climate change performance: China vs. the United States (wealth inequality)
2016
The diagrams below show the per capita CO2 Emissions from Fossil Fuel (without bunkers) and cement, annually since 2000, of China and the United States. The green bars show the Free Emission Level¹ – the exceedance is the basis for calculating the national Climate Debt. The world’s two largest CO2-emitters were responsible for 29% (China) and 15% of global emissions in 2015.
Apparently, China’s per capita emissions have peaked, while the moderate reduction-rate 2006-2012 of the United States, has flattened out.

Final Update 2015: new rankings of 159 countries’ Climate Debt, accumulated since 2000
2016
Every five year, since 2005, Final Updates of national Climate Debts are completed in ClimatePositions and 2015-updates¹ are now available in ‘Calculation (Excel)‘. New rankings in six categories, of 159 countries, are available in the menu “Climate Debt”. In the coming months, the climate change performances of selected countries will be analyzed in articles, starting with the United States and China.
The following illustrate Final Update 2015 in two ways: 1) The change of Climate Debt as percentage of the global Climate Debt, annually since 2000, of the 10 largest CO2 emitters, and 2) Key-figures of the United States.
The table below of the 10 largest CO2 emitters (representing 70% of the global emissions in 2015) shows the national shares of the global Climate Debt in 2015 and 2010. China, Russia and Saudi Arabia stand out with extremely harmful developments, while the United States still has by far the largest Climate Debt. See the latest ‘Ranking’ of 159 countries.