Final Update 2015: new rankings of 159 countries’ Climate Debt, accumulated since 2000
2016
Every five year, since 2005, Final Updates of national Climate Debts are completed in ClimatePositions and 2015-updates¹ are now available in ‘Calculation (Excel)‘. New rankings in six categories, of 159 countries, are available in the menu “Climate Debt”. In the coming months, the climate change performances of selected countries will be analyzed in articles, starting with the United States and China.
The following illustrate Final Update 2015 in two ways: 1) The change of Climate Debt as percentage of the global Climate Debt, annually since 2000, of the 10 largest CO2 emitters, and 2) Key-figures of the United States.
The table below of the 10 largest CO2 emitters (representing 70% of the global emissions in 2015) shows the national shares of the global Climate Debt in 2015 and 2010. China, Russia and Saudi Arabia stand out with extremely harmful developments, while the United States still has by far the largest Climate Debt. See the latest ‘Ranking’ of 159 countries.
Update: GDP(ppp-$) 2015
2016
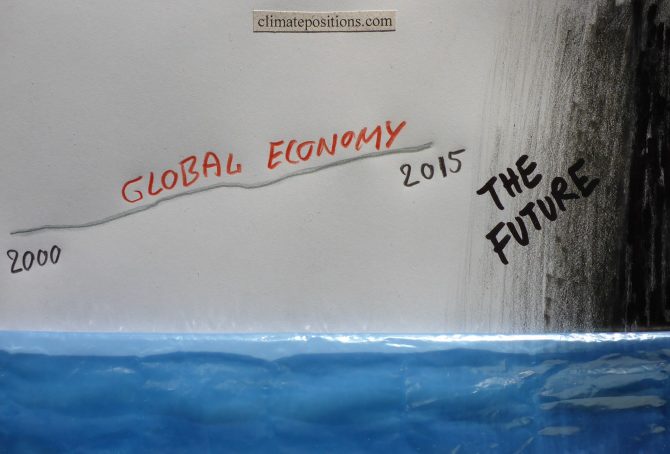
2015-updates of national per capita GDP(ppp-$) from ‘World Bank’ is now available in ‘Calculation (Excel)’. The world’s average per capita GDP(ppp-$) grew from $15,065 in 2014 to $15,470 in 2015 (2.7% growth). In the midst of an unprecedented man-made climate catastrophe and the ‘Sixth mass extinction’ in progress, the human economy keeps growing.
The diagram below shows the development in per capita GDP(ppp-$) 2000-2015 of the world’s five largest emitters of CO2 from Fossil Fuel and cement: China (27.0% of the global emissions), the United States (14.7%), India (7.2%), Russia (4.9%) and Japan (3.4%), in comparison with the world’s average.

Climate Debt: Australia ranks 8th (performance of the twenty largest coal producers)
2016
Australia covers around 5.7% of planet’s land area and populates 0.3% of its people. The Climate Debt of the 24 million Australian’s amounts to $132 billion, or $5,613 per capita, which ‘Ranks’ Australia 8th among 148 countries – in 2010 the ranking was 6th. Australia is the world’s 5th largest coal producer and the 2nd largest per capita CO2 emitter from coal combustion … and coal is the most efficient climate destroyer. The table below reveals some key figures of the world’s twenty largest coal producers. Subsequently, Australia’s climate change performance is examined in comparison with four other top-five countries on CO2 Emissions from coal combustion (per capita): Kazakhstan (ranked 1), South Africa (3), the United States (4) and Poland (5).
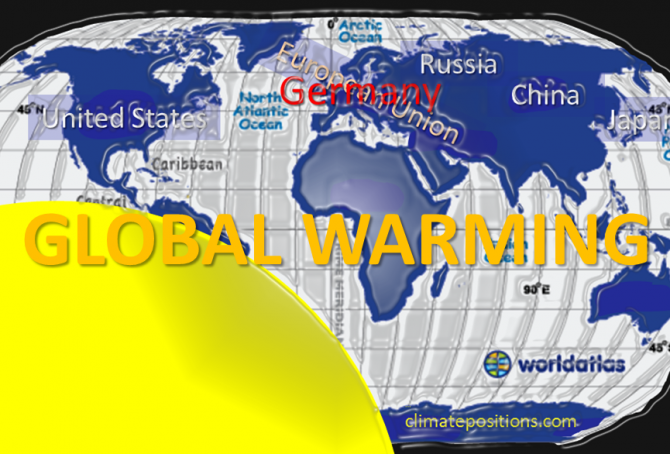
Climate Debt of Germany & the European Union … versus the United States, China, Japan and Russia
The Climate Debt of ‘the 28 member states of the European Union (EU-28)’, China, the United States, Japan and Russia, combined, amounts to nearly 70% of the world’s total Climate Debt of around $5,700 billion. The following compares 1) EU-28 with the four countries, 2) Germany with EU-28, and 3) Germany with the four other countries.
The table below shows the per capita Climate Debt, the total Climate Debt and the share of the global Climate Debt, of EU-28¹, China, the United States, Japan and Russia. Rankings of 148 countries by 2010 and January 2016 (preliminary estimates) are available in the menu “Climate Debt”.
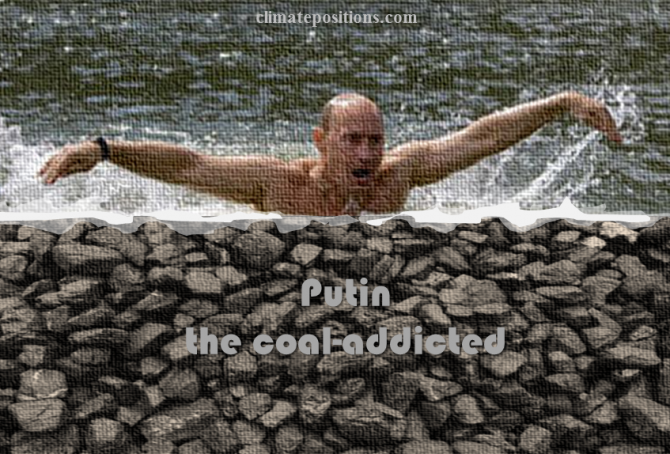
Russia’s Climate Debt keeps accelerating (however, the Environmental Performance has improved)
The accumulated Russian per capita Climate Debt is ranked 25th among 148 countries. Back in 2010 the ranking was 33rd. The reckless development also shows in Russia’s share of the global Climate Debt: 3.9% by January 2016 compared to 3.0% in 2010. Rankings are available in the menu “Climate Debt”. The following examines the development of CO2 Emissions, Environmental Performance, GDP(ppp-$) and Climate Debt, in comparison with some of ‘Russia’s largest trading partners’.
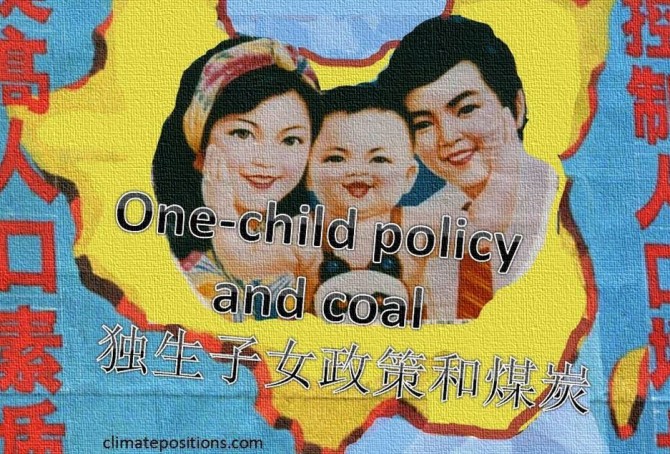
China’s share of the global Climate Debt is growing fast
In 2010 China’s share of the global Climate Debt was 7.4% and by January 2016 it has grown dramatically to 13.3% (see the ‘ranking’). Since 2000 the Chinese share of the growing global CO2 Emissions has grown from 13.7% to about 29.0% (preliminary emissions by 2014). Luckily, the populous superpower has committed itself to pursue “efforts to limit the temperature increase to 1.5 °C” … according to the COP21 Paris Agreement. The following examines the development of CO2 Emissions, Environmental Performance, GDP(ppp-$), Climate Debt and Population (with respect to the one-child policy).

Update 2015: Warmest year on record … mother Earth with fever
The year 2015 was the warmest on Earth since measurements began in 1880. Both global Air Temperature and Ocean Temperature was the warmest on record. See the development in Air Temperature between 1960 and 2015 in the diagram below; the average temperature rise 1880-1937 is set at 0°C and 2015 was 1.64°C warmer.

Preliminary Carbon Dioxide Emissions 2014, by country
2015
’The Global Carbon Project’ at Carbon Dioxide Information Analysis Center (CDIAC) has published preliminary CO2 Emissions from fossil fuels and cement for 2014, for more than 200 countries. The data is being used in a preliminary calculation of accumulated Climate Debt in ClimatePositions¹. The table below shows the estimated per capita emissions plus the updated Climate Debts, of the twenty largest total emitters (responsible for 77% of the global emissions in 2014).
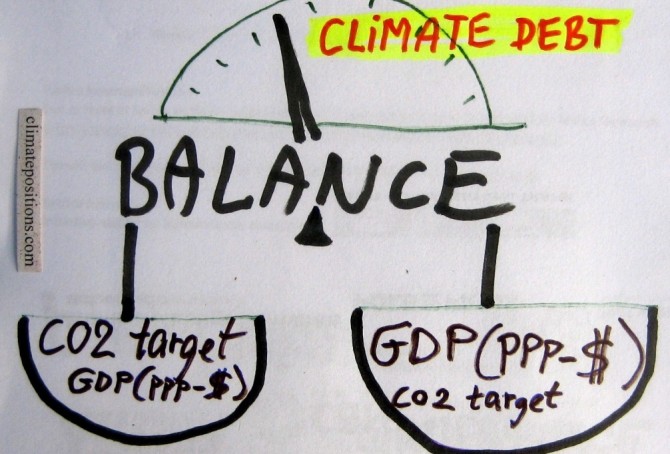
Analyses of the global CO2 target and GDP(ppp-$)
2015
The calculation of Climate Debt in ClimatePositions is based on a balance between many ‘indicators’ and a common global per capita CO2 target. To illustrate the nature of this balance twelve countries are analyzed in this article in terms of the indicator of GDP(ppp-$) and the global CO2 target. The 12-Countries Group represents 38% of the global population, 65% of the global CO2 Emissions from fossil fuels and around 70% of the global Climate Debt.
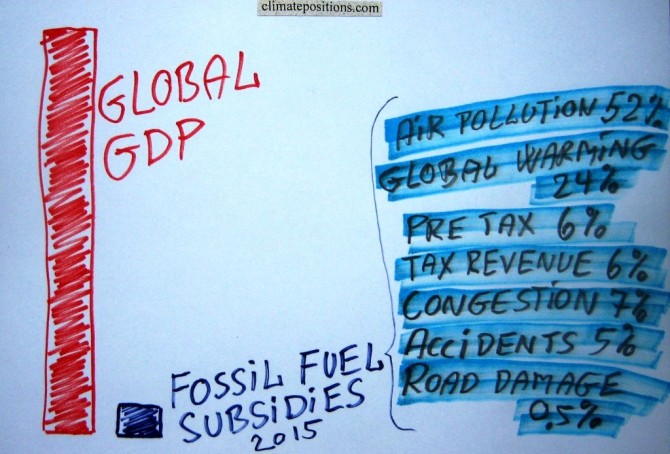
Fossil fuel subsidies: $5.3 trillion in 2015 (IMF survey)
2015
Estimates from the ‘International Monetary Fund’ (IMF) show that fossil fuel subsidies of 155 countries representing 98% of the world’s population, amounted $4.2 trillion (5.8% of global GDP) in 2011 and $4.9 trillion (6.5% of global GDP) in 2013. Projections for 2015 suggest $5.3 trillion (6.5% of global GDP). This huge amount of subsidies is of cause plain stupid.
For comparison, the total ‘Climate Debt of 147 countries‘ in ClimatePositions, accumulated between 2000 and 2013, amounted $5.2 trillion. Roughly speaking, one year of global subsidies equals the total accumulated Climate Debt. Note that global climate change funding is only around $0.14 trillion.

How green are the fossil fuel producers? (Correlation between fossil fuel production, CO2 Emissions, GDP and Climate Debt)
2015
Greenhouse gas emissions from burning of fossil fuels (oil, natural gas and coal), is the main cause of manmade climate change. Comparable energy potentials of oil, natural gas and coal is defined as “tons oil equivalents”, meaning that the energy released from a given quantity of natural gas or coal is equivalent to one ton of oil. This way the total production of fossil fuels can be expressed in a single figure (not to be confused with market value, global warming potential or general usefulness) The world’s production in million tons oil equivalent, was in 2013: oil (4,130), natural gas (3,041 and coal (3,881).
The table below ranks the twenty countries with the largest per capita fossil fuel production (oil equivalents). Total production data of 68 countries is from ‘BPs Statistical Review of World Energy 2014’ (pdf, 48 pages).
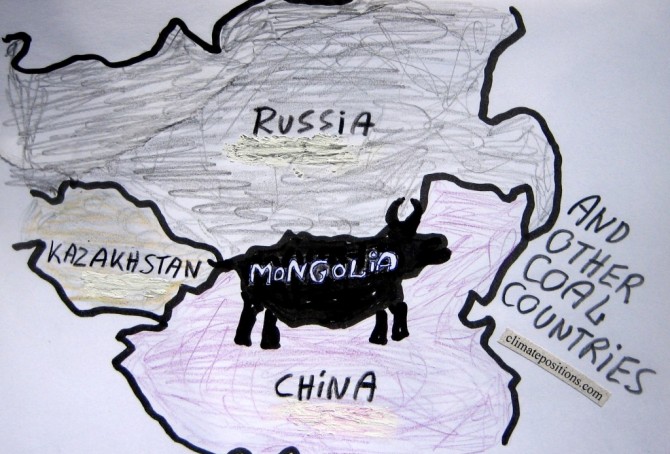
Mongolia and other coal producing countries (the thirteen most coal-dependent countries)
2015
Mongolia is the world’s second largest coal producer per capita (Btu, 2011) and coal is the world’s no. 1 carbon dioxide emitter. However, the flawed democracy (surrounded by the giant authoritarian regimes of China and Russia) is Contribution Free (no Climate Debt) in ClimatePositions – how is this possible?
The table below ranks the thirteen largest per capita coal producers (Btu, 2011), with the world average set at 1.0. The Mongolian coal production is almost ten times larger than the world average. For comparison, the table shows per capita values of CO2 Emissions (from fossil fuels), GDP(ppp-$) and Climate Debt. More comments below the table.
Greenhouse gas submissions of the United States, the European Union and Russia, by March 2015
Submissions of 33 countries (including ‘EU-28‘) with “intended nationally determined” greenhouse gas reductions have so far reached the United Nation’s ‘COP process website’. The greenhouse gas reductions proclaimed in the submissions include, besides carbon dioxide (CO2), gases such as methane, nitrous oxide, perfluorocarbons, hydrofluorocarbons, sulphur hexafluoride and nitrogen trifluoride – and changes in land-use and forestry. This mixture of different sources together with different parties, base years and target years, make the intended greenhouse gas reductions both muddy and incomparable between nations. None of the submissions so far include future financing to developing countries.
The following compares the submissions of the United States, the European Union (EU-28) and Russia – combined these 30 countries were responsible of 34% of the global carbon dioxide emissions from fossil fuels in 2012.
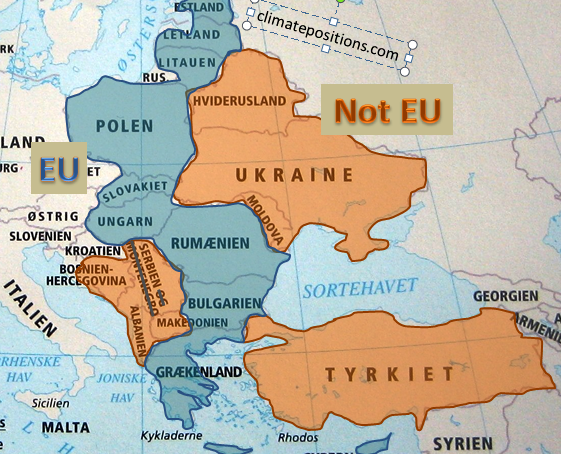
European Union “east” compared to bordering countries
2015
The ‘European Union’ (EU) is an economic and political partnership between ‘28 countries’. Around 7% of the global population lives in EU and they emit around 12% of the global CO2 from fossil fuels and are responsible of 13% of the Climate Debt in ClimatePositions. The following examines a group of 10 countries in eastern EU which joined the union between 1981 and 2007 in comparison with 8 bordering countries.
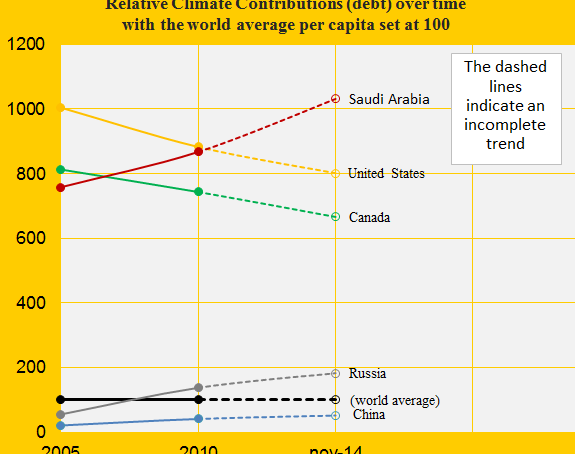
Climate change performance of Saudi Arabia and Canada
2014
The first diagram shows the relative Climate Contribution (debt) per capita of Saudi Arabia, Canada, China, the United States and Russia, with the world’s average set at 100. Around 2007 Saudi Arabia passed Canada and since then, the gap has grown considerably. Today, the climate debt per capita accumulated since 2000 are respectively $7,936 and $5,128 (see the ‘ranking’).
The Climate Contributions are calculated by using eleven ‘indicators’ of which national CO2 Emissions from the burning of fossil fuels is the principal. Extraction and export of fossil fuels is not one of the indicators which Saudi Arabia should be thankful for – wealth measured as ‘GDP(ppp-$)‘, however, is an indicator.
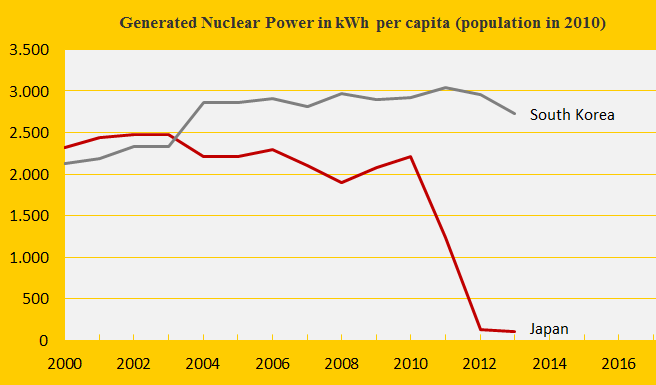
Climate change performance: Japan vs. South Korea
2014
The first diagram shows the nuclear power generation per capita of the two countries. The Fukushima nuclear disaster in Japan in 2011 has caused a remarkable shutdown of generation – while CO2 Emissions from the burning of petroleum, coal and natural gas have increased (from 2011 to 2012 respectively by 6%, 5% and 3%) to close the energy gap. Nuclear power generation produce dangerous radioactive waste to deal with for thousands of future generations (10,000 to 250,000 years) and in ClimatePositions nuclear power is not accepted as a national CO2 Emission reduction instrument (read ‘more’). The following analyzes the indicator trends of Japan and South Korea.
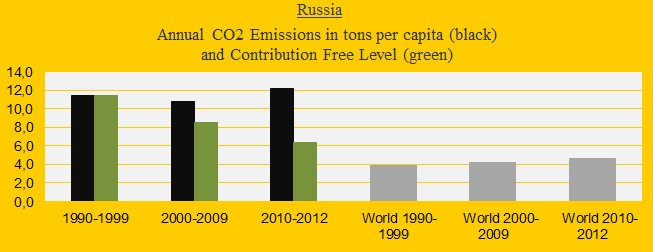
Climate change performance of Russia (compared to other BRICS countries)
2014
Russia was the 4th largest carbon dioxide emitter in 2012 with 5.6% of the global emissions, after China (26.9%), the United States (16.6%) and India (5.8%). The first diagram shows Russia’s CO2 Emissions per capita in decades in comparison with the world average (the green bars are the Contribution Free Level). After the COP summit in 2009 (at which China and the United States rejected a globally binding reduction agreement) the Russian emissions have increased dramatically and today the Russian Climate Contribution (climate debt) is $1,410 per capita (ranked 28th), compared to $627 in 2010 (ranked 32nd). See the ‘ranking’. The following analyzes the development in Putin’s Russia since 2000 in comparison with the other ‘BRICS‘ countries China, India, Brazil and South Africa – jointly emitting 41% of global carbon dioxide in 2012.
New ranking 2014 – update of 147 countries’ climate debt
2014
The data in ClimatePositions are updated consecutively and since the data year 2010 the eleven ‘indicators’ have all been updated.
The new rankings of 147 countries are now available in the menu “Contributions” (with six categories).
All country data and diagrams are available in the menu ‘Calculations (Excel)’. In the coming months selected countries will be analyzed in articles. The following illustrates the latest updates in two ways: 1) The change of climate debt as a percentage of the global climate debt of the twelve largest CO2 emitters, and 2) The key-figures of the United Kingdom.
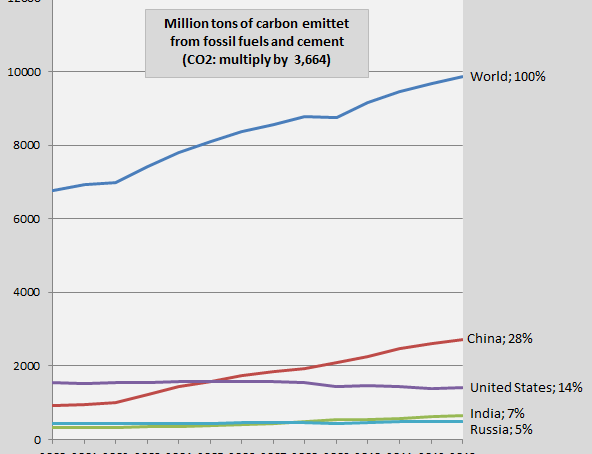
Carbon dioxide emissions 2013 – China, the United States, India and Russia
2014
The diagram shows the global development of carbon dioxide emissions from fossil fuels and cement 2000-2013 (measured by pure carbon) and of the four largest emitters China, the United States, India and Russia. The 2013-emissions are preliminary with an enlarged uncertainty of ±5%. The national shares of the global emissions in 2013 are shown in percent to the right. The four countries accounted for 54% of the global emissions in 2013 (48% in 2000). The preliminary carbon dioxide emissions in 2013 of 216 countries is available ‘here’¹. Global emissions are on track of the worst out of four scenarios, likely heading for 3.2-5.4°C increase in temperature by 2100, since pre-industrial era (see the diagram below from ‘Global Carbon Project’, and ‘presentation (pdf)‘.
Forest Cover, Primary Forests and climate debt
2014
The national data of Forest Cover and Primary Forest are both included in the calculations of Climate Contributions (debt) in ClimatePositions. Primary Forest was included as an indicator in the worksheet in August 2014. The following describes selected findings on forests from FAO’s ‘The Global Forest Resources Assessments (FRA), 2010’ (main report, pdf, 378 pages). The Assessment is based on two primary sources of data: 1) ‘country reports’ and 2) remote sensing conducted by FAO and partners.