Canada – per capita Fossil CO2 Emissions and Climate Debt
2020
Canada’s current Climate Breakdown Pricing amounts to $29.84 per tons Fossil CO2 emitted since 2000. The Climate Debt grew from $6,452 per capita in 2015 to $9,685 in 2020. Updated Rankings of 165 countries are available in the menu “Climate Debt”.
The following diagrams expose the trends of Fossil CO2 Emissions, Climate Debt, GDP(ppp-$), Nuclear Power and Ecological Footprint without carbon.
Saudi Arabia – per capita Fossil CO2 Emissions and Climate Debt
2020
Saudi Arabia’s current Climate Breakdown Pricing amounts to $45.11 per tons Fossil CO2 emitted since 2000. The Climate Debt grew from $5,683 per capita in 2015 to $13,955 in 2020. Updated Rankings of 165 countries are available in the menu “Climate Debt”.
The following diagrams expose the trends of Fossil CO2 Emissions, Climate Debt, GDP(ppp-$) and Ecological Footprint without carbon.

South Korea – per capita Fossil CO2 Emissions and Climate Debt
2020
South Korea’s current Climate Breakdown Pricing amounts to $33.53 per tons Fossil CO2 emitted since 2000. The Climate Debt grew from $3,608 per capita in 2015 to $7,397 in 2020. Updated Rankings of 165 countries are available in the menu “Climate Debt”.
The following diagrams expose the trends of Fossil CO2 Emissions, Climate Debt, GDP(ppp-$) and Ecological Footprint without carbon.
Iran – per capita Fossil CO2 Emissions and Climate Debt
2020
Iran’s current Climate Breakdown Pricing amounts to $15.69 per tons Fossil CO2 emitted since 2000. The Climate Debt grew from $1,095 per capita in 2015 to $2,153 in 2020. Updated Rankings of 165 countries are available in the menu “Climate Debt”.
The following diagrams expose the trends of Fossil CO2 Emissions, Climate Debt, GDP(ppp-$), Ecological Footprint (without carbon) and Nuclear Power.
Germany – per capita Fossil CO2 Emissions and Climate Debt
2020
Germany’s current Climate Breakdown Pricing amounts to $18.68 per tons Fossil CO2 emitted since 2000. The Climate Debt grew from $1,562 per capita in 2015 to $3,536 in 2020. Updated Rankings of 165 countries are available in the menu “Climate Debt”.
The following diagrams expose the trends of Fossil CO2 Emissions, Climate Debt, GDP(ppp-$), Nuclear Power and Ecological Footprint without carbon.
Japan – per capita Fossil CO2 Emissions and Climate Debt
2020
Japan’s current Climate Breakdown Pricing amounts to $20.35 per tons Fossil CO2 emitted since 2000. The Climate Debt grew from $1,952 per capita in 2015 to $3,734 in 2020. Updated Rankings of 165 countries are available in the menu “Climate Debt”.
The following diagrams expose the trends of Fossil CO2 Emissions, Climate Debt, GDP(ppp-$), Nuclear Power and Ecological Footprint without carbon.

Russia – per capita Fossil CO2 Emissions and Climate Debt
2020
Russia’s current Climate Breakdown Pricing amounts to $12.16 per tons Fossil CO2 emitted since 2000. The Climate Debt grew from $1,346 per capita in 2015 to $2,676 in 2020. Updated Rankings of 165 countries are available in the menu “Climate Debt”.
The following diagrams expose the trends of Fossil CO2 Emissions, Climate Debt, GDP(ppp-$) and Ecological Footprint without carbon.
India – per capita Fossil CO2 Emissions (zero Climate Debt)
2020
In the calculation of Climate Debt, India is especially interesting because it has zero Climate Debt despite the fact that the country is the 3rd largest emitter of Fossil CO2. As it appears, India will enter the next 20-year period in ClimatePositions (2020-2039) without any Fossil CO2 Emissions exceeded. The final calculation will be made, when data on Fossil CO2 Emissions 2019 are released.
The following diagrams expose the trends of Fossil CO2 Emissions, GDP(ppp-$), Ecological Footprint without carbon, Forest Cover and Primary Forest.

United States – per capita Fossil CO2 Emissions and Climate Debt
2020
The current Climate Breakdown Pricing of the United States amounts to $30.82 per tons Fossil CO2 emitted since 2000. The Climate Debt grew from $5,497 per capita in 2015 to $10,718 in 2020. Updated Rankings of 165 countries are available in the menu “Climate Debt”.
The following diagrams expose the trends of Fossil CO2 Emissions, Climate Debt, GDP(ppp-$) and Nuclear Power.
China – per capita Fossil CO2 Emissions and Climate Debt
2020
China’s current Climate Breakdown Pricing amounts to $12.33 per tons Fossil CO2 emitted since 2000. The Climate Debt grew from $593 per capita in 2015 to $1,395 in 2020. Updated Rankings of 165 countries are available in the menu “Climate Debt”.
The following diagrams expose the trends of Fossil CO2 Emissions, Climate Debt, GDP(ppp-$) and Ecological Footprint without carbon.
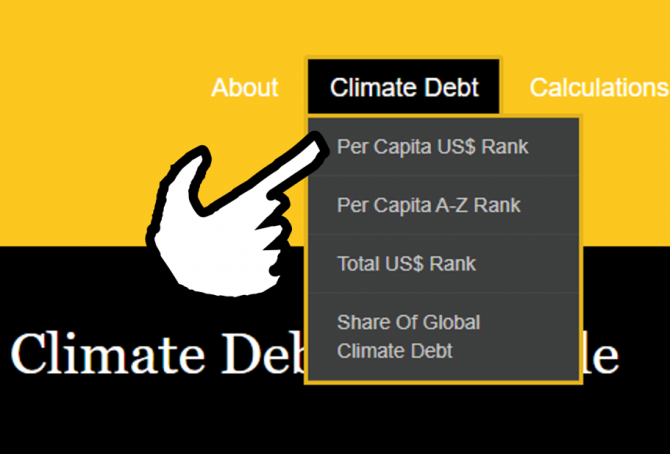
Update: Climate Debt Ranking by country (165 countries)
2020
The accumulated Climate Debt of 165 countries has been entered the menu “Climate Debt” (Rankings 2020) and the sub-menu Calculation (Excel). The coming months the climate breakdown responsibility of a large number of countries will be examined.
Global indicator updates: Land-Ocean Air Temperature, Sea Level, CO2 in the Atmosphere and Population
2019
The four global Indicators: 1) Land-Ocean Air Temperature, 2) Sea Level, 3) CO2 in the Atmosphere and 4) Population, have all been updated in ClimatePositions. Combined, the updates resulted in significant increases in national Climate Debts (the first two, due to adjustments of the national GDP-Factor and the last two, due to adjustments of the global Fossil CO2 Emission target). As an example, India’s Climate Debt increased from $0.30 per capita (rounds to zero), to $2 per capita, only because of the global Indicator updates.
Diagrams with the four global Indicators are shown below.
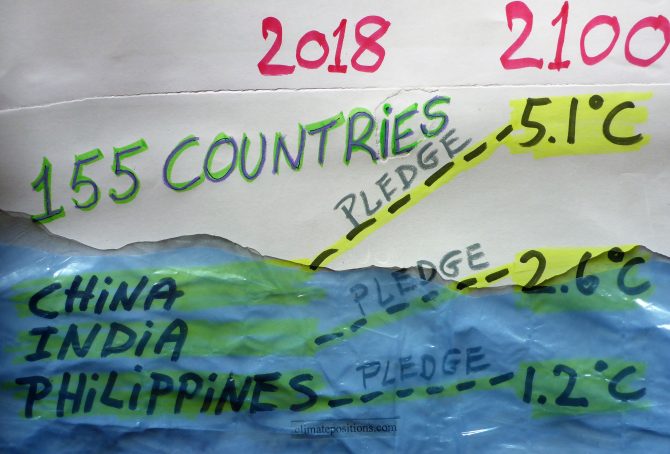
Study: National climate pledges and the resulting Global Warming by 2100 (The Pledged Warming Map)
2018
The Paris Agreement collectively committed the countries to limit Global Warming to well below 2°C and pursue efforts to limit warming to 1.5°C above preindustrial levels. However, how much Global Warming by 2100 is each country’s climate pledge leading to, if all countries adopted the same national approach and ambition? This question is being tried answered for the world’s countries on the new website ‘paris-equity-check.org‘ (Pledged Warming Map). The underlying ‘Peer-reviewed study‘ is published November 2018 in Nature Communications.
The site says: “The Paris Agreement includes bottom-up pledges and a top-down warming threshold. Under this setting where countries effectively choose their own fairness principle, Paris-Equity-Check.org presents scientifically peer-reviewed assessments the ambition of countries’ climate pledges (the Nationally Determined Contributions or NDCs) and address the question: What is a fair and ambitious contribution to achieving the Paris Agreement?” Read ‘Ambition of pledges‘ and ‘The science‘.
The table below shows 155 countries’ 1) ‘Per capita Climate Debt‘ in 2017, accumulated since 2000 in ClimatePositions, 2) per capita Fossil CO2 Emissions 2016, and 3) the pledges estimated effect on Global Warming by 2100 (Pledged Warming Map).
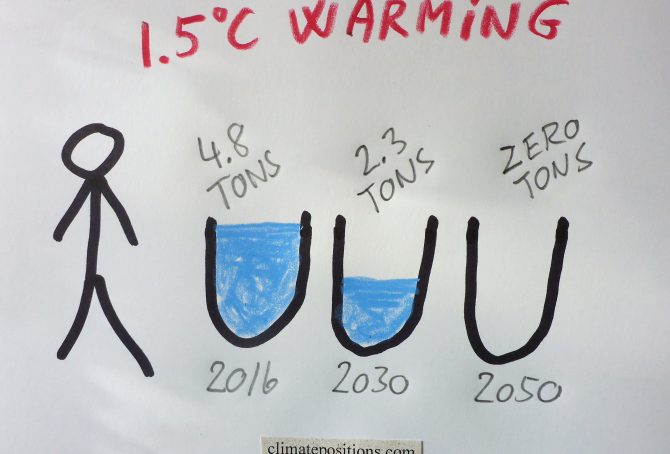
IPCC Report: Limiting Global Warming to 1.5ºC requires 45% CO2 reductions by 2030 compared to 2010 – and zero emissions by 2050 (but which countries are to reduce how much per capita?)
2018
The IPCC Report ‘Global Warming of 1.5°C‘ released October 2018, finds that limiting global warming to 1.5°C would require reductions of global human-caused CO2 Emissions (carbon dioxide) of 45% by 2030 compared to 2010, and reach zero emissions around 2050¹.
However, since global Fossil CO2 Emissions increased 6.4% between 2010 and 2016, and the world population is expected to grow 1.2% annually the years to come, the required 45% global CO2 reductions by 2030, is equivalent to 53% reduction per capita by 2030 compared to 2016, or in only 14 years. In other words, an average world citizen must cut Fossil CO2 Emissions from 4.8 tons in 2016 to around 2.3 tons by 2030 and zero by 2050 (if limiting global warming to 1.5°C). Note that forest cover growth, removing CO2 from the air, etc. can substitute Fossil CO2 reductions in the IPCC scenarios².

Global Warming: Goodbye World Wildlife Heritage
2018
World Wildlife Heritage is miraculous. However, human caused Climate Change is a brutal attack on the biodiverse wildlife on Earth. In a recent analysis ‘Published in the journal Science‘ data were gathered on geographic ranges and current climate conditions of 31,000 insect species, 8,000 birds, 1,700 mammals, 1,800 reptiles, 1,000 amphibians and 71,000 plants. Then, it was calculated how the ranges change when global warming means some regions can no longer support particular species. The analysis only took global warming as such into consideration, not the impact of lost interactions between species or the impacts of more extreme weather events; nor the interaction with wildlife degradation for other reasons.
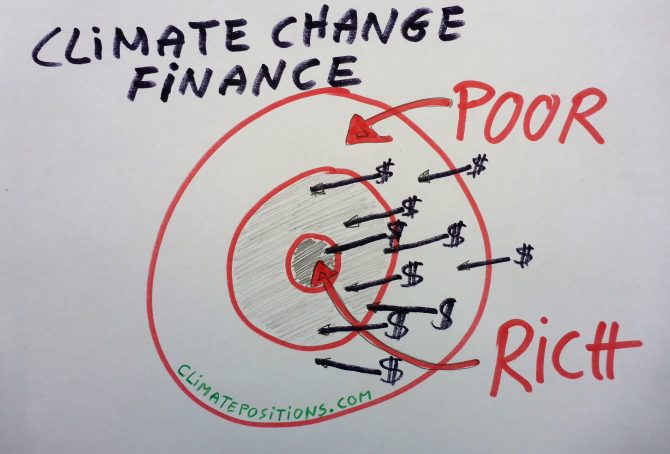
Climate Change Finance to developing countries is hocus-pocus (countries without Climate Debt stand almost empty-handed)
2018
The moral bottom line of the ‘Copenhagen Accord‘ promise is this: Rich countries must increase Climate Change Finance with new and additional money to developing countries from zero in 2009 to $100 billion by 2020. If this had happened gradually, then about $73 billion would have been delivered in 2017.
‘Oxfam‘ claims that the taxpayer-funded finance from rich countries to developing countries in 2015-16 was about $48 billion, or nearly half the amount promised for 2020. However, according to ‘Brookings‘ an earlier OECD-CPI report claims that as much as $62 billion was delivered back in 2014 – while India on the other hand claims that “only $2.2 billion could rigorously be defended as meeting the promise in Copenhagen” (COP15, 2009). Apparently, many flows counted by the OECD-CPI should not have been counted, flows such as “market-based loans counted at the full amounts, and export credits.” In other words, the confusion and dishonesty seem to be considerable.
Climate Change Litigation Databases (website with more than 1,100 cases)
2018
The website ‘climatecasechart.com‘ by ‘Sabin Center for Climate Change Law at Columbia Law School‘ provides databases of climate change caselaw worldwide. The None-U.S. Cases in the database are organized by country (Jurisdiction or Principal Law) and type of climate change claim. The United States has a separate database providing around three quarters of all 1,113 cases in the databases (which makes sense since the United States is responsible for 33.1% of the ‘Global Climate Debt‘, while populated only by 4.4%). Read the article ‘Venue of last resort: the climate lawsuits threatening the future of big oil‘ (The Guardian, 2017).
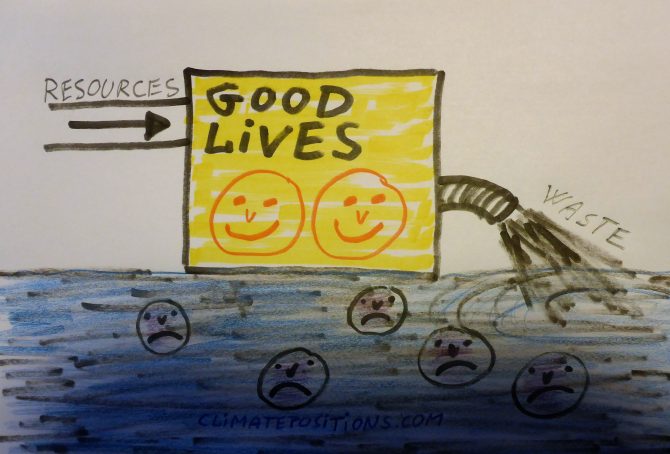
Research: A good life for all within planetary boundaries (all countries fail)
2018
The website ‘https://goodlife.leeds.ac.uk/countries/’ let you visualize and compare the environmental and social performance of 151 countries. A total of 18 indicators – 7 environmental and 11 social – are included in the comparison. However, 81 of the included countries are missing data of between 1 and 9 indicators. The methods and results underpinning the data used on the website is the peer-reviewed article ‘A good life for all within planetary boundaries’ (abstract). It says that: “Physical needs such as nutrition, sanitation, access to electricity and the elimination of extreme poverty could likely be met for all people without transgressing planetary boundaries. However, the universal achievement of more qualitative goals (for example, high life satisfaction) would require a level of resource use that is 2–6 times the sustainable level, based on current relationships.”
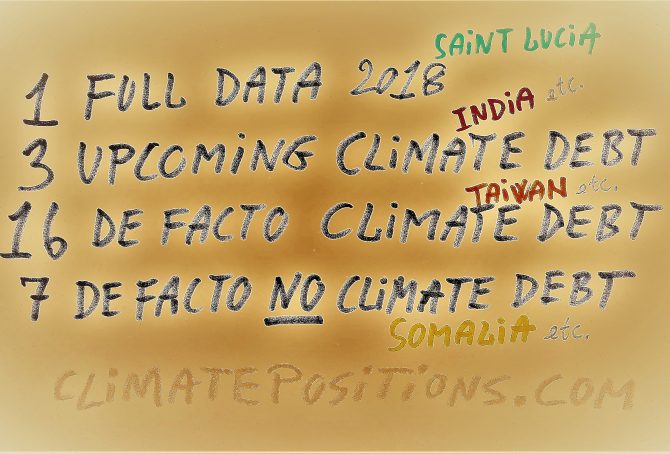
Countries with upcoming or de facto Climate Debts
2018
Among 164 countries with full data in ClimatePositions 91 have Climate Debts. Note that Saint Lucia is new on the full data country-list with an accumulated per capita Climate Debt of $287. India, Lithuania and Latvia are likely to have small Climate Debts soon … by 2018 or 2019.
In addition to the full data country-list, 16 countries with lack of indicator data would have Climate Debts with roughly estimated data¹. The estimated per capita Climate Debts of these countries are:

Indicator update: Environmental Performance Index 2018
2018
The Environmental Performance Index 2018 ranks 180 countries on 24 performance indicators across 10 issue categories¹ covering A) Environmental Health (40%), which measures threats to human health, and B) Ecosystem Vitality (60%), which measures natural resources and ecosystem services. Over the years the Environmental Performance Index (EPI) has also identified a number of severe data gaps² that hamper sustainability goals.