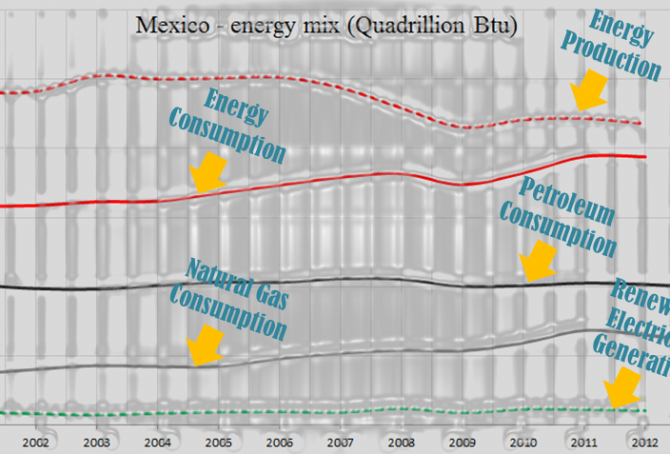
Mexico – the world’s 14th largest CO2 emitter (with an enormous solar potential)
Mexico’s current Climate Debt is $346 per capita and the ‘Ranking’ was 56th among 148 countries by January 2016. The following examines the Mexican CO2 Emissions, Climate Debt, Environmental Performance and GDP(ppp-$), in comparison with the United States, China, Brazil and Germany.
South Africa – the world’s 13th largest CO2 emitter (coal, coal and more coal … and inequality)
South Africa populates 0.7% of the planet’s people and emits 1.3% of the world’s CO2 from fossil fuels (without bunkers) and cement production. The Climate Debt of the 54 million South African’s amounts to $39 billion, or $720 per capita, and the ‘Ranking’ was 42nd among 148 countries by January 2016 – in 2010 the ranking was 45th.
The first diagram shows South Africa’s per capita CO2 Emissions from fossil fuels (without bunker fuels) and cement production in decades in comparison with the world average. CO2 Emissions 2012-2014 are preliminary estimates. The green bars are the Contribution Free Level, determined by the level of CO2 Emissions in the 1990s and a number of continuously updated ‘Indicators’.

Commission on Human Rights of the Philippines accuses Shell, BP, Chevron, BHP Billiton, Anglo American and 42 other carbon companies of breaching people’s fundamental rights to life, food, water, sanitation, adequate housing and self-determination
According to ‘The Guardian’ the Filipino government body ‘Commission on Human Rights of the Philippines‘ have given the world’s largest oil, coal, cement and mining companies 45 days to respond to a ‘legal complaint (pdf, 65 p)‘ that their greenhouse gas emissions have violated the human rights of millions of people living in the Philippines.
The UN Guiding Principles on Business and Human Rights explicitly call on companies to respect human rights, and there are three scenarios in which a company can be hold responsible for adverse impacts on human rights, quote: “(1) it may cause impacts through its own activities; (2) it may contribute to impacts through its own activities, either directly or through some outside entity (government, business, or other); and (3) it may be involved in impacts caused by an entity that is directly linked to its business operations, products, or services.”

Climate Debt: Finland ranks 13th among 148 countries
Finland’s current Climate Debt is $3,078 per capita and the ‘Ranking’ by January 2016 was 13th among 148 countries, compared to 10th ranked in 2010. The following examines the Finnish CO2 Emissions, Nuclear Power, Forest Cover, Environmental Performance and GDP(ppp-$), in comparison with the four largest trade partners Russia, Germany, Sweden and United Kingdom.

Climate Debt: Bahrain ranks 12th (immigrant workers reduce per capita CO2 Emissions)
Bahrain’s current Climate Debt, accumulated since 2000, is $3,352 per capita. The ‘Ranking’ by January 2016 was 12th among 148 countries. Although the total Bahraini CO2 Emissions from fossil fuels and cement production have increased about 100% since 1990, and 35% since 2006, the per capita emissions have declined from 27.2 tons in the 1990s to 17.9 tons in 2011 – how can that be?
The key explanation is simple: immigration of great numbers of (often) ‘Slavery-like workers‘, presumably with low individual emissions, has lowered the national average! Today around 55% of Bahrain’s population are immigrants from India, Bangladesh, Pakistan, the Philippines, Indonesia, Jordan, Syria, Yemen, Nepal, East Africa etc. If the immigrant-emissions hypothetically is set at 2 tons of CO2 per capita on average (which is more than their origin countries on average), then the 45% native Bahraini’s emitted 38 tons per capita in 2011, or eight times the world average. Nevertheless, the national ‘COP21 Submission 2015’ mentions no overall emission reduction target. Add to this the nasty facts that Bahrain’s fossil fuel production 2012 (Btu) was 44% above the 2000-level¹ and renewable electricity production (Btu) 2012 amounted only 0.003% of the total energy consumption (Btu). Bahrain is categorized as “authoritarian” and ranks 146 among 160 countries in the ‘Democracy Index 2015‘ … and no data is available on income distribution (inequality) – no surprise.
Indonesia’s Climate Debt, rainforests, waters and greenhouse gas emissions
Indonesia’s current Climate Debt, accumulated since 2000, is $123 per capita (‘ranks’ 67th among 148 countries, by January 2016). The total Climate Debt is $31 billion (‘ranks’ 25th). However, looking at the entire level of greenhouse gas emissions, Indonesia is estimated to be the world’s 3rd largest emitter¹, with the large majority of its emissions coming from rainforest and peatland degradation and loss. Today, around 5% of the global greenhouse gas emissions are coming from Indonesia, with its 3.7% share of the global population. The following examines the indicators of CO2 Emissions, Forest Cover, Primary Forests and GDP(ppp-$), and other warming-related topics such as forest fires, oil palms and ecosystems.

Forest Cover and Primary Forests 1990-2015 (two country groups are examined)
This article is sourced from two publications by ‘FAO’: ‘Forest Ecology and Management 2015 (pdf 145 p)’ and ’Global Forest Resources Assessment 2015 (pdf 253 p)’. The latter contains 46 different tables¹ with 234 countries and territories forest development 1990-2015.
Primary Forest is defined as naturally regenerated forest of native species, where there are no clearly visible indications of human activities and the ecological processes are not significantly disturbed. Today, Primary forest accounts for 32% of global Forest Cover and has apparently increased by around 6.8% between 1990 and 2015, however, this increase is largely due to the fact that more countries have submitted data for the statistic. This taken into account, an overall global Primary Forest loss of 2.5%, since 1990, is more likely (and 10.0% loss in the tropics).
Update 2016: Climate financing as share of Climate Debt, by country
[Modified version posted 17 June 2016] ‘Climate Funds Update’ is an independent website providing information on climate finance designed for developing countries to address climate change. The data is based on information received from 25 multilateral, bilateral, regional and national climate funds and the funding is largely up to date by the end of May 2016. A total of $21 billion has currently been funded (money deposited), of which around 95% is country-sourced. The global climate finance has increased by approximately 24% since October 2015 (in seven months). The table below shows the Climate Debt per capita in ClimatePositions, the per capita climate financing (funding) to developing countries and the climate financing as share of the Climate Debt.
The table includes 35 countries with both climate financing and Climate Debt in ClimatePositions (only countries with full data in ClimatePositions are included).
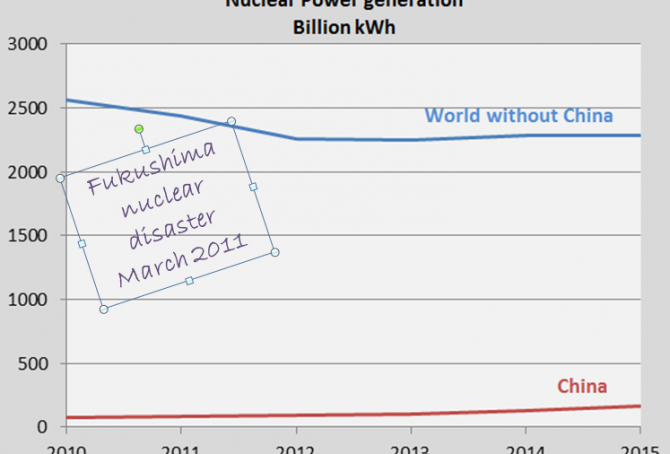
World’s Nuclear Power generation 2015: 1.3% growth compared to 2014
The world’s Nuclear Power generation increased by 1.3% in 2015 compared to 2014 (and 4.0% increase compared to 2012). The table below shows the generation in billion kWh of all Nuclear Power nations and the global generation, since 2010. China increased the generation by 30.2% in 2015 compared to 2014, while the rest of the world the decreased the generation by 0.3%. The global generation level in 2015 is still 7.1% below the 2010-level.

Climate Debt: Norway ranks 9th (performance of top twenty from Human Development Index)
The so called ‘Human Development Index 2015’ (UN) ranks Norway 1st among 188 countries. The index is based on 1) Life expectancy at birth, 2) Expected years of schooling, 3) Mean years of schooling and 4) Gross national income (GNI) per capita. However, the wealthy Scandinavian oil state ‘Ranks‘ 9th among 148 countries on Climate Debt per capita. Norway is in other words a highly human developed demolisher of the climate, one might say! The following examines the climate performance of Norway in comparison with the other top five countries from Human Development Index: Australia, Switzerland, Denmark and Netherland.

Global ocean temperature January-April 2016 is scary news too (see the graph 1880-2016)
More than 90% of the additional heat trapped in the atmosphere due to human caused greenhouse gases such as carbon dioxide from burning of Fossil Fuels, is absorbed by the oceans. In continuation of the previous ‘Article’ the global ocean (air) temperature January-April 2016 was around 1.0ºC higher than the average temperature January-April between 1880 and 1937 (calculated by ClimatePositions) – see the graph. The black line shows the 136-year-trend. Compose your own graph at ‘http://www.ncdc.noaa.gov/cag/time-series/global’.

Global land temperature January-April is creepy feverish (see the graph 1880-2016)
The world’s two largest economies and carbon dioxide emitters, the United States and China, have thwarted the negotiations toward a globally binding climate agreement for decades. Instead, the world is left with “intended nationally defined contributions” and the “aggregate emission pathways consistent with holding the increase in the global average temperature to well below 2°C above preindustrial levels and pursuing efforts to limit the temperature increase to 1.5°C.” This is of cause warm air, so to speak.
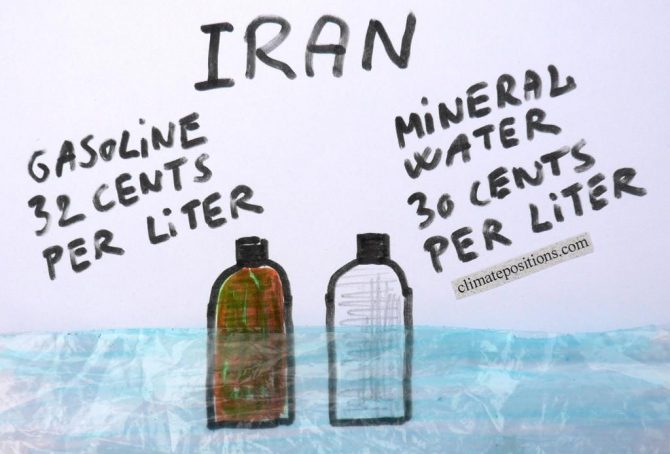
Climate Debt: Iran ranks 33rd (performance of the twenty most populous Muslim countries)
The twenty most populous countries with more than 85% Muslim majority (here called Muslim-20) represent 16.2% of the global population and 7.3% of the global Climate Debt in ClimatePositions. The average climate performance of the Muslim world is superior to the world average, so to speak. Among Muslim-20 Iran ranks 2nd (33rd among 148 countries) on Climate Debt per capita only surpassed by the climate-change-monster of Saudi Arabia.

Climate Debt: Australia ranks 8th (performance of the twenty largest coal producers)
2016
Australia covers around 5.7% of planet’s land area and populates 0.3% of its people. The Climate Debt of the 24 million Australian’s amounts to $132 billion, or $5,613 per capita, which ‘Ranks’ Australia 8th among 148 countries – in 2010 the ranking was 6th. Australia is the world’s 5th largest coal producer and the 2nd largest per capita CO2 emitter from coal combustion … and coal is the most efficient climate destroyer. The table below reveals some key figures of the world’s twenty largest coal producers. Subsequently, Australia’s climate change performance is examined in comparison with four other top-five countries on CO2 Emissions from coal combustion (per capita): Kazakhstan (ranked 1), South Africa (3), the United States (4) and Poland (5).
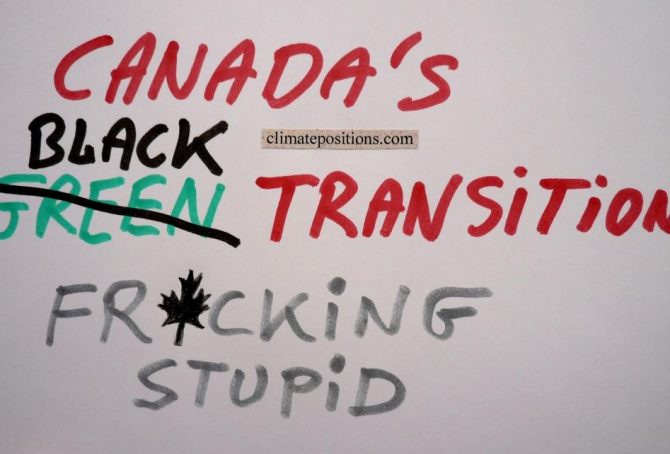
Canada now ranks 10th in Climate Debt per capita (due to black transition)
Canada covers 7.3% of planet’s land area and populates 0.5% of its people. The Climate Debt of the 35 million Canadians amounts to $183 billion, or $5,138 per capita, which ‘Ranks’ Canada 10th among 148 countries. In 2010 the ranking was 7th. The following compares the Canadian performance with the ones of Australia, New Zealand, Sweden and Finland – all wealthy developed countries with small or relatively small population density¹.
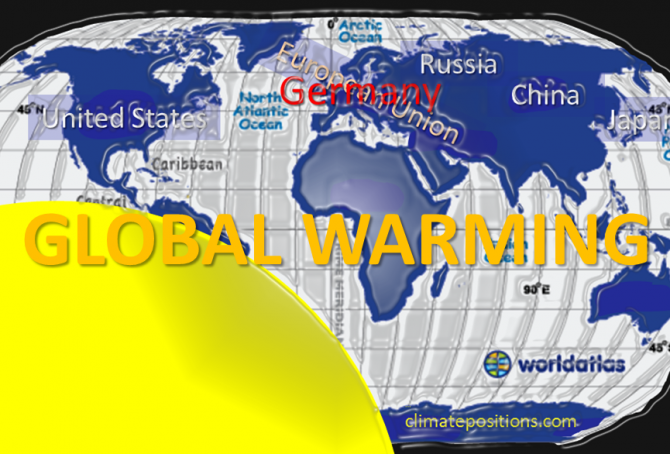
Climate Debt of Germany & the European Union … versus the United States, China, Japan and Russia
The Climate Debt of ‘the 28 member states of the European Union (EU-28)’, China, the United States, Japan and Russia, combined, amounts to nearly 70% of the world’s total Climate Debt of around $5,700 billion. The following compares 1) EU-28 with the four countries, 2) Germany with EU-28, and 3) Germany with the four other countries.
The table below shows the per capita Climate Debt, the total Climate Debt and the share of the global Climate Debt, of EU-28¹, China, the United States, Japan and Russia. Rankings of 148 countries by 2010 and January 2016 (preliminary estimates) are available in the menu “Climate Debt”.

Climate Debt: South Korea now ranks 11th (Nuclear Power generation worsens the trend)
South Korea is responsible for 3.9% of the global Climate Debt of $5.7 trillion, accumulated since 2000. The per capita Climate Debt is $4,404 which ‘Ranks’ South Korea 11th among 148 countries, compared to 12th in 2010. Rankings are available in the menu “Climate Debt”. The following examines the CO2 Emissions, Nuclear Power, GDP(ppp-$) and Climate Debt, in comparison with four other large Nuclear Power generators.
The first diagram shows the South Korean per capita CO2 Emissions from fossil fuels (without bunker fuels) and cement production in decades in comparison with the world average. CO2 Emissions since 2012 are preliminary estimates. From 7.6 tons in the 1990s the level increased to 11.8 tons on average between 2000 and 2014 (preliminary). The green bars are the Climate Debt Free Level in ClimatePositions, determined by the level of emissions in the 1990s and a number of continuously updated ‘Indicators’.

Saudi Arabia’s climate destruction proceeds (bankruptcy is a ship on the horizon, though)
The per capita Climate Debt of Saudi Arabia accumulated since 2000 is now $7,251 which ranks the wealthy oil-state 6th among 148 countries. The Saudi climate change financing to developing countries is zero dollars.
The first diagram (below) shows Saudi Arabia’s per capita CO2 Emissions from fossil fuels (without bunker fuels) and cement production in decades in comparison with the world average. CO2 Emissions since 2012 are preliminary estimates. The green bars are the Contribution Free Level, determined by the level of CO2 Emissions in 1990s and a number of continuously updated ‘Indicators’. The Saudi emissions were 13.8 tons annually in the 1990s, on average, and 18.7 tons between 2010 and 2014 (preliminary).
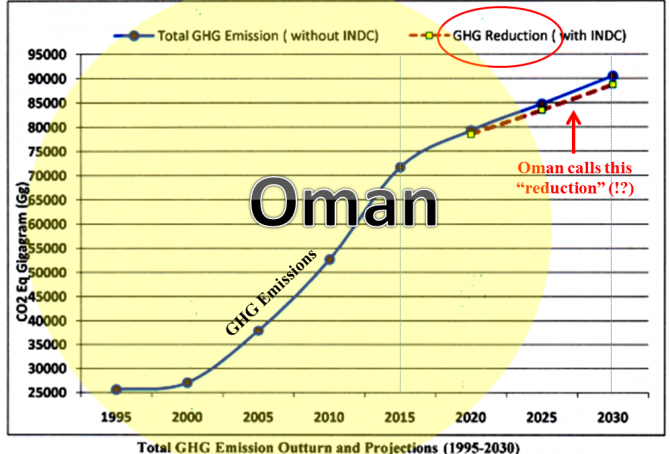
Climate Debt: Oman ranks 5th (more emissions to come!)
The current Omani Climate Debt, accumulated since 2000, is $9,645 per capita and the ‘Ranking’ is 5th among 148 countries. According to the bizarre Omani ‘COP21 Submission 2015’ the wealthy authoritarian oil state is planning to increase GHG-emissions by only(!?) 22% by 2030 compared to 2015. The implementation of this (extremely climate destructive) target is, even more ludicrous, conditioned upon “assistance provided by the UNFCCC on finance, capacity building and transfer of technology”. The following examines Oman’s CO2 Emissions, Environmental Performance, GDP(ppp-$) and Climate Debt.

Russia’s Climate Debt keeps accelerating (however, the Environmental Performance has improved)
The accumulated Russian per capita Climate Debt is ranked 25th among 148 countries. Back in 2010 the ranking was 33rd. The reckless development also shows in Russia’s share of the global Climate Debt: 3.9% by January 2016 compared to 3.0% in 2010. Rankings are available in the menu “Climate Debt”. The following examines the development of CO2 Emissions, Environmental Performance, GDP(ppp-$) and Climate Debt, in comparison with some of ‘Russia’s largest trading partners’.