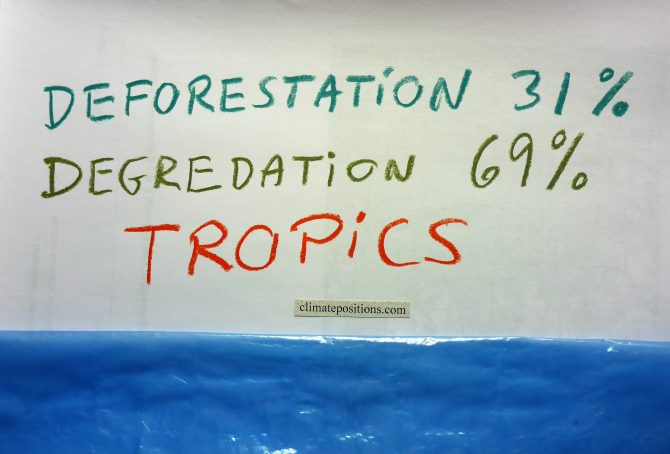
Study: Tropical forests now release twice as much carbon than they absorb
2017
A new ‘Study‘ from ‘Woods Hole Research Center‘ and Boston University reveals tropical forests now emit twice as much carbon than they capture. This is alarming news, since forests are the only carbon capture and storage “technology” that is safe, inexpensive and immediately available.
New approach to measuring forest carbon density using 1) satellite imagery 2003-2014, 2) laser remote sensing technology and 3) field measurements, were able to capture aboveground losses in forest carbon from full-scale deforestation as well as fine-scale degradation and disturbance. The latter has previously been a challenge to the scientific community over large areas. According to the study tropical forests in Americas, Africa and Asia are now releasing 425 (± 22%) teragrams (million tons) of carbon annually¹, equivalent to more than 4% (calculated by me) of global CO2 Emissions from Fossil Fuels and industrial processes. For perspectivation, global CO2 Emissions dropped 0.34% in 2016 compared to 2015.
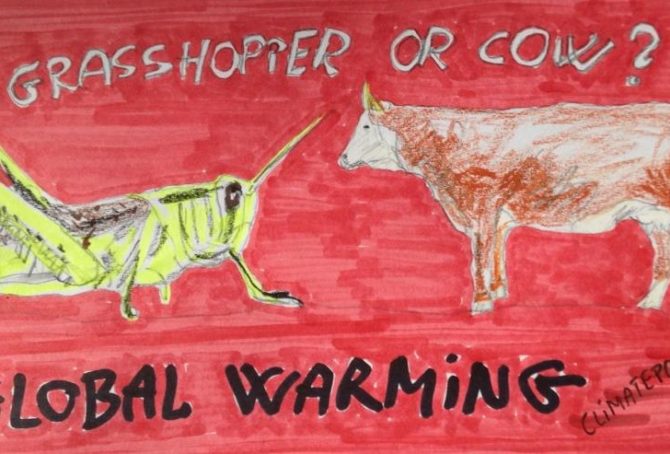
Reduce greenhouse gas emissions: Eat insects instead of meat
2016
The burning of fossil fuels (coal, oil and gas) is the major driving force for global warming¹. However, livestock rearing is responsible for around 18% of the anthropological greenhouse gas emissions (CO2 equivalent) and various edible insects are therefore excellent alternatives to meat in the fight against climate change. It is estimated that insects today is part of the diets of 25-30% of the global population and about 1,900 species are being used as human consumption. The following examine the climate- and environmental impact of different species of insects versus beef, pigs and chicken.
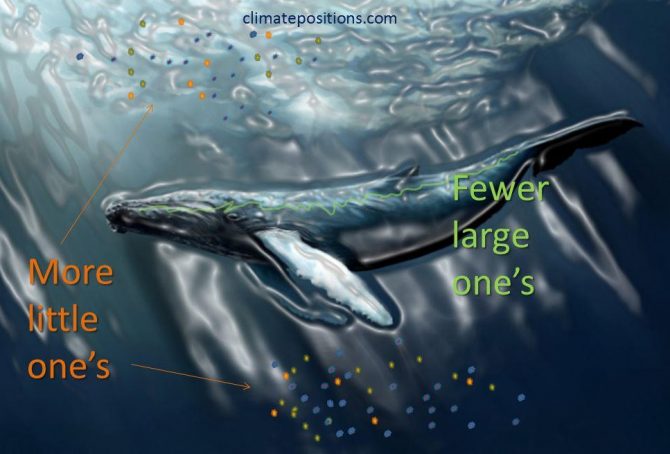
Research: The emerging mass extinction in the ocean threaten larger animals more compared to past mass extinctions (more bad news)
2016
The research ‘Ecological selectivity of the emerging mass extinction in the oceans‘ (pdf, 4 pages), published in the journal Science, show that “extinction threat in the modern oceans is strongly associated with large body size, whereas past extinction events were either nonselective or preferentially removed smaller-bodied taxa.” Or in other words: The balance between smaller animals and larger animals changes to the disadvantage of larger animals – due to human impact.

Report: Explaining Ocean Warming (the greatest hidden challenge of our generation)
2016
‘International Union for Conservation of Nature (IUCN)’ has recently published the report ‘Explaining Ocean Warming (pdf, 460 pages)‘ representing the most comprehensive review to date on ocean warming. IUCN is the world’s largest environmental network, harnessing the knowledge and research of around 1,300 organizations and 16,000 experts. The chapters and sections in the report tells in the scientist’s own words the scale and nature of changes being driven by ocean warming, often in association with other stressors such as ocean acidification and oxygen reductions. The following is an adapted summary of the report’s conclusions and recommendations.
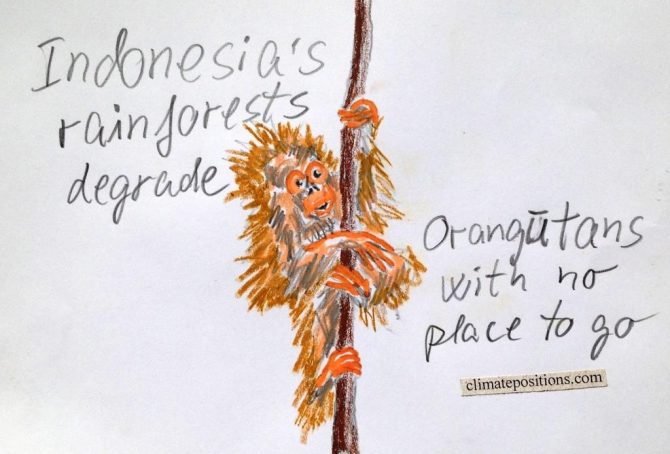
Indonesia’s Climate Debt, rainforests, waters and greenhouse gas emissions
Indonesia’s current Climate Debt, accumulated since 2000, is $123 per capita (‘ranks’ 67th among 148 countries, by January 2016). The total Climate Debt is $31 billion (‘ranks’ 25th). However, looking at the entire level of greenhouse gas emissions, Indonesia is estimated to be the world’s 3rd largest emitter¹, with the large majority of its emissions coming from rainforest and peatland degradation and loss. Today, around 5% of the global greenhouse gas emissions are coming from Indonesia, with its 3.7% share of the global population. The following examines the indicators of CO2 Emissions, Forest Cover, Primary Forests and GDP(ppp-$), and other warming-related topics such as forest fires, oil palms and ecosystems.

Forest Cover and Primary Forests 1990-2015 (two country groups are examined)
This article is sourced from two publications by ‘FAO’: ‘Forest Ecology and Management 2015 (pdf 145 p)’ and ’Global Forest Resources Assessment 2015 (pdf 253 p)’. The latter contains 46 different tables¹ with 234 countries and territories forest development 1990-2015.
Primary Forest is defined as naturally regenerated forest of native species, where there are no clearly visible indications of human activities and the ecological processes are not significantly disturbed. Today, Primary forest accounts for 32% of global Forest Cover and has apparently increased by around 6.8% between 1990 and 2015, however, this increase is largely due to the fact that more countries have submitted data for the statistic. This taken into account, an overall global Primary Forest loss of 2.5%, since 1990, is more likely (and 10.0% loss in the tropics).
Forest Cover updates 2015 (and the number of trees on the planet)
2015
The United Nations site for the ‘Millennium Development Goals Indicators’ (MDG Indicators) has published the estimated Forest Cover as percentage of land area of 225 countries. The table at the bottom includes only 83 selected countries with Climate Debt in ClimatePositions (the fraction of the Climate Debt caused by Forest Cover-change is revealed). However, Forest Cover alone is a poor ecosystem-indicator and therefore the area with the precious Primary Forests is also included in ClimatePositions (read the article ‘Forest Cover, Primary Forests and Climate Debt’).
Historic use of phrases such as Climate Change, Biodiversity, Renewable Energy, Fracking, etc. (Google Books Ngram Viewer)
2015
‘Ngram Viewer’ is a Google search service showing graphs of historic use of words and phrases in books published in the United States (until 2008). The diagram below shows the trend of the phrases: Climate Change, Biodiversity, Global Warming, Deforestation, Renewable Energy, Greenhouse Effect, Invasive Species and Fracking. The corpus search is in “English” (case-insensitive), between 1980 and 2008. Read the comments below the diagram.

Invasive species, climate change and mass extinction
2014
There is a lack of standard terminology for invasive species. Some used definitions¹ seem artificially twisted so that Homo sapiens can’t be classified as an invasive species (which of cause is absurd since we are the worst). My own definition used in this article is this: “Invasive species are animals and plants introduced into places out of their natural range of distribution, where they have a tendency to spread and generate a negative impact on the local ecosystem and species.” This clarifies three disputes: a) A species can be invasive and not invasive at different times and different places, b) consequently, not all Homo sapiens are necessarily invasive, and certainly not all the time and c) transportation by plane, ship, train, vehicle, etc. often carry animals (including Homo sapiens) and plants further than their natural range of distribution. This opens up for analyzes.
Forest Cover, Primary Forests and climate debt
2014
The national data of Forest Cover and Primary Forest are both included in the calculations of Climate Contributions (debt) in ClimatePositions. Primary Forest was included as an indicator in the worksheet in August 2014. The following describes selected findings on forests from FAO’s ‘The Global Forest Resources Assessments (FRA), 2010’ (main report, pdf, 378 pages). The Assessment is based on two primary sources of data: 1) ‘country reports’ and 2) remote sensing conducted by FAO and partners.

The Philippines beats Malaysia in climate change performance (what about the rainforests?)
2014
The Philippines is Contribution Free in ClimatePositions while Malaysia was the 36th worst performing country out of 145 in 2010. In 2014, the Malaysian Climate Contribution (climate debt) increased to $997 per capita and the present ranking is 31st (see ‘here’). The first diagram (below) illustrates the typical correlation between rapid economic growth and loss of sustainability that increases climate debt. The Malaysian climate debt, computed as a percentage of GDP(ppp-$) annually since 2000 increased from 0.38% in 2010 to 0.41% in 2014 (see the ranking ‘here’). This clearly demonstrates the lack of sustainable growth. The following examines the indicators of CO2 Emissions, Ecological Footprint, Forest Area and Marine Protection of the Philippines and Malaysia.
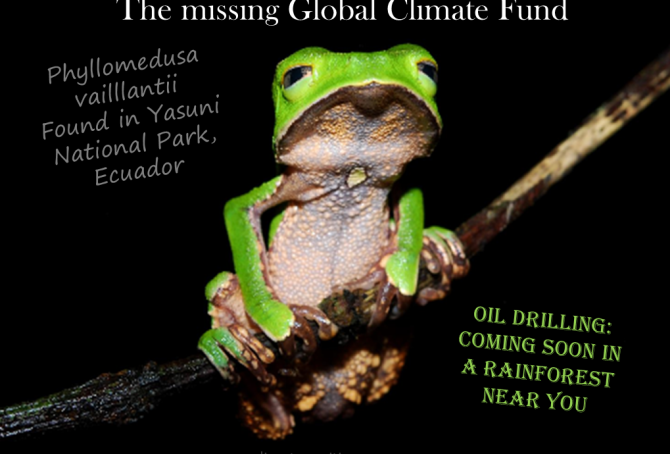
The missing Global Climate Fund
2014
When the necessary climate change financing is secured on a global scale (in our dreams) the paid Climate Contributions must be spent wisely and fair … but how and decided by whom? Well, the incriminated nations that burned fossil fuels excessively for decades knowing that it destroys the climate worldwide can’t be legitimate decision-making participants in the creation of a Global Climate Fund. Only Contribution Free countries can (including those who have paid their climate debt). The opposite seems to be the case in the everlasting and fruitless United Nations COP process.
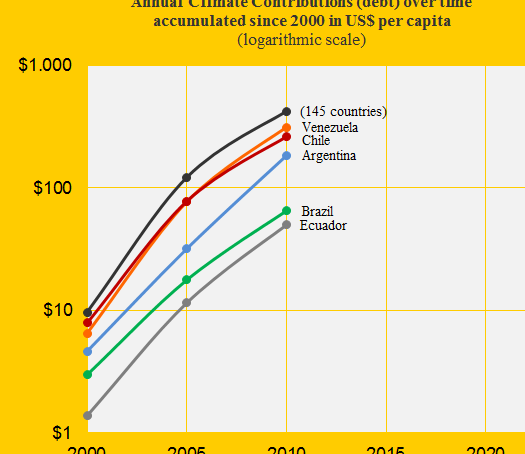
Venezuela loses big to Colombia in climate responsibility
2014
Colombia was Contribution Free in ClimatePositions 2010 and Venezuela was the 43rd worst performing country out of 145 (see the menu “Contributions”). The Venezuelan Climate Contribution (climate debt) was $313 per capita which was the 3rd largest in America after the extreme polluters United States and Canada. The diagram shows the Climate Contributions over time per capita of Venezuela, Chile, Argentina, Brazil, Ecuador and the world average (145 countries). In the updated calculation Venezuela’s Contribution has increased to $428 per capita (worsened two country rankings). The following examines Colombia’s and Venezuela’s CO2 Emissions, Ecological Footprint, Environmental Performance and forest cover.
Climate performance of Mexico and neighboring countries
2014
The Mexican CO2 Emissions per capita over time are similar to the world trend (see the diagram) and Mexico is the world’s 12th largest CO2 emitter. Together with the neighboring countries Mexico represent the full range of Climate Contributions (climate debt) worldwide. The following examines the statistics of Mexico in comparison with United States, Guatemala, El Salvador and Honduras.
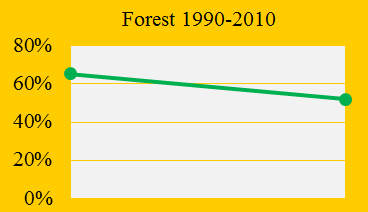
Indonesia fails on deforestation and CO2 Emissions
2013
Indonesia was the 73rd worst performing country out of 145 in ClimatePositions 2010 with a total Climate Contribution (climate debt) of 5.6 billion US$. As shown in the front diagram Indonesia cut down the total forest cover (mainly rainforest) from 65.4% in 1990 to 52.1% in 2010. Had Indonesia maintained the forest cover since 1990, then the saving in Contribution would have been 4.6 billion US$. In the updated calculation the Contribution (debt) has increased to 6.5 billion US$.

Brazil and the world’s rainforests
2013
Brazil was the 63rd worst performing country in ClimatePositions 2010 with a total Climate Contribution (climate debt) of 12.4 billion US$. In the latest calculation the debt has increased to 15.3 billion US$. Between 1990 and 2010 Brazil cut down the total forest cover (mainly rainforest) from 69.0% to 62.4%.

Rainforest in Ecuador and global funding
2013
Ecuador was the 68th worst performing country out of 145 in ClimatePositions 2010, but the Climate Contribution (debt) was entirely due to reductions in rainforest since 1990. The diagram shows the forest coverage in percent of the total area in 1990 (49.9%) and 2010 (35.6%). The total national Contribution (debt) was 626 million US$ in 2010.