South Korea – per capita Fossil CO2 Emissions and Climate Debt
2020
South Korea’s current Climate Breakdown Pricing amounts to $33.53 per tons Fossil CO2 emitted since 2000. The Climate Debt grew from $3,608 per capita in 2015 to $7,397 in 2020. Updated Rankings of 165 countries are available in the menu “Climate Debt”.
The following diagrams expose the trends of Fossil CO2 Emissions, Climate Debt, GDP(ppp-$) and Ecological Footprint without carbon.

Iran – per capita Fossil CO2 Emissions and Climate Debt
2020
Iran’s current Climate Breakdown Pricing amounts to $15.69 per tons Fossil CO2 emitted since 2000. The Climate Debt grew from $1,095 per capita in 2015 to $2,153 in 2020. Updated Rankings of 165 countries are available in the menu “Climate Debt”.
The following diagrams expose the trends of Fossil CO2 Emissions, Climate Debt, GDP(ppp-$), Ecological Footprint (without carbon) and Nuclear Power.
Germany – per capita Fossil CO2 Emissions and Climate Debt
2020
Germany’s current Climate Breakdown Pricing amounts to $18.68 per tons Fossil CO2 emitted since 2000. The Climate Debt grew from $1,562 per capita in 2015 to $3,536 in 2020. Updated Rankings of 165 countries are available in the menu “Climate Debt”.
The following diagrams expose the trends of Fossil CO2 Emissions, Climate Debt, GDP(ppp-$), Nuclear Power and Ecological Footprint without carbon.
Japan – per capita Fossil CO2 Emissions and Climate Debt
2020
Japan’s current Climate Breakdown Pricing amounts to $20.35 per tons Fossil CO2 emitted since 2000. The Climate Debt grew from $1,952 per capita in 2015 to $3,734 in 2020. Updated Rankings of 165 countries are available in the menu “Climate Debt”.
The following diagrams expose the trends of Fossil CO2 Emissions, Climate Debt, GDP(ppp-$), Nuclear Power and Ecological Footprint without carbon.

Russia – per capita Fossil CO2 Emissions and Climate Debt
2020
Russia’s current Climate Breakdown Pricing amounts to $12.16 per tons Fossil CO2 emitted since 2000. The Climate Debt grew from $1,346 per capita in 2015 to $2,676 in 2020. Updated Rankings of 165 countries are available in the menu “Climate Debt”.
The following diagrams expose the trends of Fossil CO2 Emissions, Climate Debt, GDP(ppp-$) and Ecological Footprint without carbon.
India – per capita Fossil CO2 Emissions (zero Climate Debt)
2020
In the calculation of Climate Debt, India is especially interesting because it has zero Climate Debt despite the fact that the country is the 3rd largest emitter of Fossil CO2. As it appears, India will enter the next 20-year period in ClimatePositions (2020-2039) without any Fossil CO2 Emissions exceeded. The final calculation will be made, when data on Fossil CO2 Emissions 2019 are released.
The following diagrams expose the trends of Fossil CO2 Emissions, GDP(ppp-$), Ecological Footprint without carbon, Forest Cover and Primary Forest.

United States – per capita Fossil CO2 Emissions and Climate Debt
2020
The current Climate Breakdown Pricing of the United States amounts to $30.82 per tons Fossil CO2 emitted since 2000. The Climate Debt grew from $5,497 per capita in 2015 to $10,718 in 2020. Updated Rankings of 165 countries are available in the menu “Climate Debt”.
The following diagrams expose the trends of Fossil CO2 Emissions, Climate Debt, GDP(ppp-$) and Nuclear Power.
China – per capita Fossil CO2 Emissions and Climate Debt
2020
China’s current Climate Breakdown Pricing amounts to $12.33 per tons Fossil CO2 emitted since 2000. The Climate Debt grew from $593 per capita in 2015 to $1,395 in 2020. Updated Rankings of 165 countries are available in the menu “Climate Debt”.
The following diagrams expose the trends of Fossil CO2 Emissions, Climate Debt, GDP(ppp-$) and Ecological Footprint without carbon.
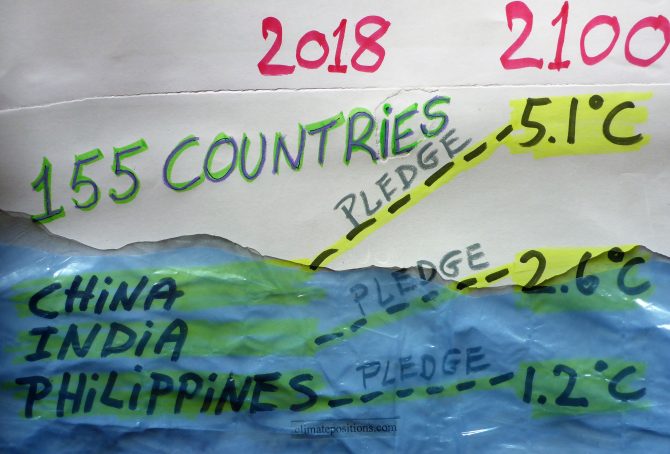
Study: National climate pledges and the resulting Global Warming by 2100 (The Pledged Warming Map)
2018
The Paris Agreement collectively committed the countries to limit Global Warming to well below 2°C and pursue efforts to limit warming to 1.5°C above preindustrial levels. However, how much Global Warming by 2100 is each country’s climate pledge leading to, if all countries adopted the same national approach and ambition? This question is being tried answered for the world’s countries on the new website ‘paris-equity-check.org‘ (Pledged Warming Map). The underlying ‘Peer-reviewed study‘ is published November 2018 in Nature Communications.
The site says: “The Paris Agreement includes bottom-up pledges and a top-down warming threshold. Under this setting where countries effectively choose their own fairness principle, Paris-Equity-Check.org presents scientifically peer-reviewed assessments the ambition of countries’ climate pledges (the Nationally Determined Contributions or NDCs) and address the question: What is a fair and ambitious contribution to achieving the Paris Agreement?” Read ‘Ambition of pledges‘ and ‘The science‘.
The table below shows 155 countries’ 1) ‘Per capita Climate Debt‘ in 2017, accumulated since 2000 in ClimatePositions, 2) per capita Fossil CO2 Emissions 2016, and 3) the pledges estimated effect on Global Warming by 2100 (Pledged Warming Map).
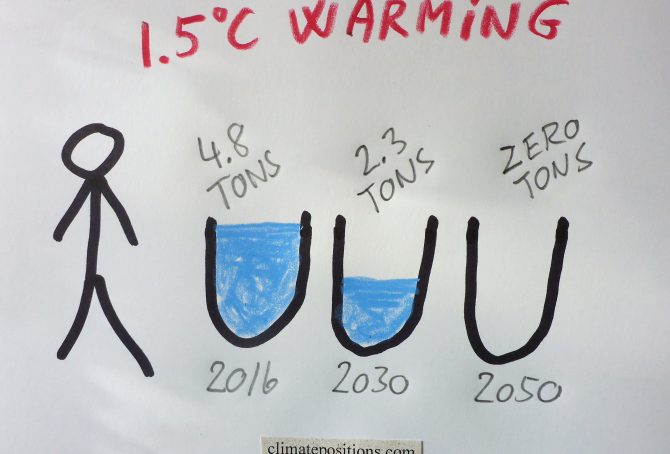
IPCC Report: Limiting Global Warming to 1.5ºC requires 45% CO2 reductions by 2030 compared to 2010 – and zero emissions by 2050 (but which countries are to reduce how much per capita?)
2018
The IPCC Report ‘Global Warming of 1.5°C‘ released October 2018, finds that limiting global warming to 1.5°C would require reductions of global human-caused CO2 Emissions (carbon dioxide) of 45% by 2030 compared to 2010, and reach zero emissions around 2050¹.
However, since global Fossil CO2 Emissions increased 6.4% between 2010 and 2016, and the world population is expected to grow 1.2% annually the years to come, the required 45% global CO2 reductions by 2030, is equivalent to 53% reduction per capita by 2030 compared to 2016, or in only 14 years. In other words, an average world citizen must cut Fossil CO2 Emissions from 4.8 tons in 2016 to around 2.3 tons by 2030 and zero by 2050 (if limiting global warming to 1.5°C). Note that forest cover growth, removing CO2 from the air, etc. can substitute Fossil CO2 reductions in the IPCC scenarios².
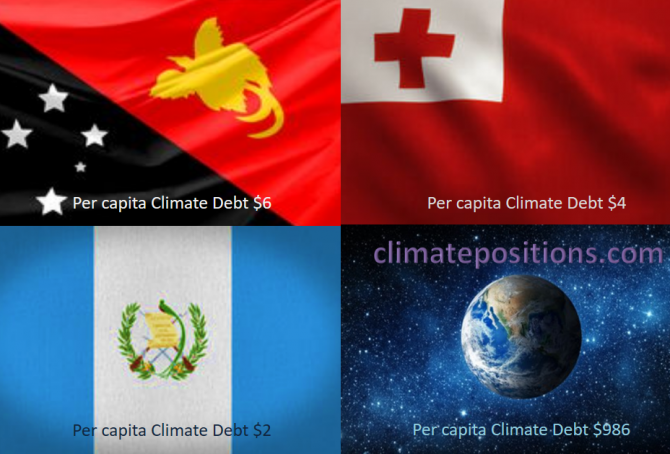
Share of global Climate Debt rank 88th, 89th and 90th: Papua New Guinea, Guatemala, Tonga (combined responsible for 0.001% of Climate Debt and 0.078% of Fossil CO2 Emissions 2016)
2018
The diagram below shows ‘Share of global Climate Debt‘ in 2010, 2015 and 2017 of Papua New Guinea, Guatemala and Tonga (ranked 88th, 89th and 90th). All three countries had zero Climate Debt in 2010, Tonga even in 2015.
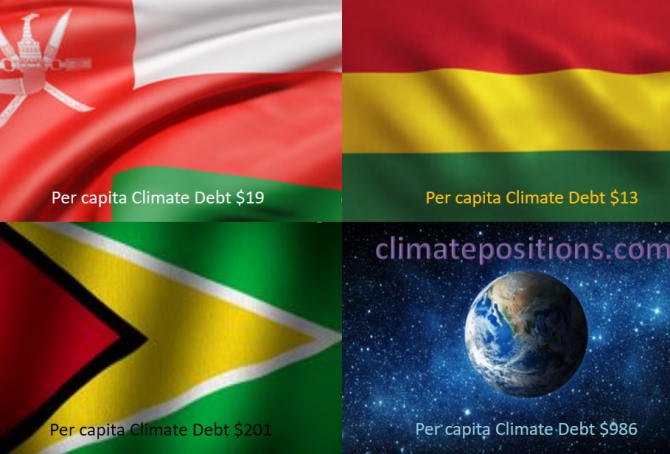
Share of global Climate Debt rank 85th, 86th, and 87th: Honduras, Guyana and Bolivia (combined responsible for 0.006% of Climate Debt and 0.090% of Fossil CO2 Emissions 2016)
2018
The diagram below shows ‘Share of global Climate Debt‘ in 2010, 2015 and 2017 of Honduras, Guyana and Bolivia (ranked 85th, 86th, and 87th). The share of Honduras decreased significantly during the period. The global Climate Debt accumulated since 2000 is $7.2 Trillion.
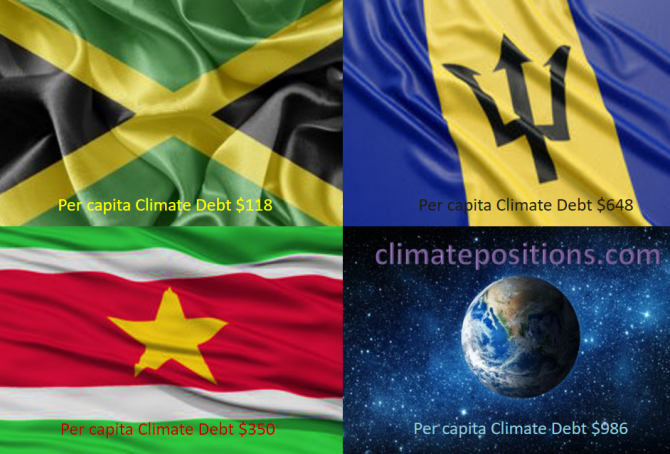
Share of global Climate Debt rank 82nd, 83rd, and 84st: Jamaica, Suriname and Barbados (combined responsible for 0.01% of Climate Debt and 0.04% of Fossil CO2 Emissions 2016)
2018
The diagram below shows ‘Share of global Climate Debt‘ in 2010, 2015 and 2017 of Jamaica, Suriname and Barbados (ranked 82nd, 83rd, and 84st). The accumulated global Climate Debt is $7.2 Trillion.
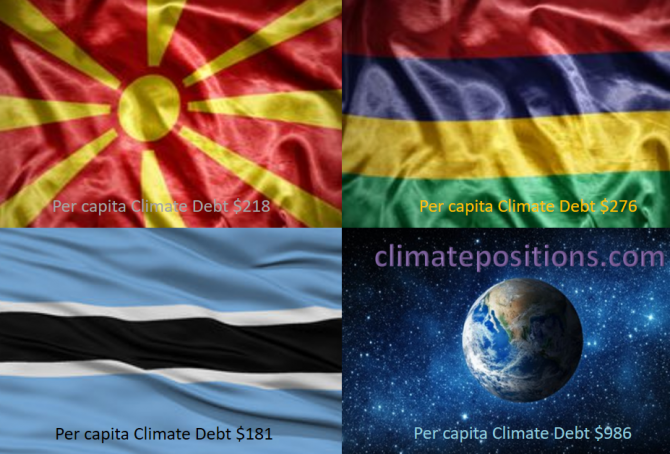
Share of global Climate Debt rank 79th, 80th, and 81st: Macedonia, Botswana and Mauritius (combined responsible for 0.02% of Climate Debt and 0.05% of Fossil CO2 Emissions 2016)
2018
The diagram below shows ‘Share of global Climate Debt‘ in 2010, 2015 and 2017 of Macedonia, Botswana and Mauritius (ranked 79th, 80th, and 81st). The global Climate Debt, accumulated since 2000, is $7.2 Trillion.
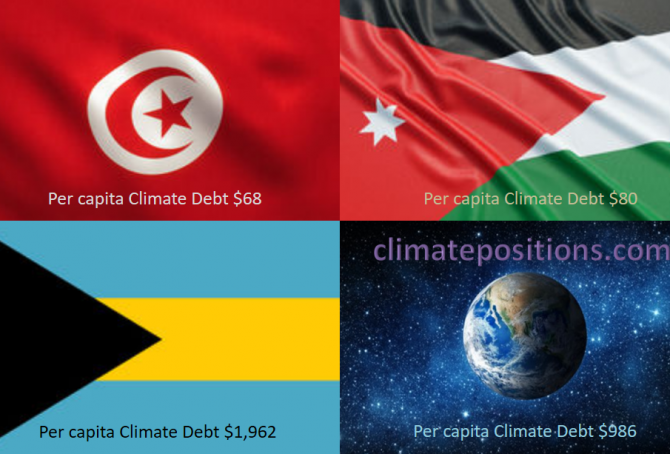
Share of global Climate Debt rank 76th, 77th and 78th: Tunisia, Bahamas and Jordan (combined responsible for 0.03% of Climate Debt and 0.16% of Fossil CO2 Emissions 2016)
2018
The diagram below shows ‘Share of global Climate Debt‘ in 2010, 2015 and 2017 of Tunisia, Bahamas and Jordan (ranked 76th, 77th and 78th). The share of Tunisia is continuously declining, whereas the shares of Bahamas and Jordan are uneven.
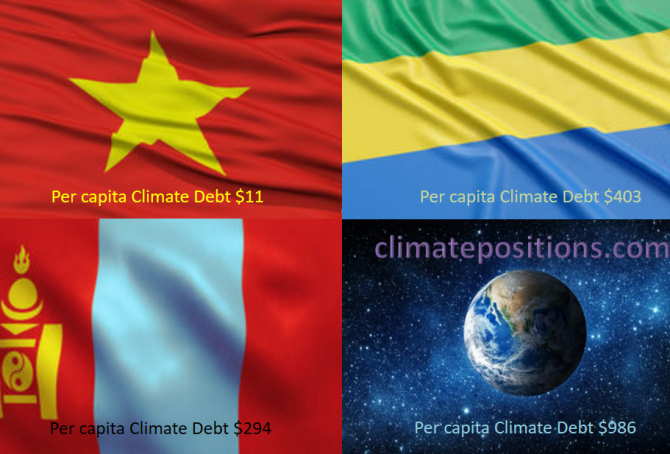
Share of global Climate Debt rank 73rd, 74th and 75th: Vietnam, Mongolia and Gabon (combined responsible for 0.04% of Climate Debt and 0.64% of Fossil CO2 Emissions 2016)
2018
The diagram below shows ‘Share of global Climate Debt‘ in 2010, 2015 and 2017 of Vietnam, Mongolia and Gabon (ranked 73rd, 74th and 75th). The shares of Vietnam and Mongolia are both growing continuously. Vietnam and Gabon had zero Climate Debt in 2010.

Share of global Climate Debt rank 70th, 71st and 72nd: Equatorial Guinea, Panama and Dominican Republic (combined responsible for 0.05% of Climate Debt and 0.10% of Fossil CO2 Emissions 2016)
2018
The diagram below shows ‘Share of global Climate Debt‘ in 2010, 2015 and 2017 of Equatorial Guinea, Panama and Dominican Republic (ranked 70th, 71st and 72nd). The share of Panama is continuously growing, whereas the shares of Equatorial Guinea and Dominican Republic are uneven.
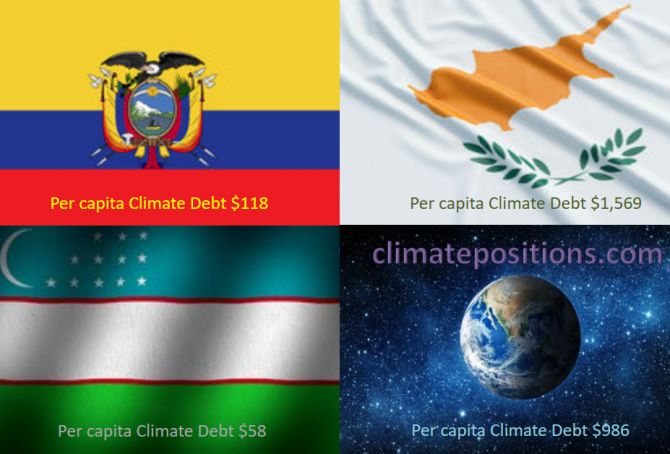
Share of global Climate Debt rank 67th, 68th and 69th: Ecuador, Uzbekistan and Cyprus (combined responsible for 0.08% of Climate Debt and 0.44% of Fossil CO2 Emissions 2016)
2018
The diagram below shows ‘Share of global Climate Debt‘ in 2010, 2015 and 2017 of Ecuador, Uzbekistan and Cyprus (ranked 67th, 68th and 69th). The share of Cyprus is continuously decreasing.
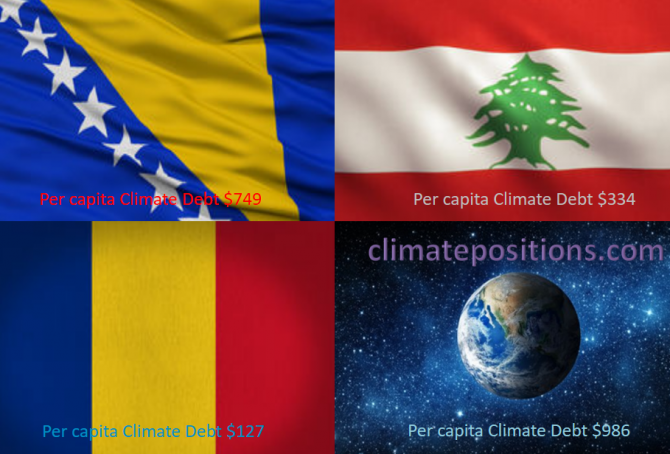
Share of global Climate Debt rank 64th, 65th and 66th: Bosnia and Herzegovina, Romania and Lebanon (combined responsible for 0.10% of Climate Debt and 0.35% of Fossil CO2 Emissions 2016)
2018
The diagram below shows ‘Share of global Climate Debt‘ in 2010, 2015 and 2017 of Bosnia and Herzegovina, Romania and Lebanon (ranked 64th, 65th and 66th). The shares of Romania and Lebanon are ups and downs, while the share of Bosnia and Herzegovina is steadier.
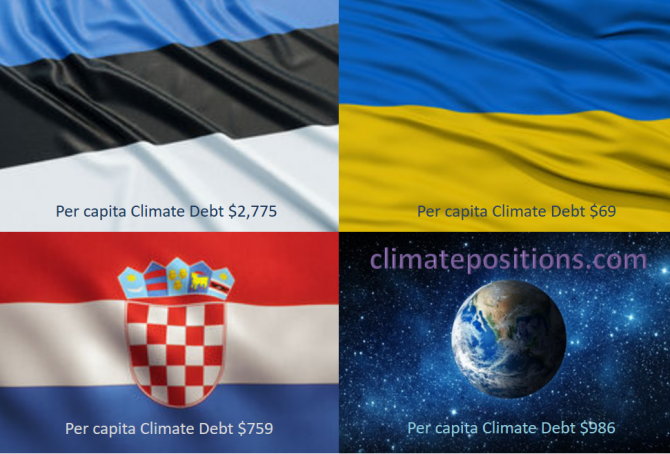
Share of global Climate Debt rank 61st, 62nd and 63rd: Estonia, Croatia and Ukraine (combined responsible for 0.14% of Climate Debt and 0.77% of Fossil CO2 Emissions 2016)
2018
The diagram below shows ‘Share of global Climate Debt‘ in 2010, 2015 and 2017 of Estonia, Croatia and Ukraine (ranked 61st, 62nd and 63rd). The shares of Estonia and Ukraine are increasing, whereas the share of Croatia is decreasing.