Climate Positions
About
Climate Debt A-Z
Climate Debt Per Capita
Climate Debt Total
Calculation (Excel)
Sources
Contact
Climate Debt worldwide
19
Feb
by
Claus Andersen
in /
Biodiversity
/
Climate Debt
/
CO2 Emissions
/
Funding and losses
/
Nuclear Power
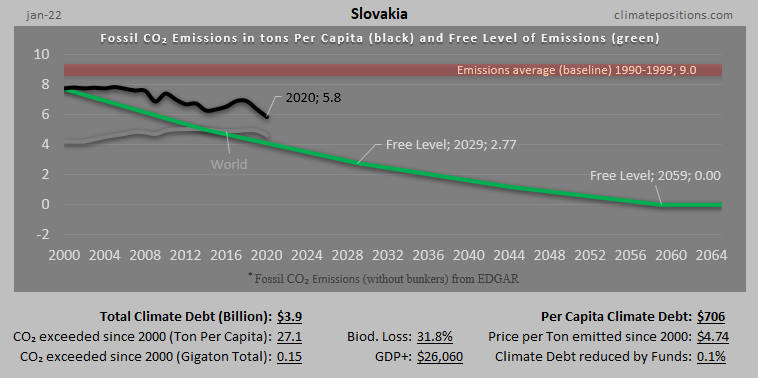
Climate Debt of Slovakia: $3856 Million ($706 Per Capita)
/ Read Article /
19
Feb
by
Claus Andersen
in /
Biodiversity
/
Climate Debt
/
CO2 Emissions
/
Nuclear Power
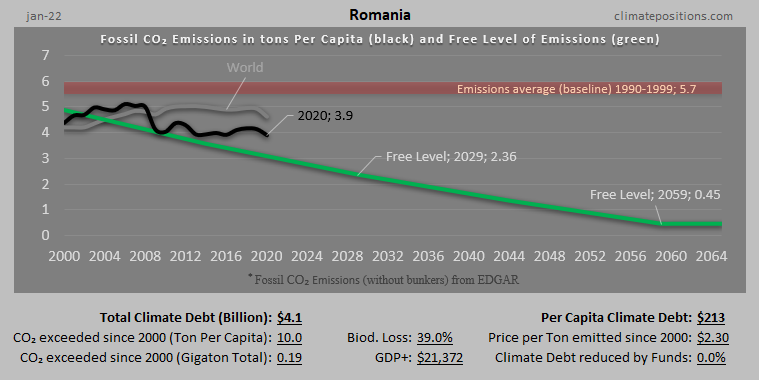
Climate Debt of Romania: $4111 Million ($213 Per Capita)
/ Read Article /
18
Feb
by
Claus Andersen
in /
Biodiversity
/
Climate Debt
/
CO2 Emissions
/
Nuclear Power
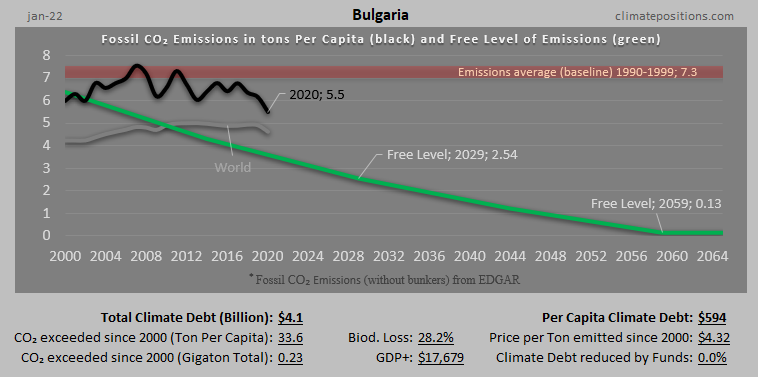
Climate Debt of Bulgaria: $4116 Million ($594 Per Capita)
/ Read Article /
18
Feb
by
Claus Andersen
in /
Biodiversity
/
Climate Debt
/
CO2 Emissions
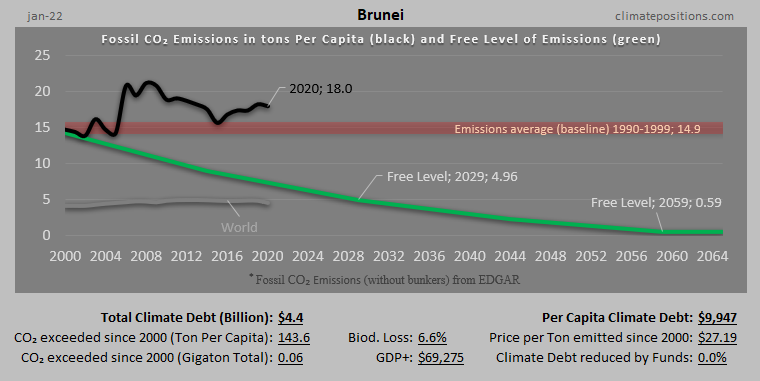
Climate Debt of Brunei: $4352 Million ($9947 Per Capita)
/ Read Article /
18
Feb
by
Claus Andersen
in /
Biodiversity
/
Climate Debt
/
CO2 Emissions
/
Funding and losses
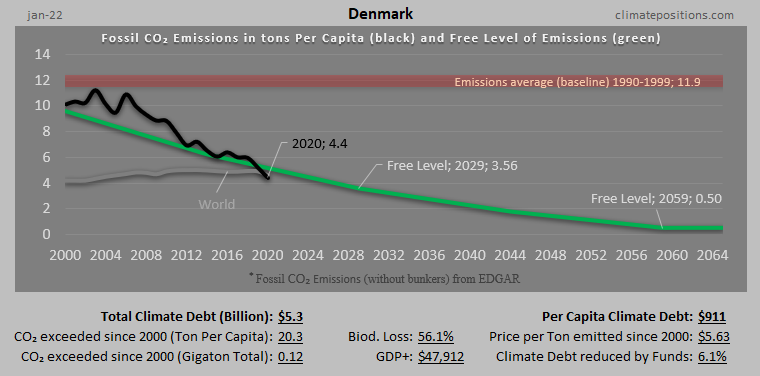
Climate Debt of Denmark: $5313 Million ($911 Per Capita)
/ Read Article /
17
Feb
by
Claus Andersen
in /
Biodiversity
/
Climate Debt
/
CO2 Emissions
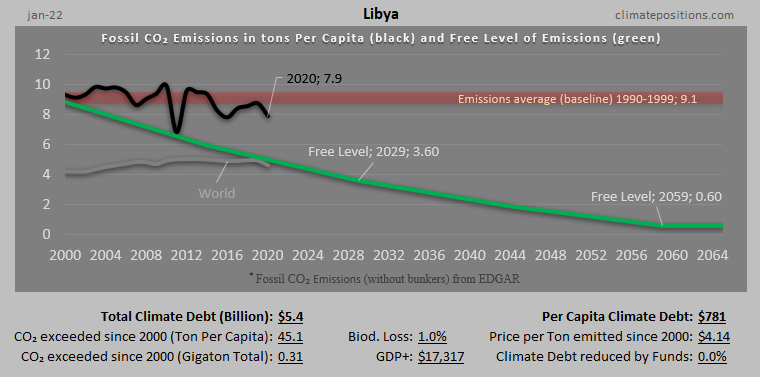
Climate Debt of Libya: $5370 Million ($781 Per Capita)
/ Read Article /
17
Feb
by
Claus Andersen
in /
Biodiversity
/
Climate Debt
/
CO2 Emissions
/
Funding and losses
/
Nuclear Power
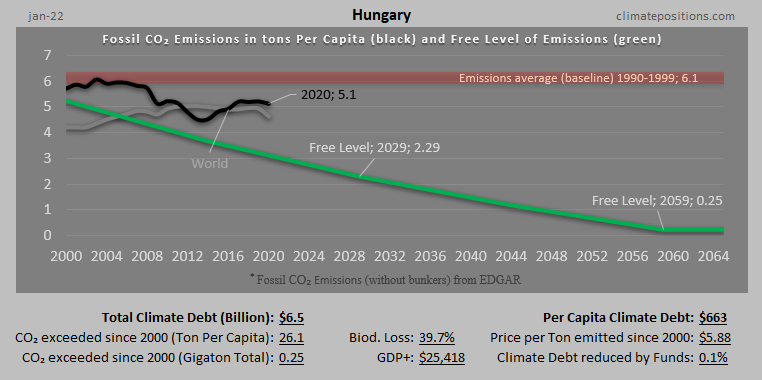
Climate Debt of Hungary: $6460 Million ($663 Per Capita)
/ Read Article /
17
Feb
by
Claus Andersen
in /
Biodiversity
/
Climate Debt
/
CO2 Emissions
/
Funding and losses
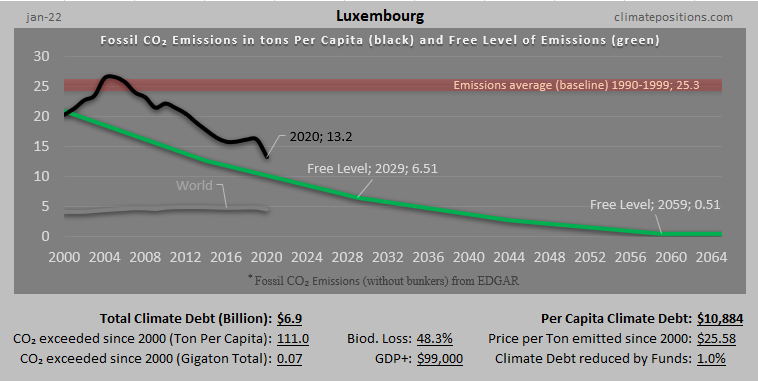
Climate Debt of Luxembourg: $6882 Million ($10884 Per Capita)
/ Read Article /
16
Feb
by
Claus Andersen
in /
Biodiversity
/
Climate Debt
/
CO2 Emissions
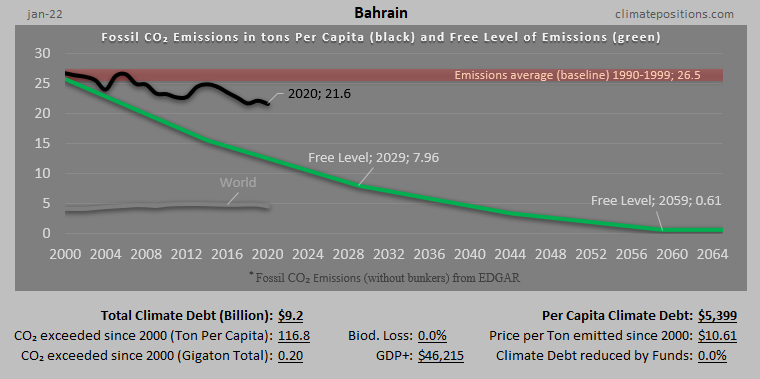
Climate Debt of Bahrain: $9186 Million ($5399 Per Capita)
/ Read Article /
16
Feb
by
Claus Andersen
in /
Biodiversity
/
Climate Debt
/
CO2 Emissions
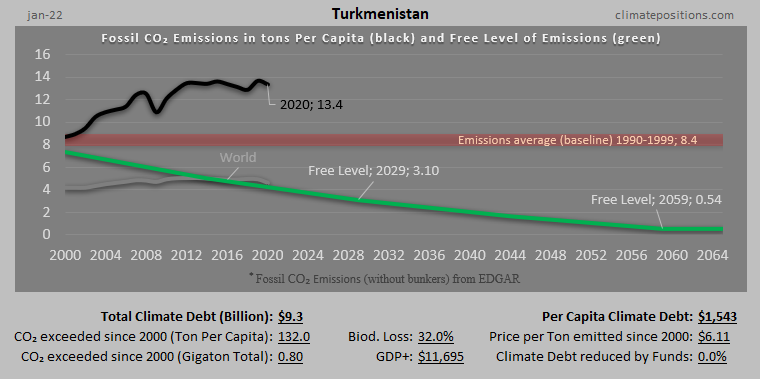
Climate Debt of Turkmenistan: $9309 Million ($1543 Per Capita)
/ Read Article /
16
Feb
by
Claus Andersen
in /
Biodiversity
/
Climate Debt
/
CO2 Emissions
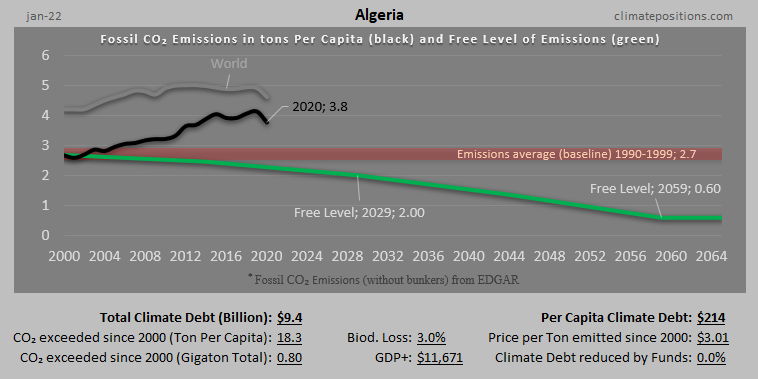
Climate Debt of Algeria: $9365 Million ($214 Per Capita)
/ Read Article /
15
Feb
by
Claus Andersen
in /
Biodiversity
/
Climate Debt
/
CO2 Emissions
/
Funding and losses
Climate Debt of Portugal: $9864 Million ($957 Per Capita)
/ Read Article /
15
Feb
by
Claus Andersen
in /
Biodiversity
/
Climate Debt
/
CO2 Emissions
Climate Debt of Serbia: $10 Billion ($1471 Per Capita)
/ Read Article /
15
Feb
by
Claus Andersen
in /
Biodiversity
/
Climate Debt
/
CO2 Emissions
/
Funding and losses
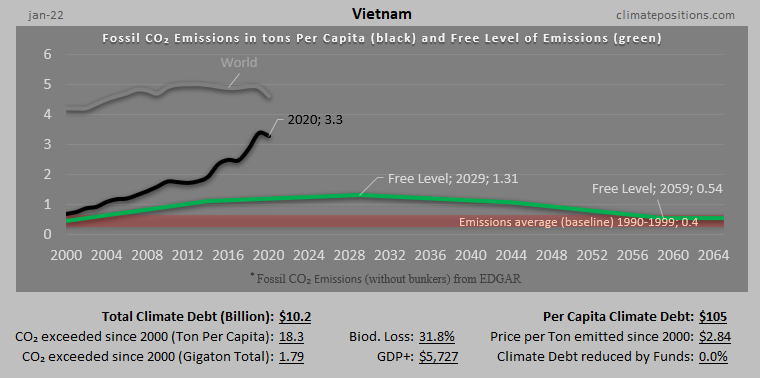
Climate Debt of Vietnam: $10 Billion ($105 Per Capita)
/ Read Article /
14
Feb
by
Claus Andersen
in /
Biodiversity
/
Climate Debt
/
CO2 Emissions
/
Funding and losses
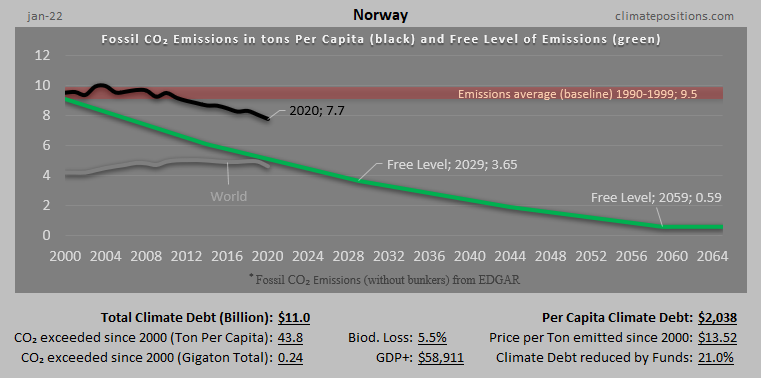
Climate Debt of Norway: $11 Billion ($2038 Per Capita)
/ Read Article /
14
Feb
by
Claus Andersen
in /
Biodiversity
/
Climate Debt
/
CO2 Emissions
/
Funding and losses
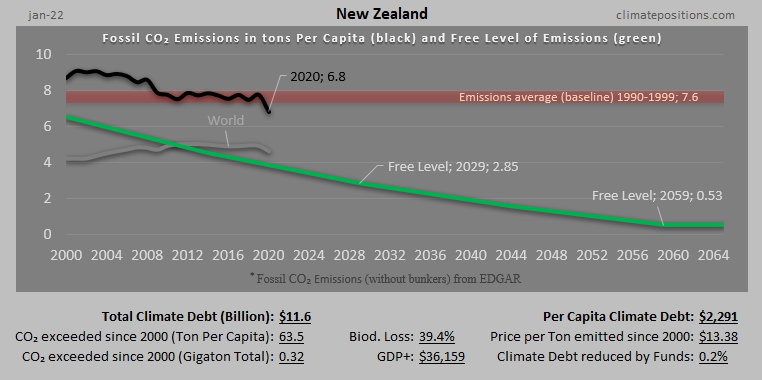
Climate Debt of New Zealand: $12 Billion ($2291 Per Capita)
/ Read Article /
14
Feb
by
Claus Andersen
in /
Biodiversity
/
Climate Debt
/
CO2 Emissions
/
Funding and losses
/
Nuclear Power
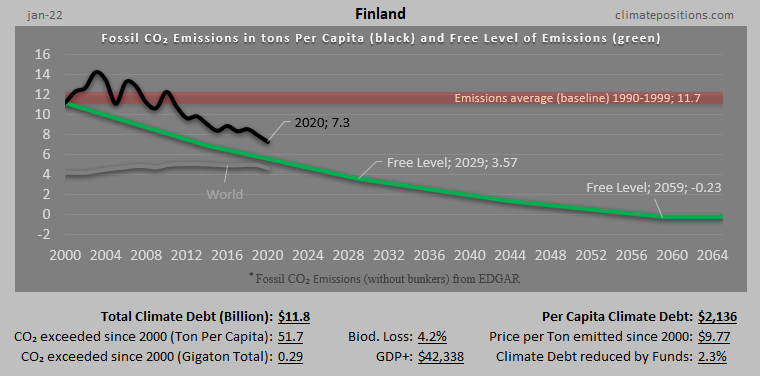
Climate Debt of Finland: $12 Billion ($2136 Per Capita)
/ Read Article /
13
Feb
by
Claus Andersen
in /
Biodiversity
/
Climate Debt
/
CO2 Emissions
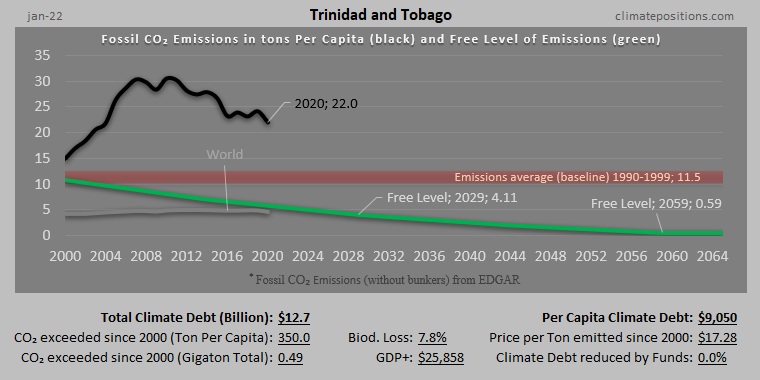
Climate Debt of Trinidad and Tobago: $13 Billion ($9050 Per Capita)
/ Read Article /
13
Feb
by
Claus Andersen
in /
Biodiversity
/
Climate Debt
/
CO2 Emissions
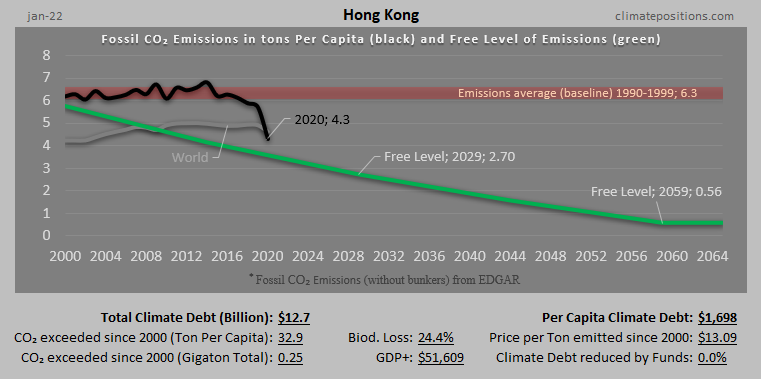
Climate Debt of Hong Kong: $13 Billion ($1698 Per Capita)
/ Read Article /
13
Feb
by
Claus Andersen
in /
Biodiversity
/
Climate Debt
/
CO2 Emissions
/
Funding and losses
/
Nuclear Power
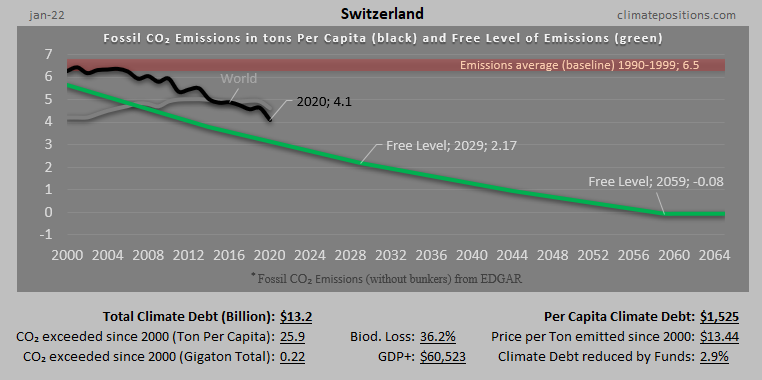
Climate Debt of Switzerland: $13 Billion ($1525 Per Capita)
/ Read Article /
Translator
Post topics
Biodiversity
(177)
Boycotts and Sanctions
(3)
Carbon cycle
(16)
Climate Debt
(464)
CO2 Content in the atmosphere
(15)
CO2 Emissions
(501)
Countries with incomplete data
(11)
Democratic Index
(8)
Divestment from Fossil Fuels
(8)
Ecological Footprint
(109)
Environmental Performance
(72)
Forest
(87)
Fracking
(3)
Funding and losses
(236)
GDP(ppp-$)
(293)
Global Sea Level
(11)
Global Temperature
(17)
History of global warming
(6)
Income Equality
(4)
Indicator updates
(42)
Lawsuits
(5)
Methane
(7)
Negotiating positions
(16)
Nuclear Power
(106)
Population
(79)
Religion
(2)
Renewable energy
(9)
Research
(23)
Website info
(13)
Countries and Regions
Algeria
Angola
Arab Emirates
Argentina
Australia
Austria
Bahamas
Bahrain
Bangladesh
Barbados
Belarus
Belgium
Bhutan
Bolivia
Bosnia and Herzegovina
Botswana
Brazil
Brunei
Bulgaria
Canada
Chile
China
Colombia
Costa Rica
Croatia
Cyprus
Czech Republic
Denmark
Dominican Republic
Ecuador
Egypt
Equatorial Guinea
Estonia
European Union
Finland
France
Gabon
Germany
Greece
Guatemala
Guyana
Honduras
Hungary
India
Indonesia
Iran
Iraq
Ireland
Israel
Italy
Jamaica
Japan
Jordan
Kazakhstan
Kuwait
Lebanon
Libya
Luxembourg
Macedonia
Malaysia
Mauritius
Mexico
Mongolia
Morocco
Netherlands
New Zealand
Norway
Oman
Panama
Peru
Philippines
Poland
Portugal
Qatar
Romania
Russia
Saudi Arabia
Serbia
Singapore
Slovakia
Slovenia
South Africa
South Korea
Spain
Suriname
Sweden
Switzerland
Thailand
Trinidad and T.
Tunisia
Turkey
Turkmenistan
Ukraine
United Kingdom
United States
uruguay
Uzbekistan
Venezuela
Vietnam
World