
Polynomial projections of global warming 1880-2014 … 2130
2015
The global Land (air) Temperature of 2014 was the 4th warmest ever measured. Both the global Ocean (air) Temperature and the combined Ocean and Land Temperature of 2014 were the warmest ever measured (see ‘here‘).
A ‘polynomial projection’ (or polynomial interpolation) of temperature is neither a prediction nor a scientific scenario with certain assumptions. A polynomial projection reproduces data into the future in a sounder manner than a linear projection. The five diagrams below show the global Land (air) Temperature since 1880 with polynomial projections from 1980, 1990, 2000, 2010 and 2014 … projected by 2130. The red projection line start at 0°C in 1880 and the passing-years of 1°C, 2°C, 3°C etc. are marked. Read the comments below the diagrams.
Climate finance to developing countries compared to climate debt by country
2015
The independent website ‘Climate Funds Update’ provides information on international climate finance initiatives designed to help developing countries address the challenges of climate change. By comparing the present climate funding (money deposited¹ by January 2015) to the accumulated national Climate Contributions (climate debt) in ClimatePositions the mismatch between climate debt and payments are exposed. The 82 countries in the table below are ranked by Climate Funding (financing) as percentage of the Climate Contributions … 48 of the countries have paid zero!

65 Contribution Free countries…GDP-ranked (with Income Equality, Life Expectancy and Environmental Performance)
2014
65 out of 147 countries with full data in ClimatePositions are Contribution Free (no climate debt). 41% of the world’s population lives in these Contribution Free countries and they emitted only 9% of the global carbon dioxide from fossil fuels in 2012 – without India the corresponding figures are 24% of the global population and 3% of the emissions.
The table below shows the 65 Contribution Free countries ranked by GDP(ppp-$) per capita, with Income Equality (‘Atkinson Index‘), Life Expectancy and Environmental Performance. The world’s average GDP(ppp-$) per capita was $13.791 in 2012. Analysis and comments see below the table – the color codes are explained in the bottom.
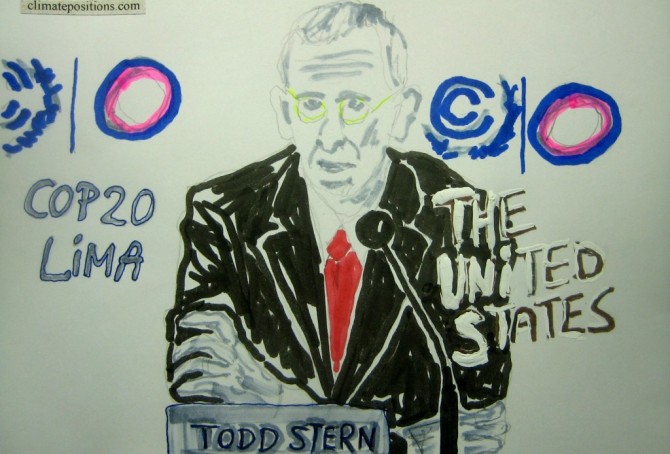
COP20 in Lima: Derailed negotiations and depressed scientists
2014
Since ‘COP1 in Berlin’ in 1995 the global CO2 Emissions from fossil fuels have increased by 50% (in addition to increased greenhouse gas emissions from deforestation, cement production, melting permafrost, etc.). The purpose of COP1, COP2, COP3, COP4, COP5, COP6, COP7, COP8, COP9, COP10, COP11, COP12, COP13, COP14, COP15, COP16, COP17, COP18 and COP19 were to reduce dangerous greenhouse gases and counteract global warming. The current COP20 in Lima builds on twenty years of mushrooming in a flawed system without tools to secure meaningful negotiations and reject derailments caused by powerful nations such as the United States and China. Meanwhile, depression¹ is spreading from climate scientists to larger parts of the planet’s population.
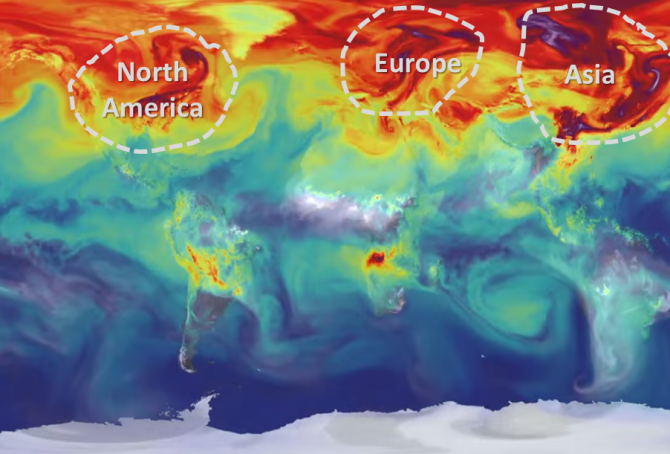
NASA video showing one year of carbon dioxide emissions swirling in the atmosphere
2014
‘NASA’ has released this simulated ‘video 3:10’ showing the global carbon dioxide emissions in 2006 in three minutes. The simulation illustrates plumes of CO2 swirling and shifting as winds disperse the emissions away from its sources. The animation also shows the swings in concentrations as the growth cycle of plants and trees changes with the seasons. ‘CO Emissions’ (monoxide) from forest fires are also visualized in the video.
Since 2006 the global CO2 Emissions from fossil fuels have increased by 14% and the CO2 content in the atmosphere has increased from 382 ppm in 2006 to 396 ppm in 2013. Below are ranked the twenty countries¹ with the largest CO2 Emissions per capita in 2012, with the climate dept per capita and the percentage of the global Climate Contribution (climate debt). The calculations of climate debt and the data of all countries are available in the menu ‘Calculations (Excel)’.
New ranking 2014 – update of 147 countries’ climate debt
2014
The data in ClimatePositions are updated consecutively and since the data year 2010 the eleven ‘indicators’ have all been updated.
The new rankings of 147 countries are now available in the menu “Contributions” (with six categories).
All country data and diagrams are available in the menu ‘Calculations (Excel)’. In the coming months selected countries will be analyzed in articles. The following illustrates the latest updates in two ways: 1) The change of climate debt as a percentage of the global climate debt of the twelve largest CO2 emitters, and 2) The key-figures of the United Kingdom.

IPCC worst case scenarios from 1990 and 2014 (in comparison with the actual global warming)
2014
In October 2014 IPCC’s Fifth Assessment Synthesis Report 2014 was released (IPCC = Intergovernmental Panel on Climate Change). The Summary for Policymakers (40 pages), the Headline Statements (2 pages), the Presentation (PowerPoint, 26 dias) and a Longer Report (116 pages) are available ‘here’. The four sub-reports 2013-2014 (a total of 5622 pages) are available ‘here’. The presentation of the gloomy message is overwhelming and totally confusing to common people (is that really necessary?).
Carbon dioxide emissions 2013 – China, the United States, India and Russia
2014
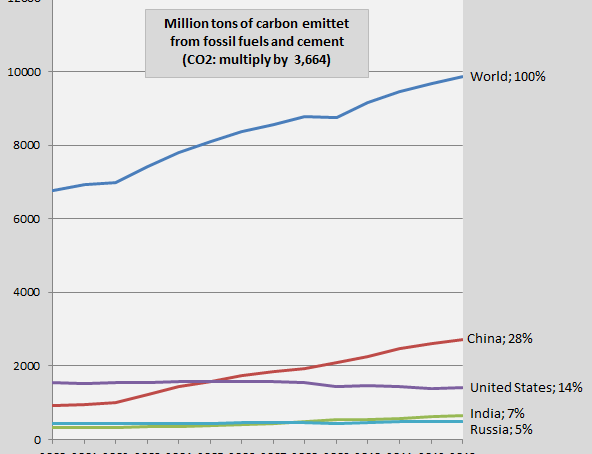
The diagram shows the global development of carbon dioxide emissions from fossil fuels and cement 2000-2013 (measured by pure carbon) and of the four largest emitters China, the United States, India and Russia. The 2013-emissions are preliminary with an enlarged uncertainty of ±5%. The national shares of the global emissions in 2013 are shown in percent to the right. The four countries accounted for 54% of the global emissions in 2013 (48% in 2000). The preliminary carbon dioxide emissions in 2013 of 216 countries is available ‘here’¹. Global emissions are on track of the worst out of four scenarios, likely heading for 3.2-5.4°C increase in temperature by 2100, since pre-industrial era (see the diagram below from ‘Global Carbon Project’, and ‘presentation (pdf)‘.
Carbon cycle for beginners
2014
Carbon is one out of 118 known chemical elements and symbolized with a “C” (as in CO2). Carbon is globally spread and essential for all life (18.5% of the human body mass is carbon). However, only around 0.003% of the carbon on earth is within living organisms and possibly the double occur in ancient organic deposits of coal, oil, gas and peat. Pure carbon can be chemically composed several ways, for example in the form of diamond, graphite, graphene or simply as amorphous carbon. See this short instructive video: ‘Carbon – Periodic Table of Videos (10:02)’. Carbon forms almost ten million known compounds with other chemical components, which is more than any other chemical element. Carbon dioxide (or CO2) is one compound, composed of one atom of carbon (C) and two atoms of oxygen (O2). Methane (or CH4) is another, composed of one atom of carbon and four atoms of hydrogen.

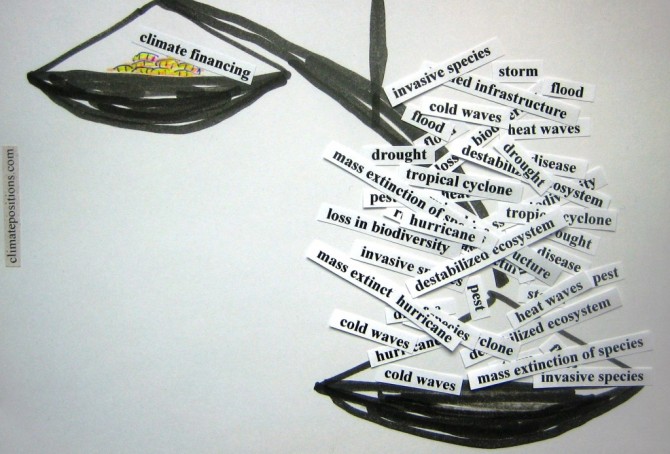
Invasive species, climate change and mass extinction
2014
There is a lack of standard terminology for invasive species. Some used definitions¹ seem artificially twisted so that Homo sapiens can’t be classified as an invasive species (which of cause is absurd since we are the worst). My own definition used in this article is this: “Invasive species are animals and plants introduced into places out of their natural range of distribution, where they have a tendency to spread and generate a negative impact on the local ecosystem and species.” This clarifies three disputes: a) A species can be invasive and not invasive at different times and different places, b) consequently, not all Homo sapiens are necessarily invasive, and certainly not all the time and c) transportation by plane, ship, train, vehicle, etc. often carry animals (including Homo sapiens) and plants further than their natural range of distribution. This opens up for analyzes.
Forest Cover, Primary Forests and climate debt
2014
The national data of Forest Cover and Primary Forest are both included in the calculations of Climate Contributions (debt) in ClimatePositions. Primary Forest was included as an indicator in the worksheet in August 2014. The following describes selected findings on forests from FAO’s ‘The Global Forest Resources Assessments (FRA), 2010’ (main report, pdf, 378 pages). The Assessment is based on two primary sources of data: 1) ‘country reports’ and 2) remote sensing conducted by FAO and partners.
Methane, greenhouse effect and feedback loops
2014
Methane (CH4) is the third most prevalent greenhouse gas after carbon dioxide (CO2) and water vapor. Approximately one fifth of the anthropogenic greenhouse gas effect is caused by methane and slightly over half of the total methane emissions are due to human activity¹. The data of methane and carbon dioxide in the atmosphere since 1980 is available ‘here’. Since the 1800s, atmospheric methane concentrations have increased annually at a rate of about 0.9% (doubled in 200 years) and the present concentration has not been higher for over 800,000 years (see the atmospheric contrations ‘here‘). However, 3-4 billion years ago there was 1,000 times more methane in the atmosphere and oxygen did not become a major part of the atmosphere until photosynthetic organisms evolved later in the world’s history. The following gives a brief introduction to methane with emphasis on the interaction with carbon dioxide and the potential global warming feedback loops.

Personal CO2 Emissions and instant reductions
2014
People ask: What can I do to reduce emissions? The following describes various sources of personal CO2 Emissions and suggest some instant reductions. In the bottom is a list of the 80 worst performing countries in ClimatePositions and their Contribution Free Level of CO2 Emissions per capita by 2014. By comparing the Contribution Free Level (for example 5.1 tons per person in the United Kingdom) and the effect of your personal reductions you get an idea of climate sustainability. In this way, you can calculate your own “carbon footprint” and then compare that with the calculated Contribution Free Level.
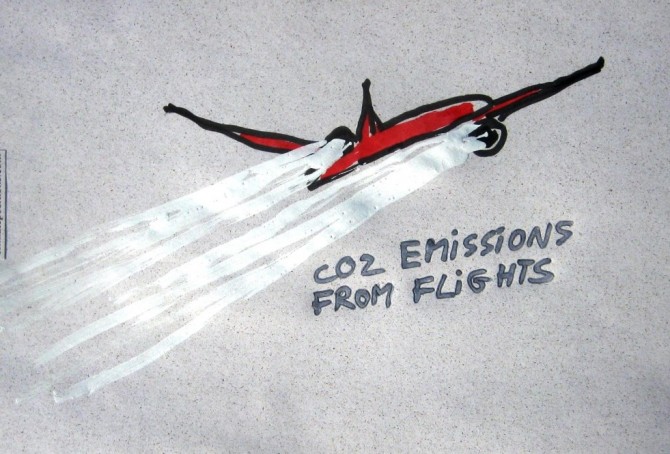
CO2 Emissions from flights
2014
Since the early 1990s the passenger-kilometers of flights worldwide has increased by 5-6% per year. The CO2 Emissions (carbon dioxide) per passenger kilometer vary due to difference in flight distances¹, aircrafts and load factors (percent of occupied seats) – with average load factors First Class and Business Class are causing nine- and three-times higher emissions per passenger than Economy Class, as one study suggests². Furthermore the mixed exhaust from flights causes 2-4 times more global warming than only CO2 emitted from engines on the ground³. The accumulated climate-effect from flights might be as high as 7-9% of the total effect from anthropogenic greenhouse gases4. However, the following examines only the CO2 Emissions from flights and the implied national costs in Climate Contributions (climate debt). But first see these three seductive animations (from ‘nats‘) with 24-hours flights over ‘Europe 1:59‘, ‘Middle East 1:11‘ and ‘North Atlantic 1:52‘.
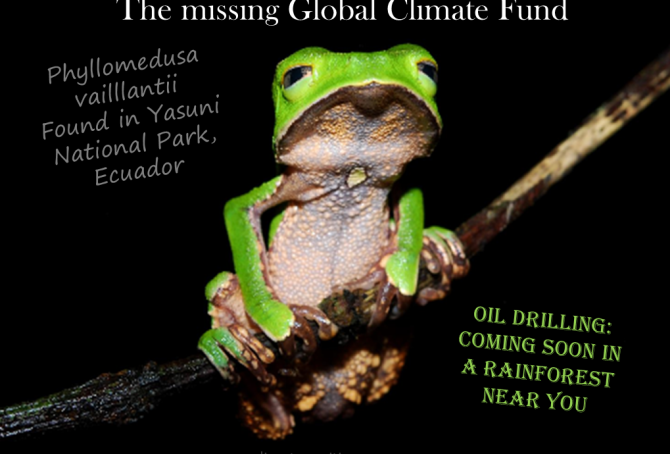
The missing Global Climate Fund
2014
When the necessary climate change financing is secured on a global scale (in our dreams) the paid Climate Contributions must be spent wisely and fair … but how and decided by whom? Well, the incriminated nations that burned fossil fuels excessively for decades knowing that it destroys the climate worldwide can’t be legitimate decision-making participants in the creation of a Global Climate Fund. Only Contribution Free countries can (including those who have paid their climate debt). The opposite seems to be the case in the everlasting and fruitless United Nations COP process.

Videos about Global Warming
2014
Climate Change science is one thing, but dissemination of quality information through the media is another. Below you will find thirteen selected free videos on various topics related to Global Warming. Film and video make the often technical discussion around Climate Change more accessible and dramatic. If after reviewing the videos you are curious to know which countries are the most resistant to reason, you can see the country ranking ‘here‘.
NOAA Research (Earth System Research Laboratory): “Time history of atmospheric Carbon Dioxide from 800,000 years ago until January 2012”: ‘video 3:35‘.

Climate change performance and religious beliefs
2014
Nothing suggests that religiosity is a brake on the ongoing climate destruction caused by humans – simply because 84% of the global population is considered more or less religious. The following looks at the possible correlation between Climate Contribution (climate debt) and the world religions: Christianity, Islam, Hinduism and Buddhism – and Other Religions and the Residual Group (including non-religious). All figures must be interpreted with great caution due to uncertainties and dilemmas in the compilation methods.
CO2 reduction targets worldwide
2014
Countless proposals have been launched during the years for the required reductions in CO2 Emissions. However, most of the suggested reduction targets have been empty statements and the overall scientific recommendations¹ are persistently being ignored by those in power. Meanwhile the global CO2 Emissions continue to increase (by 52% since 1990) and the worst case climate scenario is now unfolding.

Pisa scores, CO2 Emissions and climate debt
2014
510,000 15-year old students from 65 countries were Pisa tested and ranked in Mathematics, Reading and Science in 2012. The following compares the average Pisa scores with 1) CO2 Emissions per capita and 2) Increase in Climate Contributions (climate debt) since 2010. The question is this: Do the countries which successfully emphasize “clever students” also emphasize climate responsibility and reductions in CO2 Emissions? Or may the student’s impressive skills be aimed at other national goals, such as economic growth?

Global losses due to climate change
2014
Manmade climate change leads to increased frequency, intensity and duration of extreme weather events. The global losses due to climate change are of course impossible to quantify but the losses accumulated by global reinsurance companies¹ may provide a clue of the seriousness of the situation. The two diagrams below show statistics of ‘Swiss Re’ (see this ‘release’) and ‘Munich Re’ (from The World Bank Report ‘Building Resilience’). The overall picture is similar: Global losses due to extreme weather events have increased dramatically since the 1980s and are now around $150-200 billion annually.