
Pisa scores, CO2 Emissions and climate debt
2014
510,000 15-year old students from 65 countries were Pisa tested and ranked in Mathematics, Reading and Science in 2012. The following compares the average Pisa scores with 1) CO2 Emissions per capita and 2) Increase in Climate Contributions (climate debt) since 2010. The question is this: Do the countries which successfully emphasize “clever students” also emphasize climate responsibility and reductions in CO2 Emissions? Or may the student’s impressive skills be aimed at other national goals, such as economic growth?

Global losses due to climate change
2014
Manmade climate change leads to increased frequency, intensity and duration of extreme weather events. The global losses due to climate change are of course impossible to quantify but the losses accumulated by global reinsurance companies¹ may provide a clue of the seriousness of the situation. The two diagrams below show statistics of ‘Swiss Re’ (see this ‘release’) and ‘Munich Re’ (from The World Bank Report ‘Building Resilience’). The overall picture is similar: Global losses due to extreme weather events have increased dramatically since the 1980s and are now around $150-200 billion annually.

Outsourcing of CO2 Emissions from the United States to China
2014
If the United States reduced the CO2 Emissions produced inside its borders and the dirty productions as a competitive consequence moved to China (or elsewhere), the positive impact on the climate would vanish. This obvious dilemma can only be solved if both countries sign a binding climate agreement with solid and fair CO2 Emission targets – which the two countries reject (read more on their COP positions ‘here’). The position of the United States is particularly perverted: 1) Reduction-targets of national CO2 Emissions must be voluntary and 2) Investments in climate actions must be profitable. The bizarre U.S. vision is to create a new global commercial market for voluntary climate investments, a commercial market with parallels to the United States, the homeland of the climate chaos.
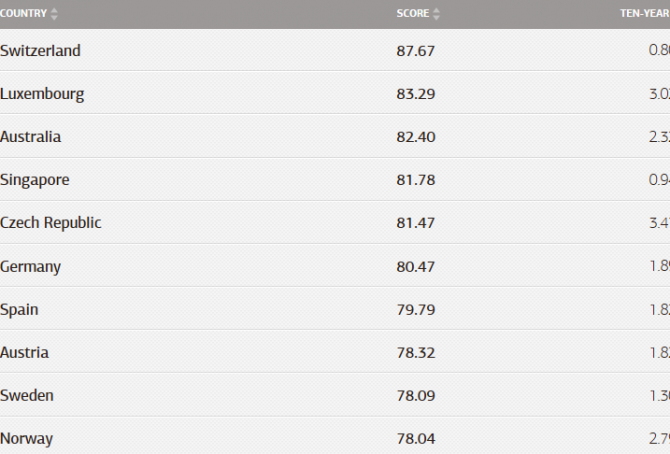
Environmental Performance Index 2014: Rankings of 178 countries
2014
Every second year Yale and Colombia Universities, in collaboration with the World Economic Forum, publish an Environmental Performance Index (EPI) with global rankings. The 2014 edition with rankings of 178 countries is now available ‘here’. The top ten countries are shown in the diagram. The Index ranks how well the countries perform on 1) Health Impacts (Air Quality, Water and Sanitation) and 2) Ecosystem Vitality (Water Resources, Agriculture, Forests, Fisheries, Biodiversity and Habitat, Climate and Energy). Underlying the nine issue categories are 20 indicators calculated from country-level data and statistics. Scores are converted to a scale of 0 to 100, with 0 being the worst observed value and 100 the best.
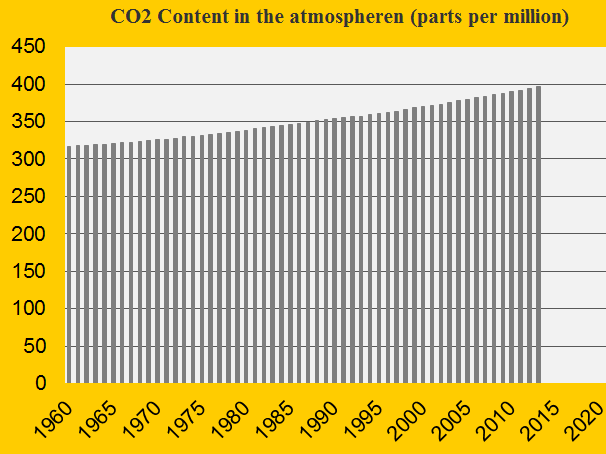
Update 2013 of the CO2 Content in the atmosphere
2014
The CO2 Content in the atmosphere measured in ppm (parts per million) is skyrocketing because of the increase in human-caused emissions. In 2012 the content was 393.82 ppm and in 2013 it was 396.48 (this updated figure is used in ClimatePositions). Some scientists estimate that 350 ppm is the “safe” limit of CO2 in the atmosphere. See the development 1960-2013 in the diagram. This is the main cause of Global Warming, Climate Change (extreme weather phenomena) and rising Sea Level.
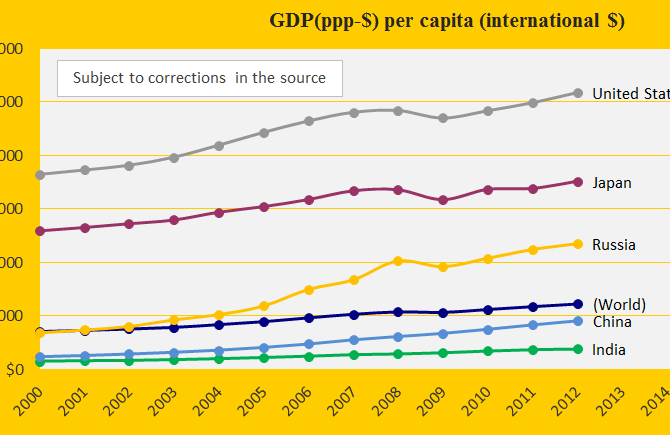
2012 update of GDP in ClimatePositions
2014
The annual national GDP(ppp-$) (standard of living measured by purchasing power) has a direct impact on the Climate Contributions. Updating of GDP for 2011 and 2012 are now entered ClimatePositions (Excel) and for most countries, this means considerable increases in the Climate Contribution (climate debt). In connection with the GDP update, a minor simplification of the calculation method has been made (recent years are still weighted more than previous years in GDP+).
The diagram shows the updated (and revised) GDP(ppp-$) 2000-2012 for the five largest CO2 Emitters: China, United States, Russia, India and Japan.

Global warming: Air Temperature update 2013
2014
2013 was the 4th warmest year recorded of land Air Temperature since measurements began in 1880. See the development 1960-2013 in the diagram (the average temperature rise in 1880-1937 is set at 0°C). The last ten years of average temperature rise is the figure used in ClimatePositions.
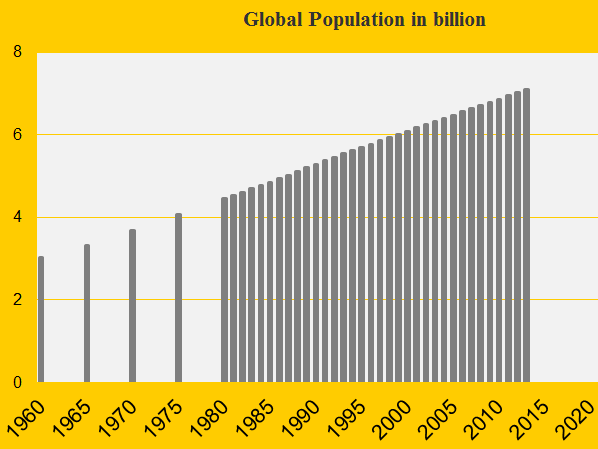
Global Population update 2013
2014
The growing Global Population puts additional pressure on the distressed nature (deforestation, pollution, declining biodiversity, etc.) and increases the total CO2 Emissions. From 2012 to 2013 the population is estimated to have increased from 7.02 to 7.09 billion – an increase of 77 million in one year. See the development 1960-2013 in the diagram.
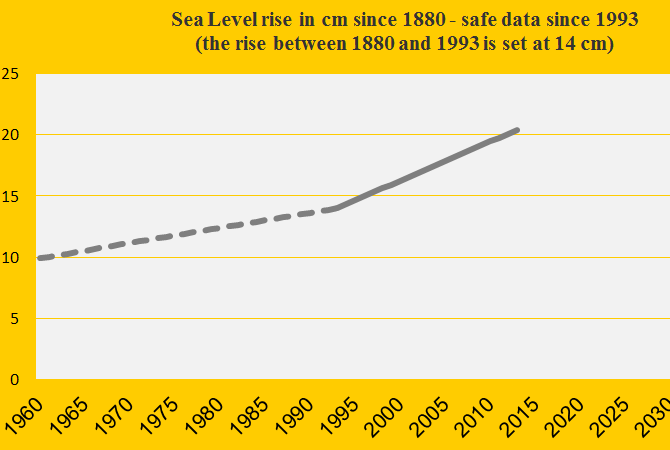
Sea Level update 2013
2014
The measurements of global Sea Level are very complicated and end up in a single figure for average annual Sea Level rise since 1993. From 2012 to 2013, the increase rate is unchanged 0.32 cm annually (since 1993). The total increase between 1880 and 1993 is set at 14 cm (with uncertainty). This adds up to a total Sea Level rise from 1880 to 2013 at 20.40 cm – the figure used in ClimatePositions. See the development in Sea Level 1960-2013 in the diagram (the level in 1880 is set at 0).
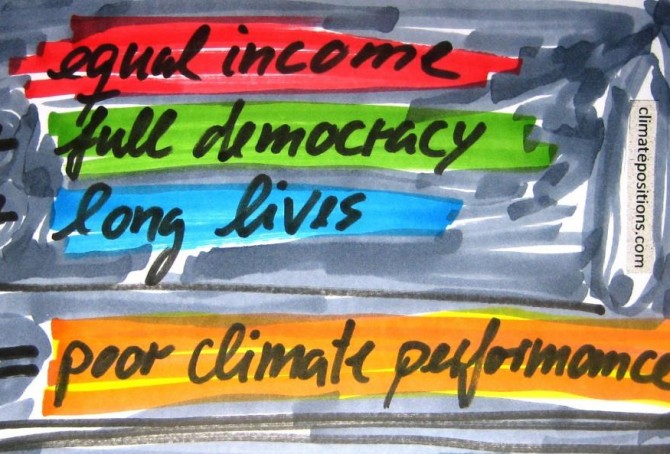
Income Equality, Life Expectancy, Democracy Index … and Climate Contributions
2014
123 out of 145 countries with full data in ClimatePositions are included in an inventory of Income Equality (see the source at the bottom), which shows how much the 10% poorest earns compared to the 10% richest. 53 out of the 123 countries are Contribution Free (no climate debt) in ClimatePositions 2010 and 70 countries are not.
The table below shows the difference between the two groups of countries in terms of Income Equality, Life Expectancy, number of Full Democracies and number of Authoritarian Regimes. To clarify the trend the 20 countries with the largest Climate Contributions appear at the top of the table. The 123 countries represent 95% of the world population.

Country groups and positions at COP19
2013
The negotiation process during COP19 in Warsaw in November 2013 was frustrating and largely fruitless and the following organizations and movements withdrew from the climate conference in protest: ‘Aksyon Klima Pilipinas‘, ‘ActionAid‘, ‘Bolivian Platform on Climate Change‘, ‘Construyendo Puentes‘ (Latin America), ‘Friends of the Earth‘ (Europe), ‘Greenpeace‘, ‘Ibon International‘, ‘International Trade Union Confederation‘, ‘LDC Watch‘, ‘Oxfam International‘, ‘Pan African Climate Justice Alliance‘, ‘Peoples’ Movement on Climate Change‘ (Philippines) and ‘WWF‘.
First step to understanding the inherent conflicts of interest in the COP process would be to examine the nature of the COP country groups (submission groups) – a detailed study of the complex negotiating proces is another matter.
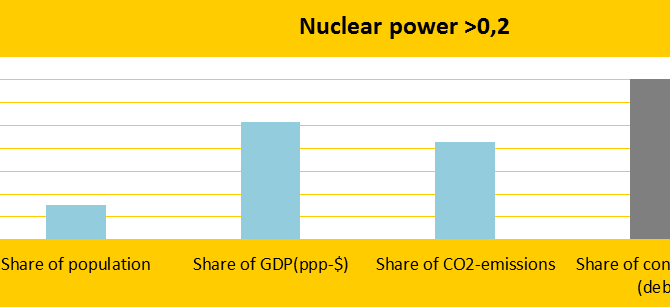
Nuclear Power countries fail on climate responsibility
2013
Seen as a group the top twenty Nuclear Power generating countries (kWh per capita) perform miserable on the climate change challenge. The diagram shows the twenty countries’ total share of the global: 1) Population (15.4%), 2) GDP(ppp-$) (51.5%), 3) CO2 emissions (42.9%) and 4) Contributions (70.6%). The nuclear power counts in calculations of the national Contributions (climate debt) as if the energy was produced with oil.

Questions and answers (6-9)
2013
Question 6: What can you do as a consumer?
Reductions in your consumption of fossil fuels, meat and unneeded items will contribute to limit climate change and ecological decline. Furthermore, you can buy organic (ecological) products if possible. Finally, you can prioritize products from Contribution Free countries and tend to choose products from the better performing countries in ClimatePositions (see the menu “Contributions/Per Capita US$ Rank”). Other important factors than ranking can of course influence your spending choices. Are you poor you can do very little or nothing.

Updated climate change funding worldwide
2013
‘Climate Funds Update‘ is an independent website that provides information on international climate finance initiatives designed to help developing countries address the challenges of climate change. The site is a joint initiative of the ‘Heinrich Böll Stiftung‘ and the ‘Overseas Development Institute‘.

Questions and answers (1-5)
2013
Question 1: Are the contributions in ClimatePositions a valuation of the losses of the planet’s natural heritage?
No, the planet’s nature (biodiversity) is miraculous and priceless. ClimatePositions is a proposal to a fair financial breakdown of the unavoidable additional expenses towards sustainability and climate change actions. The level of Contributions worldwide can be changed with a single entry in the spreadsheet.

Brazil and the world’s rainforests
2013
Brazil was the 63rd worst performing country in ClimatePositions 2010 with a total Climate Contribution (climate debt) of 12.4 billion US$. In the latest calculation the debt has increased to 15.3 billion US$. Between 1990 and 2010 Brazil cut down the total forest cover (mainly rainforest) from 69.0% to 62.4%.

Obama hoping for change
2013
United States is not only notorious for illegal surveillance, waterboarding, illegal wars and imprisonments without trial – the country is also primarily responsible for climate change. While the oceans are rising Barak Obama is hoping for change (see the Sea Level rise in the diagram below).

54 countries with incomplete data
2013
199 countries are included in ClimatePositions (Excel) but 54 countries have incomplete data (0.5% of the Global Population). The front image shows the 20 largest CO2 Emitters (carbon dioxide) per capita in 2011 among the 54 countries. Without full data it is not possible to calculate the national Climate Contribution (climate debt). See the country list below with the missing data mentioned in brackets. Notes that the national Contributions can be estimated by using indicator assumptions – see an example with Bahrain in the bottom.
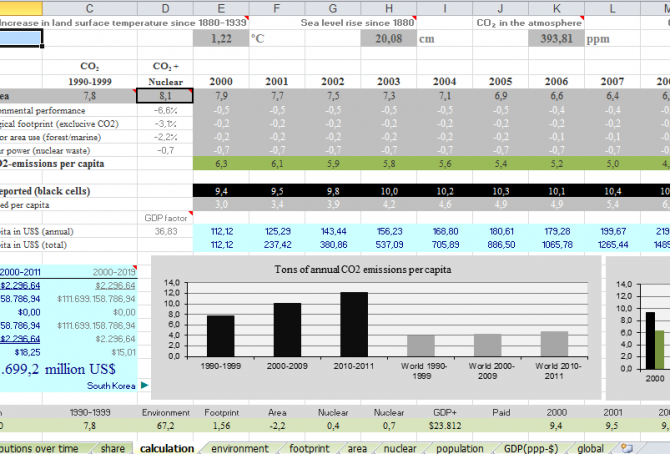
About calculation of national climate contributions
2013
The calculations in ClimatePositions are complex and yet the same for all countries. The progressive national indicator updates since 2000 ensure that the countries multifaceted performances are reflected directly in the Climate Contributions (climate debt). The front image shows the main calculation spreadsheet (Excel) in ClimatePositions. All updated indicator values are entered the spreadsheet and by copying a country from the country list (with all the numerical values) and insert in the country box (cell A30) – all calculations are done automatically and the national Contribution per capita appears (cell B20).
About this website
2013
The resources behind climatepositions.com are independent of economic, political and national interests. The website’s aim is to identify national climate change positions worldwide and thus expose incompetence, hypocrisy and cynicism – and uplifting achievements.