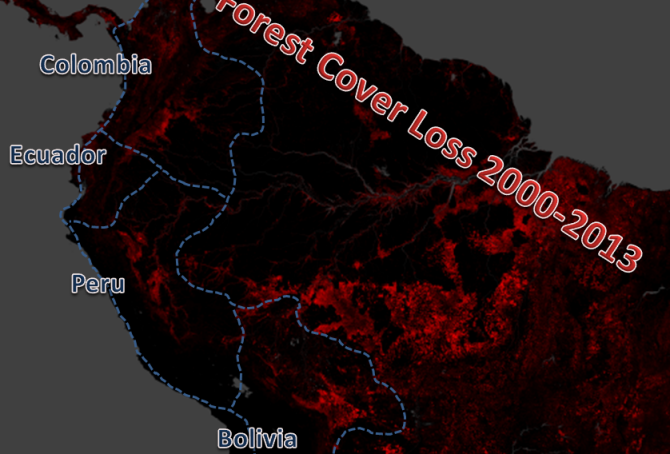
Climate change performance of Ecuador, Bolivia, Colombia and Peru
2015
1.4% of the global population lives in Ecuador, Bolivia, Colombia or Peru, and together they emitted 0.6% of the global CO2 from fossil fuels in 2012. Ecuador’s updated Climate Debt per capita is $84 and Bolivia’s is $18. Colombia and Peru are both Contribution Free. See the ‘ranking’ by November 2014. The following examines the indicators of CO2 Emissions (carbon dioxide from fossil fuels), Forests and GDP(ppp-$).

How green are the fossil fuel producers? (Correlation between fossil fuel production, CO2 Emissions, GDP and Climate Debt)
2015
Greenhouse gas emissions from burning of fossil fuels (oil, natural gas and coal), is the main cause of manmade climate change. Comparable energy potentials of oil, natural gas and coal is defined as “tons oil equivalents”, meaning that the energy released from a given quantity of natural gas or coal is equivalent to one ton of oil. This way the total production of fossil fuels can be expressed in a single figure (not to be confused with market value, global warming potential or general usefulness) The world’s production in million tons oil equivalent, was in 2013: oil (4,130), natural gas (3,041 and coal (3,881).
The table below ranks the twenty countries with the largest per capita fossil fuel production (oil equivalents). Total production data of 68 countries is from ‘BPs Statistical Review of World Energy 2014’ (pdf, 48 pages).
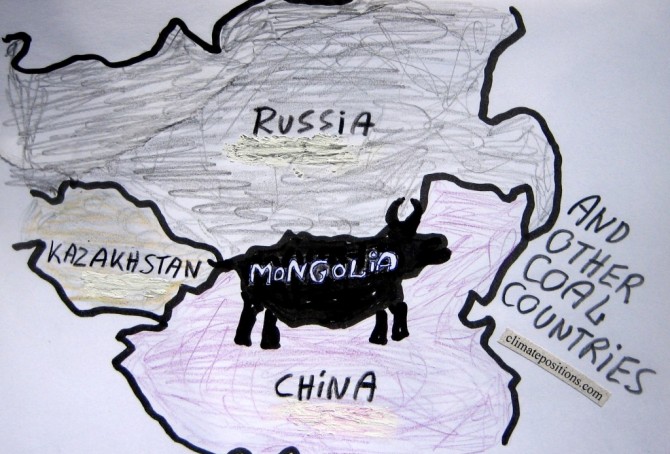
Mongolia and other coal producing countries (the thirteen most coal-dependent countries)
2015
Mongolia is the world’s second largest coal producer per capita (Btu, 2011) and coal is the world’s no. 1 carbon dioxide emitter. However, the flawed democracy (surrounded by the giant authoritarian regimes of China and Russia) is Contribution Free (no Climate Debt) in ClimatePositions – how is this possible?
The table below ranks the thirteen largest per capita coal producers (Btu, 2011), with the world average set at 1.0. The Mongolian coal production is almost ten times larger than the world average. For comparison, the table shows per capita values of CO2 Emissions (from fossil fuels), GDP(ppp-$) and Climate Debt. More comments below the table.
Greenhouse gas emissions and COP negotiation strategies
2015
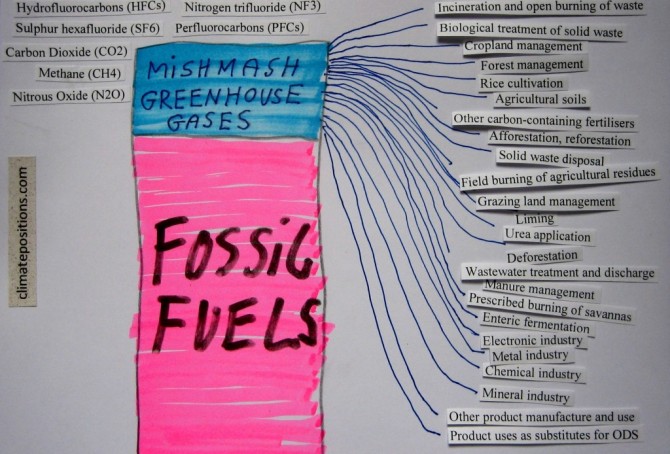
This article is about the different greenhouse gases and what appears to be a delaying COP negotiation strategy on the road to a potentially very costly global greenhouse gas reduction agreement. The essential climate change problem (as I see it) is the greenhouse gas emissions related to fossil fuels. As an example, around 82% of all anthropologic greenhouse gases in the United States are related to coal, oil or natural gas. This measure includes emissions of three different greenhouse gases: carbon dioxide (CO2), methane (CH4) and nitrous oxide (N2O).
Since 1990 the atmospheric concentrations of these three gases has increases by around 13% (carbon dioxide), 7% (methane) and 6% (nitrous oxide). However, the three gases are also emitted from other sources than fossil fuels, including many natural sources … in addition, the potent synthetic fluorinated gases (F-gases) are not related to fossil fuels at all. On a global scale the overall picture is extremely complicated. Note that water vapor is the dominant greenhouse gas among all, but it is not considered relevant to the anthropogenic global warming – and therefore water vapor is usually not regarded as a greenhouse gas.
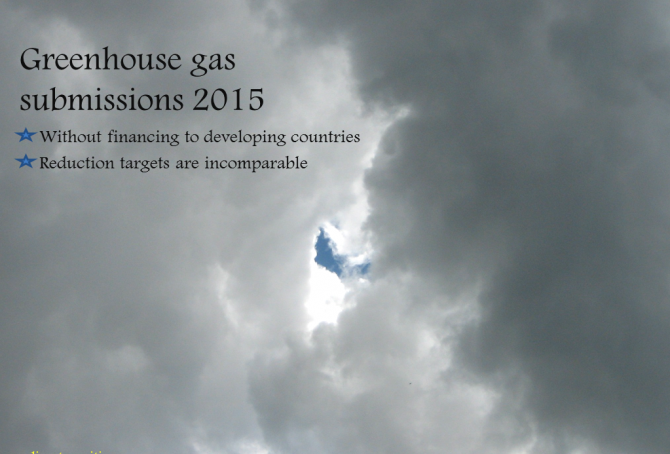
Greenhouse gas submissions of the United States, the European Union and Russia, by March 2015
Submissions of 33 countries (including ‘EU-28‘) with “intended nationally determined” greenhouse gas reductions have so far reached the United Nation’s ‘COP process website’. The greenhouse gas reductions proclaimed in the submissions include, besides carbon dioxide (CO2), gases such as methane, nitrous oxide, perfluorocarbons, hydrofluorocarbons, sulphur hexafluoride and nitrogen trifluoride – and changes in land-use and forestry. This mixture of different sources together with different parties, base years and target years, make the intended greenhouse gas reductions both muddy and incomparable between nations. None of the submissions so far include future financing to developing countries.
The following compares the submissions of the United States, the European Union (EU-28) and Russia – combined these 30 countries were responsible of 34% of the global carbon dioxide emissions from fossil fuels in 2012.
Oslo Principles on obligations to reduce climate change (time for legal sanctions)
2015
March 2015, a group of prominent experts¹ in international law, human rights law, environmental law, and other law adopted the ‘Oslo Principles on Global Obligations to Reduce Climate Change’ (pdf 8 pages) – see also the expert group’s appended ‘Commentary’ (pdf 94 pages; this ‘List of contents’ written by me might be useful).
Before proceeding read this summarizing article on the subject in The Guardian: ‘Climate change: at last a breakthrough to our catastrophic political impasse?’ and this article in Huffington Post: ‘Landmark Dutch Lawsuit Puts Governments Around the World on Notice’.
The Oslo Principles are divided into a Preamble (introduction), a General Principle (Principle 1), Definitions (Principles 2-5) and Specific Obligations (A. Obligations of States and Enterprises, Principles 6-12; B. Obligations of States, Principles 13-24; C. Procedural Obligations of States, Principles 25-26 and D. Obligations of Enterprises, Principles 27-30).
In short, the message is that ‘greenhouse gas’ emissions (GHG emissions) are unlawful unless they are consistent with a plan of steady reductions to ensure that the global surface temperature increase never exceeds pre-industrial temperatures by more than two degrees Celsius – in accordance with the recommendations of an overwhelming majority of leading climate scientists.
Below is a selection of essential selected quotes from the Oslo Principles (in red) and the appended Commentaries (in blue).
Renewable energy and Climate Debt by country
2015
Between 2000 and 2012 the global consumption of ‘Primary Energy’ increased by 32%, the global CO2 Emissions from the burning of fossil fuels increased by 34% and the world’s population grew by 15%. These figures should be seen in the context of the historic increases of ‘atmospheric concentration of greenhouse gases’ and the resulting ‘temperature rise’. The heartbreakingly imprudent and brutal development is reflected in 82 countries’ current Climate Debt in ClimatePositions. Many countries wisely prioritize ‘renewable energy’, however, globally renewable energy¹ (electrically generated) was only 8.6% of the total primary energy production in 2012 compared to 7.4% in 2000.
The table below ranks the 82 countries with Climate Debt by:
- Climate Debt per capita in 2013 (worst performing first).
- CO2 Emissions from fossil fuels in tons per capita in 2012.
- Renewable energy production (electrically generated) as share of the total primary energy production in 2012.
- Increase of the share of renewable energy production from 2000 to 2012.
IEA estimate: No reduction of global CO2 Emissions in 2014
2015
Preliminary data from the ‘International Energy Agency (IEA)‘ suggest no reduction of global CO2 Emissions from fossil fuels in 2014 compared to 2013. Global emissions were 31.7 Billion tons in 2012 and 32.3 Billion tons in 2013 as well as in 2014 (preliminary estimate). The diagram below copied from ‘IEA Key World Energy Statistics 2014’ show the global emissions from 1971 to 2012. According to IEA 2014 was the first year in four decades with growing global economy (by 3%) without a corresponding increase of CO2 Emissions from fossil fuels. Or as IEA puts it: “for the first time, greenhouse gas emissions are decoupling from economic growth.” Since the world population is growing around 1% annually the CO2 Emissions per capita has decreased by about 1% in 2014 compared to 2013 (preliminary estimate). This good news must, however, be put into perspective before applause breaks out – read below the diagram.
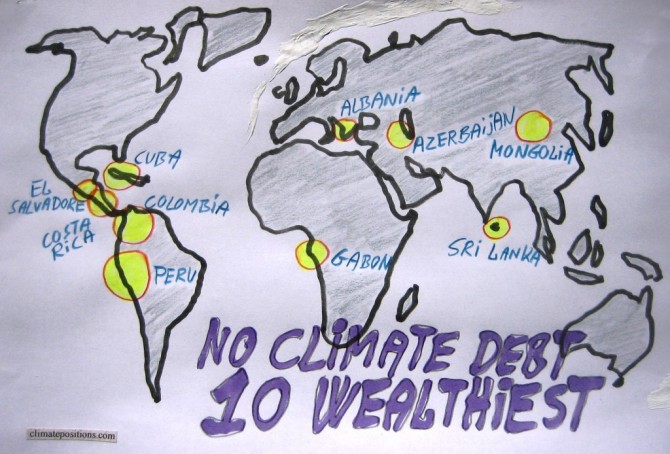
The ten wealthiest countries without any Climate Debt
2015
Among the 147 countries with full data in ClimatePositions 65 are Contribution Free (no Climate Debt). See the ‘ranking’. The table in this article ranks (from 1 to 10) the ten wealthiest Contribution Free countries by the following eight indicators:
- Per capita GDP(ppp-$) (1 = wealthiest)
- Income Equality (1 = most equal)
- Per capita CO2 Emissions from fossil fuels (1 = lowest emissions)
- Democracy Index (1 = most democracy)
- Environmental Performance (1 = best performance)
- Life Expectancy by birth (1 = longest lives)
- Per capita Ecological Footprint without carbon (1 = smallest footprint)
- Primary Forests as a percentage of the total land area (1 = largest percentage)
Read the comments below the table.
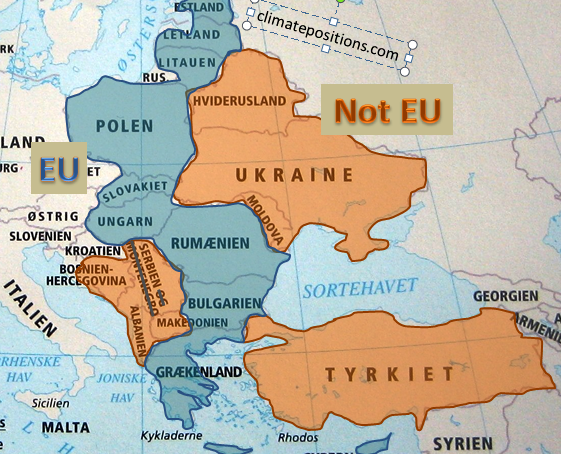
European Union “east” compared to bordering countries
2015
The ‘European Union’ (EU) is an economic and political partnership between ‘28 countries’. Around 7% of the global population lives in EU and they emit around 12% of the global CO2 from fossil fuels and are responsible of 13% of the Climate Debt in ClimatePositions. The following examines a group of 10 countries in eastern EU which joined the union between 1981 and 2007 in comparison with 8 bordering countries.

Climate change performance: Turkey vs. Egypt
2015
Turkey is ranked 57th and Egypt 71st among 147 countries on the list of the worst performing countries in ClimatePositions. See the ‘ranking’. The Turkish Climate Debt accumulated since 2000 increased from $161 per capita in 2010 to $324 in the latest calculation, while the one of Egypt increased from $40 to $73. The first diagram shows the relative Climate Debt of the two countries in comparison with Lebanon, Jordan and China, with the world average set at 100. Note that the world’s average Climate Debt increased from $455 per capita in 2010 to $769 in 2014 (reflecting the growing CO2 Emissions from fossil fuels and the growing economy). The following examines some indicators and trends of Turkey and Egypt.
Climate change performance of Norway (and the giant oil fund)
2015
Norway’s first oil field started production in 1971 and since 1996 petroleum revenue has been transferred to what’s now called the ‘Government Pension Fund Global’ – often referred to as Norway’s Oil Fund. Today, the fund’s market value is around $884 Billion. For comparison, the updated Norwegian Climate Contribution in ClimatePositions is $16.4 Billion and the climate financing¹ $1.5 Billion. Below are listed some perspectival per capita figures:
- The current market value of Norway’s Oil Fund is around $188,000 per capita (per Norwegian). In 2000 the market value was $11,000 per capita.
- The accumulated Climate Contribution in ClimatePositions is $3,490 per capita.
- The climate financing is $321 per capita (9% of the Climate Contribution which is world record; read this ‘article‘).
- The updated Climate Debt is $3,169 per capita which ranks Norway 15th in the world (see the ‘ranking’).
- The oil production per capita was 6th in the world in 2013, after Qatar, Kuwait, United Arab Emirates, Saudi Arabia and Equatorial Guinea – in 2000 Norway was 2nd. Norway’s oil production decreased by 46% between 2000 and 2013 … the world production increased by 17% during the same period.
- The natural gas production per capita was 4th in the world in 2012, after Qatar, Trinidad and Tobago and Brunei. Norway’s natural gas production increased by 106% between 2000 and 2012 … the world production increased by 37% during the same period.
The following examines Norway’s CO2 Emissions, Climate Debt over time, GDP(ppp-$) and the investment strategy of Norway’s Oil Fund.
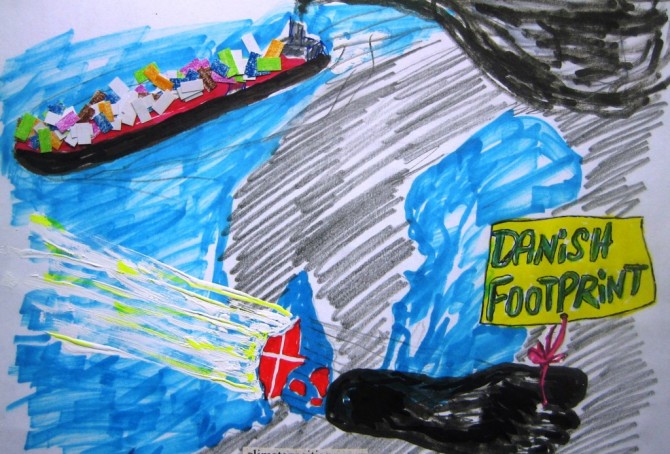
Slowdown of Denmark’s accumulating Climate Debt, but..!
2015
Denmark’s updated Climate Debt is $806 per capita. In the latest ‘ranking’ the Scandinavian country is 41st out of 147 countries (where no. 1 is worst) and is often referred to as a green transition pioneer. However, according to various rankings and surveys the picture is somewhat more complicated:
- Denmark’s per capita ‘Ecological Footprint’ – without carbon emissions – is the largest among 152 countries.
- Denmark is ranked 1st among 29 countries (those with data) on organic (ecological) share of all domestic sales¹.
- In the ‘Climate Change Performance Index’ (from Germanwatch and Climate Action Network Europe) Denmark performs best of 58 countries.
- CO2 Emissions would be around 46% higher than the usual statistics show, if emissions from Danish-controlled overseas ships, sailing goods around the world, were included² (in 2011 the Danish per capita CO2 Emissions would be around 15.0 tons instead of 8.2 tons).
- In addition, Denmark’s CO2 Emissions would be around 18% higher (in 1996-2009), than the usual statistics show, if emissions were consumption-based³ (inclusive CO2 Emissions from the production of imported goods) instead of production-based (inclusive CO2 Emissions from domestic production of goods for export).
However, the following examines only the indicators of CO2 Emissions from fossil fuels (production-based and without emissions from overseas ships), GDP(ppp-$) and Ecological Footprint without carbon emissions.
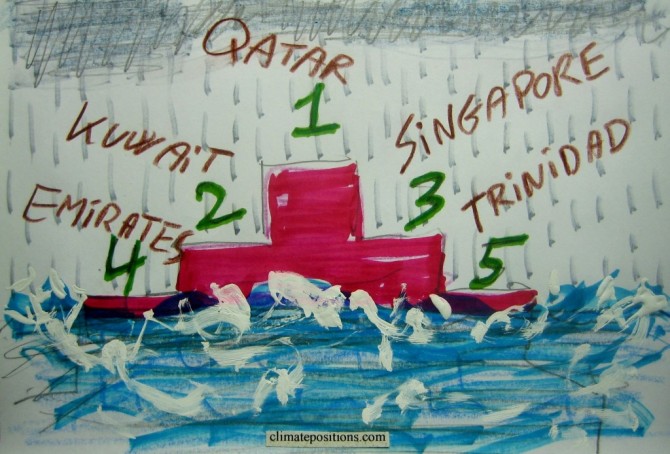
Top five in Climate Debt: Qatar, Kuwait, Singapore, United Arab Emirates and Trinidad and Tobago
2015
The updated Climate Debt per capita accumulated since 2000 of the five worst performing countries are:
- Qatar $35,565
- Kuwait $31,828
- Singapore $24,828
- United Arab Emirates $18,386
- Trinidad and Tobago $14,131
See the ‘ranking’ of 147 countries. The total population of the five small countries is 0.24% of the global population but the total Climate Debt is overwhelmingly 7.44% of the global Climate Debt (in 2012). The following analyses the indicators of GDP(ppp-$) and CO2 Emissions from fossil fuels (read about the issues of marine bunkers e.g. in Singapore at the bottom).
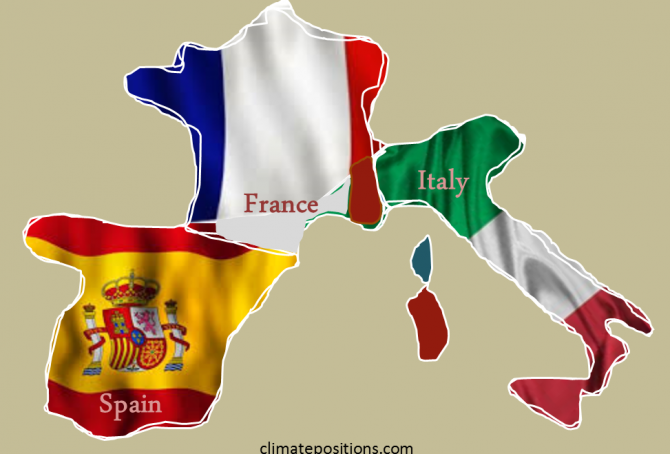
Climate change performance of Spain, France and Italy
2015
2.5% of the global population live in Spain, France or Italy and together they emitted 3.3% of the global CO2 from fossil fuels in 2012 – the combined share of the global Climate Debt is 4.3%. Spain’s updated Climate Debt per capita is $1,692 (ranked 25th), France’s is $1,352 (ranked 31st) and Italy’s is $1,034 (ranked 35th). See the ‘ranking’. The following examines the Climate Debt trends and the indicators of CO2 Emissions (carbon dioxide from fossil fuels), GDP(ppp-$), Forests, Marine Protection and Nuclear Power.
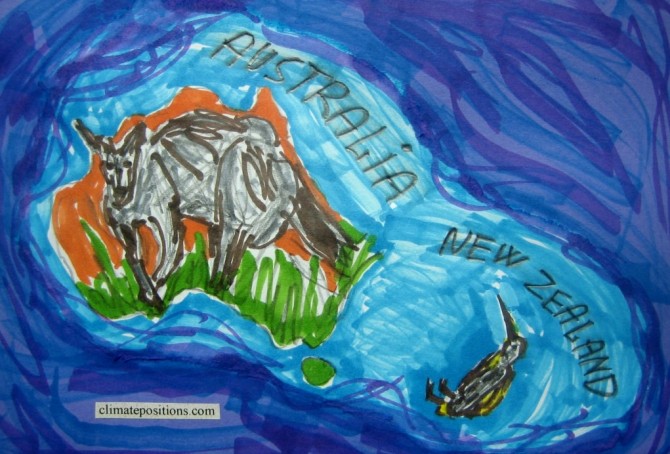
Climate change performance: Australia vs. New Zealand
2015
The two diagrams below show Australia’s and New Zealand’s CO2 Emissions from fossil fuels per capita in decades. The green bars show the Contribution Free Level and the grey bars are the world average. The average Australian per capita emissions were 16.7 tons in 1990s and 19.7 tons in 2000-2012 (18% increase). The corresponding figures of New Zealand were 8.7 tons and 9.5 tons (10% increase).
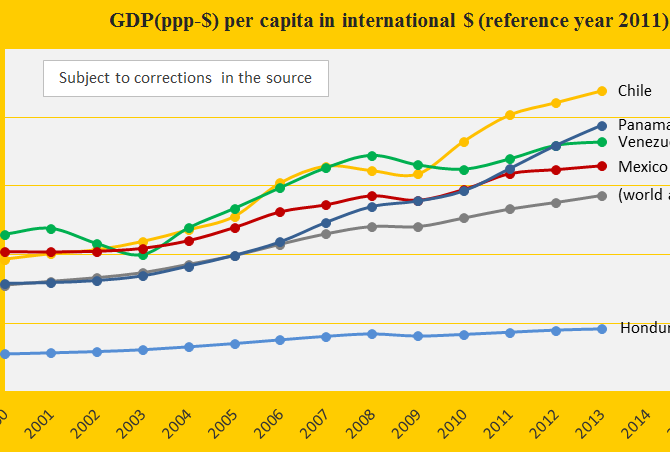
Climate change performance of Venezuela, Chile and Mexico
2015
Venezuela, Chile and Mexico are ranked 42nd, 44th and 58th among 147 countries on the worst performing list in ClimatePositions (see the ‘ranking’). Their updated Climate Contributions (climate debt) are respectively $697, $561 and $313 per capita. The first diagram shows the GDP(ppp-$) per capita of the three countries, in comparison with Panama, Honduras and the world average. Chile is the third wealthiest country in the America’s after (far after!) the United States and Canada – Honduras is the second poorest after Nicaragua.
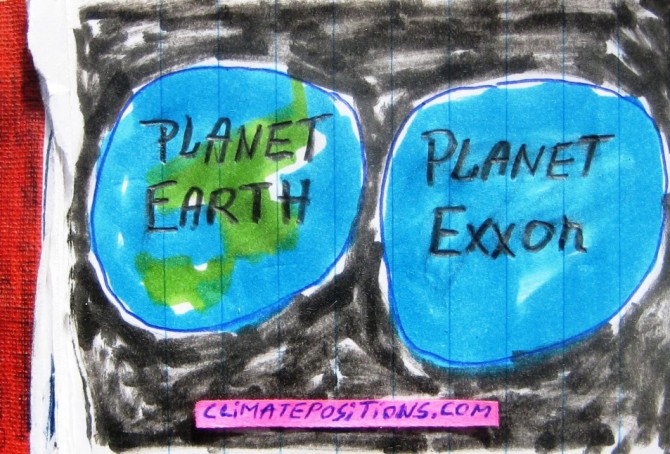
ExxonMobil: The Outlook for Energy 2015 … 2040 (Planet Exxon!?)
2015
‘Exxon Mobil Corporation’ from Texas, the United States is, quote: “committed to being the world’s premier petroleum and petrochemical company.” However, based on estimates of the potential carbon dioxide emissions from the proven reserves of oil and gas underground, ExxonMobil is only the 4th largest company in the world after Gazprom, Rosneft (both Russia) and PetroChina (read this ‘article’).
Since the United Nations has decided to keep the rise in global temperature below 2°C and consequently only between 8% and 34% of the proven fossil fuel reserves can be extracted and burned over the next 40 years. A recent ‘study in Nature‘ suggest that, globally, 33% of oil reserves, 50% of gas reserves and over 80% of current coal reserves should remain unused from 2010 to 2050 in order to meet the target of 2°C (also read the article ‘Divestment from Fossil Fuel Companies’). It will be interesting to see how companies such as ExxonMobil meet this moral challenge. The following highlight some forecasts from ExxonMobil’s ‘Outlook for energy 2015: A View to 2040’ (76 pages).
Estimate: India now has a Climate Debt
2015
Annual updates of ‘CO2 Content in the atmosphere’ and Global Population affects the future CO2 Emission target per capita and thus the Contribution Free Level of all countries (in ClimatePositions). The updates by January 2015 lowered India’s Contribution Free Level just enough to reach an estimated climate debt of $0.68 per capita, or a total climate debt of $812 million – the 67th largest climate debt among 146 countries or 0.02% of the global climate debt.
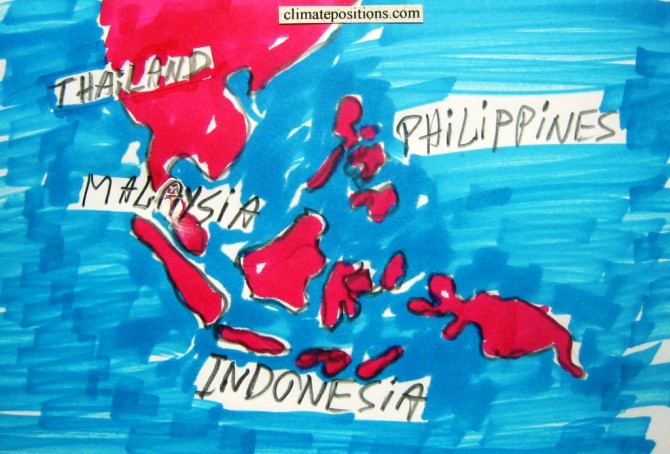
Climate change performance of Malaysia, Thailand, Indonesia and the Philippines
2015
6.4% of the world population lives in Malaysia, Thailand, Indonesia or the Philippines – they emitted 3.2% of the global carbon dioxide from fossil fuels in 2012. The four diagrams below show the emissions per capita 2000-2013 (preliminary estimates of 2013) of the four populous countries of which only the Philippines is Contribution Free (no climate debt) in ClimatePositions. The green bars are the Contribution Free Level of CO2 Emissions calculated from emissions in 1990s and a number of continuously updated ‘indicators’.