
Egypt – per capita Fossil CO2 Emissions and Climate Debt
2020
Egypt’s current Climate Breakdown Pricing amounts to $3.58 per tons Fossil CO2 emitted since 2000. The Climate Debt grew from $79 per capita in 2015 to $161 in 2020. Updated Rankings of 165 countries are available in the menu “Climate Debt”.
The following diagrams expose the trends of Fossil CO2 Emissions, Climate Debt and GDP(ppp-$).

Malaysia – per capita Fossil CO2 Emissions and Climate Debt
2020
Malaysia’s current Climate Breakdown Pricing amounts to $20.82 per tons Fossil CO2 emitted since 2000. The Climate Debt grew from $1,454 per capita in 2015 to $2,902 in 2020. Updated Rankings of 165 countries are available in the menu “Climate Debt”.
The following diagrams expose the trends of Fossil CO2 Emissions, Climate Debt, GDP(ppp-$) and Ecological Footprint without carbon.
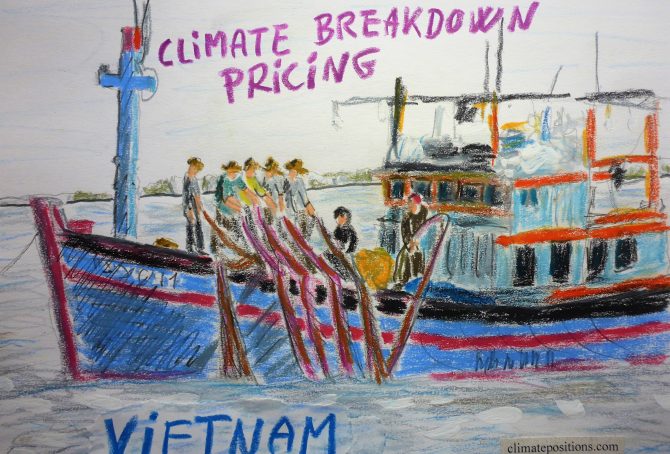
Vietnam – per capita Fossil CO2 Emissions and Climate Debt
2020
Vietnam’s current Climate Breakdown Pricing amounts to $0.88 per tons Fossil CO2 emitted since 2000. The Climate Debt grew from $6 per capita in 2015 to $26 in 2020. Updated Rankings of 165 countries are available in the menu “Climate Debt”.
The following diagrams expose the trends of Fossil CO2 Emissions, Climate Debt, GDP(ppp-$), Forest Cover, Primary Forest and Ecological Footprint without carbon.
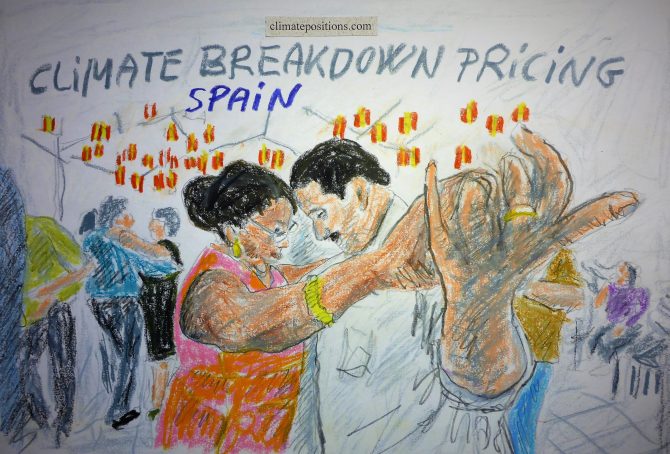
Spain – per capita Fossil CO2 Emissions and Climate Debt
2020
Spain’s current Climate Breakdown Pricing amounts to $16.05 per tons Fossil CO2 emitted since 2000. The Climate Debt grew from $1,173 per capita in 2015 to $2,110 in 2020. Updated Rankings of 165 countries are available in the menu “Climate Debt”.
The following diagrams expose the trends of Fossil CO2 Emissions, Climate Debt, GDP(ppp-$) and Ecological Footprint without carbon.

Thailand – per capita Fossil CO2 Emissions and Climate Debt
2020
Thailand’s current Climate Breakdown Pricing amounts to $7.92 per tons Fossil CO2 emitted since 2000. The Climate Debt grew from $265 per capita in 2015 to $535 in 2020. Updated Rankings of 165 countries are available in the menu “Climate Debt”.
The following diagrams expose the trends of Fossil CO2 Emissions, Climate Debt, GDP(ppp-$) and Ecological Footprint without carbon.
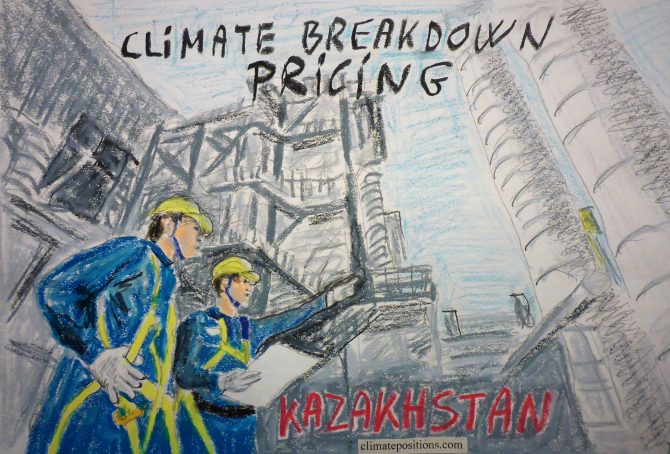
Kazakhstan – per capita Fossil CO2 Emissions and Climate Debt
2020
Kazakhstan’s current Climate Breakdown Pricing amounts to $16.18 per tons Fossil CO2 emitted since 2000. The Climate Debt grew from $2,041 per capita in 2015 to $4,025 in 2020. Updated Rankings of 165 countries are available in the menu “Climate Debt”.
The following diagrams expose the trends of Fossil CO2 Emissions, Climate Debt, GDP(ppp-$) and Ecological Footprint without carbon.

France – per capita Fossil CO2 Emissions and Climate Debt
2020
The current Climate Breakdown Pricing of France amounts to $16.87 per tons Fossil CO2 emitted since 2000. The Climate Debt grew from $953 per capita in 2015 to $1,876 in 2020. Updated Rankings of 165 countries are available in the menu “Climate Debt”.
The following diagrams expose the trends of Fossil CO2 Emissions, Climate Debt, GDP(ppp-$), Nuclear Power and Ecological Footprint without carbon.
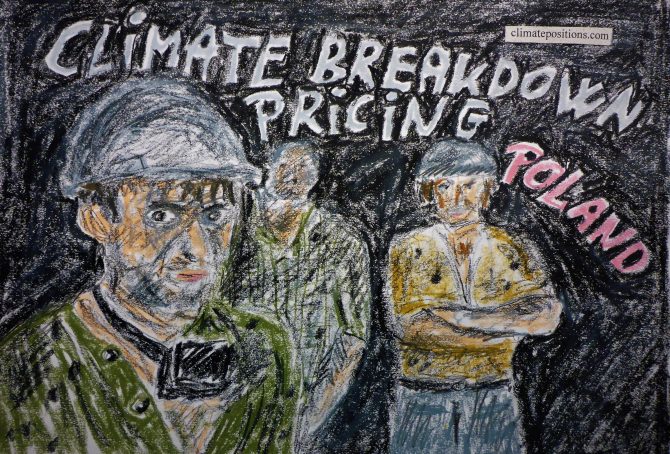
Poland – per capita Fossil CO2 Emissions and Climate Debt
2020
Poland’s current Climate Breakdown Pricing amounts to $9.87 per tons Fossil CO2 emitted since 2000. The Climate Debt grew from $593 per capita in 2015 to $1,555 in 2020. Updated Rankings of 165 countries are available in the menu “Climate Debt”.
The following diagrams expose the trends of Fossil CO2 Emissions, Climate Debt, GDP(ppp-$) and Ecological Footprint without carbon.

Italy – per capita Fossil CO2 Emissions and Climate Debt
2020
Italy’s current Climate Breakdown Pricing amounts to $13.47 per tons Fossil CO2 emitted since 2000. The Climate Debt grew from $1,003 per capita in 2015 to $1,841 in 2020. Updated Rankings of 165 countries are available in the menu “Climate Debt”.
The following diagrams expose the trends of Fossil CO2 Emissions, Climate Debt, GDP(ppp-$) and Ecological Footprint without carbon.

United Kingdom – per capita Fossil CO2 Emissions and Climate Debt
2020
The current Climate Breakdown Pricing of the United Kingdom amounts to $11.17 per tons Fossil CO2 emitted since 2000. The Climate Debt grew from $871 per capita in 2015 to $1,614 in 2020. Updated Rankings of 165 countries are available in the menu “Climate Debt”.
The following diagrams expose the trends of Fossil CO2 Emissions, Climate Debt, GDP(ppp-$), Nuclear Power and Ecological Footprint without carbon.
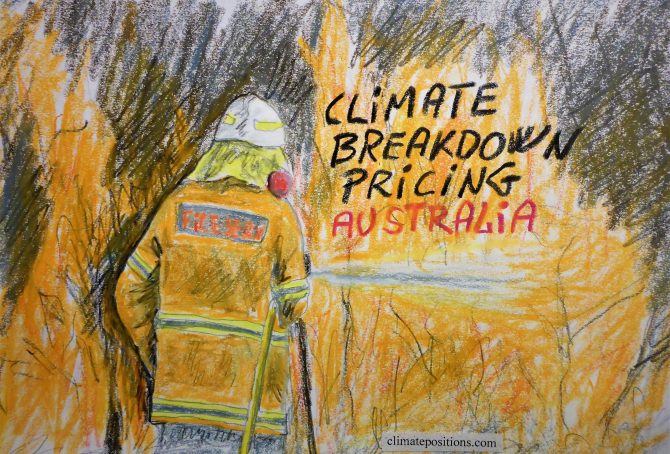
Australia – per capita Fossil CO2 Emissions and Climate Debt
2020
Australia’s current Climate Breakdown Pricing amounts to $32.40 per tons Fossil CO2 emitted since 2000. The Climate Debt grew from $6,547 per capita in 2015 to $11,256 in 2020. Updated Rankings of 165 countries are available in the menu “Climate Debt”.
The following diagrams expose the trends of Fossil CO2 Emissions, Climate Debt, GDP(ppp-$) and Ecological Footprint without carbon.

Turkey – per capita Fossil CO2 Emissions and Climate Debt
2020
Turkey’s current Climate Breakdown Pricing amounts to $13.04 per tons Fossil CO2 emitted since 2000. The Climate Debt grew from $401 per capita in 2015 to $1,040 in 2020. Updated Rankings of 165 countries are available in the menu “Climate Debt”.
The following diagrams expose the trends of Fossil CO2 Emissions, Climate Debt, GDP(ppp-$) and Ecological Footprint without carbon.
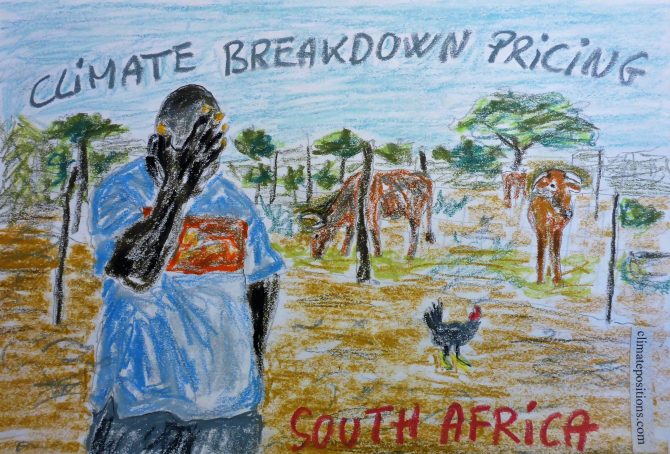
South Africa – per capita Fossil CO2 Emissions and Climate Debt
2020
South Africa’s current Climate Breakdown Pricing amounts to $8.30 per tons Fossil CO2 emitted since 2000. The Climate Debt grew from $593 per capita in 2015 to $1,355 in 2020. Updated Rankings of 165 countries are available in the menu “Climate Debt”.
The following diagrams expose the trends of Fossil CO2 Emissions, Climate Debt, GDP(ppp-$) and Ecological Footprint without carbon.
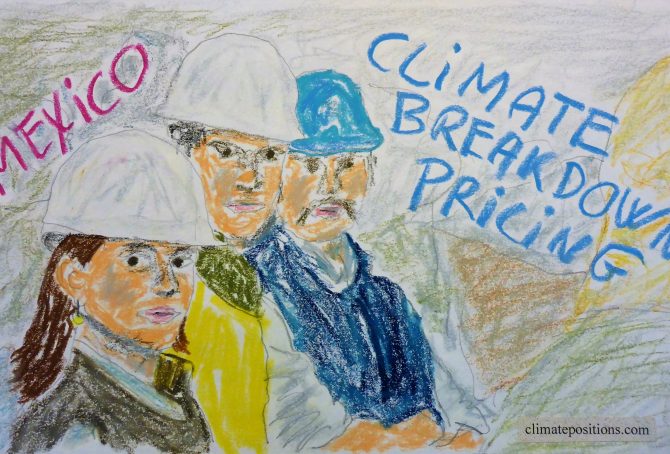
Mexico – per capita Fossil CO2 Emissions and Climate Debt
2020
Mexico’s current Climate Breakdown Pricing amounts to $8.71 per tons Fossil CO2 emitted since 2000. The Climate Debt grew from $291 per capita in 2015 to $662 in 2020. Updated Rankings of 165 countries are available in the menu “Climate Debt”.
The following diagrams expose the trends of Fossil CO2 Emissions, Climate Debt, GDP(ppp-$), Nuclear Power and Ecological Footprint without carbon.
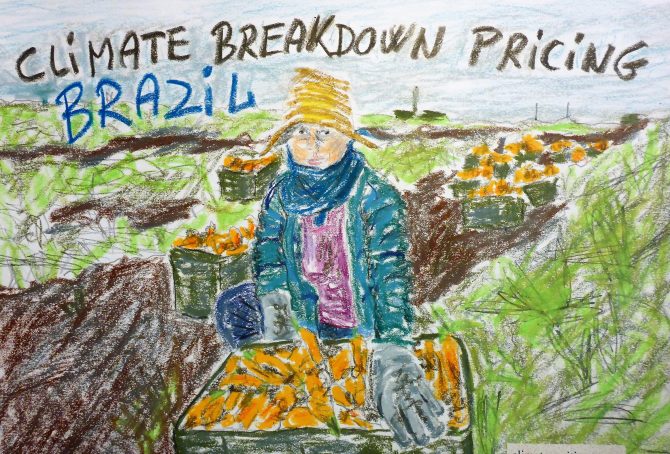
Brazil – per capita Fossil CO2 Emissions and Climate Debt
2020
Brazil’s current Climate Breakdown Pricing amounts to $5.74 per tons Fossil CO2 emitted since 2000. The Climate Debt grew from $108 per capita in 2015 to $246 in 2020. Updated Rankings of 165 countries are available in the menu “Climate Debt”.
The following diagrams expose the trends of Fossil CO2 Emissions, Climate Debt, GDP(ppp-$), Ecological Footprint without carbon, Forest Cover and Primary Forest.

Indonesia – per capita Fossil CO2 Emissions and Climate Debt
2020
Indonesia’s current Climate Breakdown Pricing amounts to $4.50 per tons Fossil CO2 emitted since 2000. The Climate Debt grew from $82 per capita in 2015 to $147 in 2020. Updated Rankings of 165 countries are available in the menu “Climate Debt”.
The following diagrams expose the trends of Fossil CO2 Emissions, Climate Debt, GDP(ppp-$), Ecological Footprint without carbon, Forest Cover and Primary Forest.
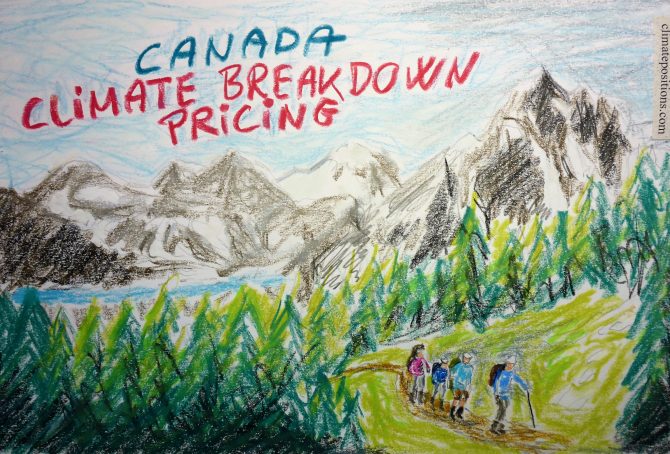
Canada – per capita Fossil CO2 Emissions and Climate Debt
2020
Canada’s current Climate Breakdown Pricing amounts to $29.84 per tons Fossil CO2 emitted since 2000. The Climate Debt grew from $6,452 per capita in 2015 to $9,685 in 2020. Updated Rankings of 165 countries are available in the menu “Climate Debt”.
The following diagrams expose the trends of Fossil CO2 Emissions, Climate Debt, GDP(ppp-$), Nuclear Power and Ecological Footprint without carbon.

Saudi Arabia – per capita Fossil CO2 Emissions and Climate Debt
2020
Saudi Arabia’s current Climate Breakdown Pricing amounts to $45.11 per tons Fossil CO2 emitted since 2000. The Climate Debt grew from $5,683 per capita in 2015 to $13,955 in 2020. Updated Rankings of 165 countries are available in the menu “Climate Debt”.
The following diagrams expose the trends of Fossil CO2 Emissions, Climate Debt, GDP(ppp-$) and Ecological Footprint without carbon.

South Korea – per capita Fossil CO2 Emissions and Climate Debt
2020
South Korea’s current Climate Breakdown Pricing amounts to $33.53 per tons Fossil CO2 emitted since 2000. The Climate Debt grew from $3,608 per capita in 2015 to $7,397 in 2020. Updated Rankings of 165 countries are available in the menu “Climate Debt”.
The following diagrams expose the trends of Fossil CO2 Emissions, Climate Debt, GDP(ppp-$) and Ecological Footprint without carbon.

Iran – per capita Fossil CO2 Emissions and Climate Debt
2020
Iran’s current Climate Breakdown Pricing amounts to $15.69 per tons Fossil CO2 emitted since 2000. The Climate Debt grew from $1,095 per capita in 2015 to $2,153 in 2020. Updated Rankings of 165 countries are available in the menu “Climate Debt”.
The following diagrams expose the trends of Fossil CO2 Emissions, Climate Debt, GDP(ppp-$), Ecological Footprint (without carbon) and Nuclear Power.