Update: GDP(ppp-$) 2015
2016
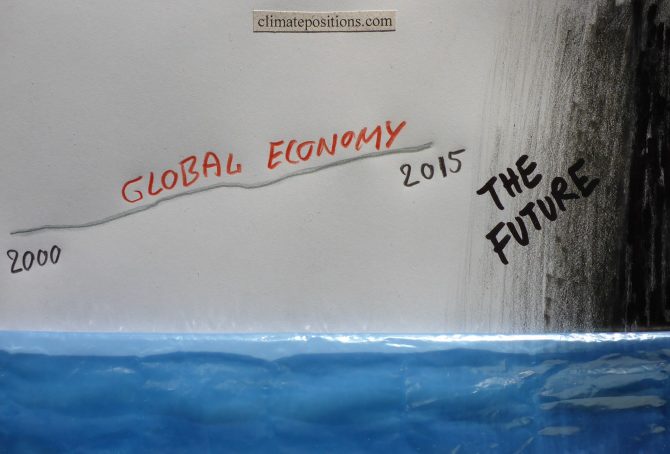
2015-updates of national per capita GDP(ppp-$) from ‘World Bank’ is now available in ‘Calculation (Excel)’. The world’s average per capita GDP(ppp-$) grew from $15,065 in 2014 to $15,470 in 2015 (2.7% growth). In the midst of an unprecedented man-made climate catastrophe and the ‘Sixth mass extinction’ in progress, the human economy keeps growing.
The diagram below shows the development in per capita GDP(ppp-$) 2000-2015 of the world’s five largest emitters of CO2 from Fossil Fuel and cement: China (27.0% of the global emissions), the United States (14.7%), India (7.2%), Russia (4.9%) and Japan (3.4%), in comparison with the world’s average.
Predicted impact of climate change: $369 trillion by 2200 (study)
2016
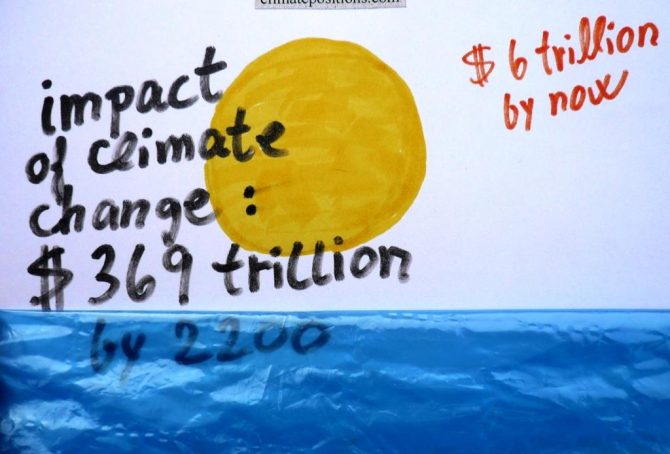
Nobody knows how high the costs of global warming will be in the future. However, ‘Studies’ predict a total of $369 trillion by 2200, assuming that humans will have stopped emitting greenhouse gases from burning Fossil Fuels around 2100 and atmospheric CO2 concentrations will have reached 700 ppm. The calculations include accelerating release of methane from melting permafrost (13% of the total costs).
ClimatePositions calculates the ‘Climate Debt’, accumulated since 2000, for 148 countries with full data. The global Climate Debt amounted to $0.8 trillion in 2005, $2.6 trillion in 2010 and around $6.0 trillion in 2015 (preliminary estimate). The diagram below illustrates the accumulated Climate Debts (red dots) “smooth climbing” towards the predicted costs of $369 trillion by 2200 (black dot) … all speculatively of course!

Climate Debt: Norway ranks 9th (performance of top twenty from Human Development Index)
The so called ‘Human Development Index 2015’ (UN) ranks Norway 1st among 188 countries. The index is based on 1) Life expectancy at birth, 2) Expected years of schooling, 3) Mean years of schooling and 4) Gross national income (GNI) per capita. However, the wealthy Scandinavian oil state ‘Ranks‘ 9th among 148 countries on Climate Debt per capita. Norway is in other words a highly human developed demolisher of the climate, one might say! The following examines the climate performance of Norway in comparison with the other top five countries from Human Development Index: Australia, Switzerland, Denmark and Netherland.

Climate Debt: Australia ranks 8th (performance of the twenty largest coal producers)
2016
Australia covers around 5.7% of planet’s land area and populates 0.3% of its people. The Climate Debt of the 24 million Australian’s amounts to $132 billion, or $5,613 per capita, which ‘Ranks’ Australia 8th among 148 countries – in 2010 the ranking was 6th. Australia is the world’s 5th largest coal producer and the 2nd largest per capita CO2 emitter from coal combustion … and coal is the most efficient climate destroyer. The table below reveals some key figures of the world’s twenty largest coal producers. Subsequently, Australia’s climate change performance is examined in comparison with four other top-five countries on CO2 Emissions from coal combustion (per capita): Kazakhstan (ranked 1), South Africa (3), the United States (4) and Poland (5).
Climate Debt of Germany & the European Union … versus the United States, China, Japan and Russia
The Climate Debt of ‘the 28 member states of the European Union (EU-28)’, China, the United States, Japan and Russia, combined, amounts to nearly 70% of the world’s total Climate Debt of around $5,700 billion. The following compares 1) EU-28 with the four countries, 2) Germany with EU-28, and 3) Germany with the four other countries.
The table below shows the per capita Climate Debt, the total Climate Debt and the share of the global Climate Debt, of EU-28¹, China, the United States, Japan and Russia. Rankings of 148 countries by 2010 and January 2016 (preliminary estimates) are available in the menu “Climate Debt”.

The United States’ huge share of the growing global Climate Debt is decreasing
Worldwide, eyes are on the United States due to its massive historic greenhouse gas emissions and its sabotage of attempts to reach a fair and globally binding reduction agreement. Instead, the world is stocked with “intended nationally determined contributions towards achieving the objective […] consistent with holding the increase in the global average temperature to well below 2°C above preindustrial levels and pursuing efforts to limit the temperature increase to 1.5°C.” If this baloney-goal is to be taken seriously, then the United States must cut emissions from fossil fuels by around 80% (give and take), within fifteen years, or so. The following examines the development of CO2 Emissions, Environmental Performance, GDP(ppp-$) and accumulated Climate Debt.

Preliminary Carbon Dioxide Emissions 2014, by country
2015
’The Global Carbon Project’ at Carbon Dioxide Information Analysis Center (CDIAC) has published preliminary CO2 Emissions from fossil fuels and cement for 2014, for more than 200 countries. The data is being used in a preliminary calculation of accumulated Climate Debt in ClimatePositions¹. The table below shows the estimated per capita emissions plus the updated Climate Debts, of the twenty largest total emitters (responsible for 77% of the global emissions in 2014).
Analyses of the global CO2 target and GDP(ppp-$)
2015
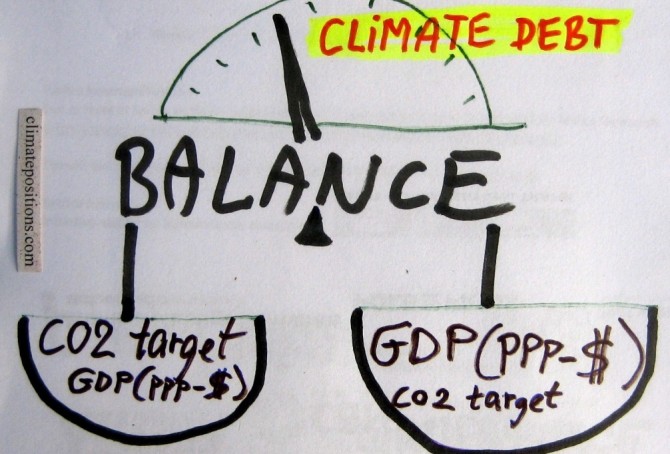
The calculation of Climate Debt in ClimatePositions is based on a balance between many ‘indicators’ and a common global per capita CO2 target. To illustrate the nature of this balance twelve countries are analyzed in this article in terms of the indicator of GDP(ppp-$) and the global CO2 target. The 12-Countries Group represents 38% of the global population, 65% of the global CO2 Emissions from fossil fuels and around 70% of the global Climate Debt.
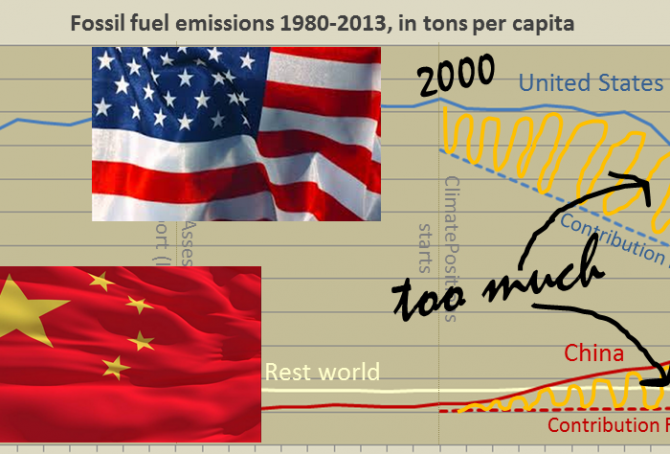
Per capita fossil fuel Carbon Dioxide Emissions: China vs. United States
2015
In different ways, China and the United States are main responsible for the continuing Climate Destruction. Combined the two superpowers, holding 24% of the world population, emitted 43% of the global CO2 from fossil fuels in 2012 and they accounted for 47% of the global Climate Debt¹. Had the two countries consistently promoted a fair and globally binding climate agreement, not thwarted it, then COP21 in Paris in December would not be such an incomprehensible mission impossible². The diagram below shows the per capita fossil fuel carbon dioxide emissions, between 1980 and 2013, of China, the United States and Rest World. The stippled lines indicate the Contribution Free Level of CO2 Emissions in ClimatePositions. More comments below the diagram.
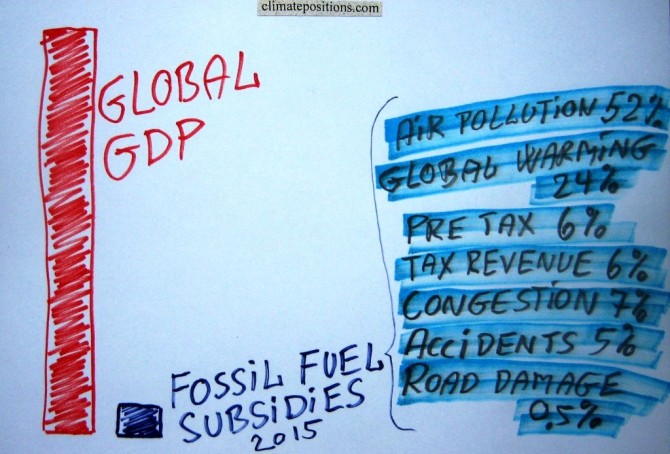
Fossil fuel subsidies: $5.3 trillion in 2015 (IMF survey)
2015
Estimates from the ‘International Monetary Fund’ (IMF) show that fossil fuel subsidies of 155 countries representing 98% of the world’s population, amounted $4.2 trillion (5.8% of global GDP) in 2011 and $4.9 trillion (6.5% of global GDP) in 2013. Projections for 2015 suggest $5.3 trillion (6.5% of global GDP). This huge amount of subsidies is of cause plain stupid.
For comparison, the total ‘Climate Debt of 147 countries‘ in ClimatePositions, accumulated between 2000 and 2013, amounted $5.2 trillion. Roughly speaking, one year of global subsidies equals the total accumulated Climate Debt. Note that global climate change funding is only around $0.14 trillion.
Giving up on future generations is real (about COP Submissions 2015)
2015
COP Submissions with intended national emission targets of 44 countries¹, responsible for 70% of the global CO2 Emissions from fossil fuels, are now available for study. Among the seven largest emitters only India’s submission is still missing. China, the world’s largest emitter, intends to reach its maximum emissions by 2030 (maybe earlier) and then reduce … which leaves global scenarios open to assumptions. The calculations in this article are based on 10% and 30% increase of the Chinese emissions by 2030, compared to 2013.
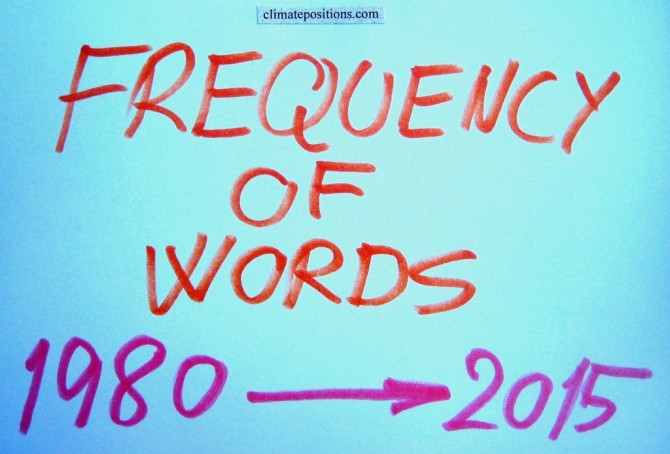
Historic use of phrases such as Climate Change, Biodiversity, Renewable Energy, Fracking, etc. (Google Books Ngram Viewer)
2015
‘Ngram Viewer’ is a Google search service showing graphs of historic use of words and phrases in books published in the United States (until 2008). The diagram below shows the trend of the phrases: Climate Change, Biodiversity, Global Warming, Deforestation, Renewable Energy, Greenhouse Effect, Invasive Species and Fracking. The corpus search is in “English” (case-insensitive), between 1980 and 2008. Read the comments below the diagram.

How green are the fossil fuel producers? (Correlation between fossil fuel production, CO2 Emissions, GDP and Climate Debt)
2015
Greenhouse gas emissions from burning of fossil fuels (oil, natural gas and coal), is the main cause of manmade climate change. Comparable energy potentials of oil, natural gas and coal is defined as “tons oil equivalents”, meaning that the energy released from a given quantity of natural gas or coal is equivalent to one ton of oil. This way the total production of fossil fuels can be expressed in a single figure (not to be confused with market value, global warming potential or general usefulness) The world’s production in million tons oil equivalent, was in 2013: oil (4,130), natural gas (3,041 and coal (3,881).
The table below ranks the twenty countries with the largest per capita fossil fuel production (oil equivalents). Total production data of 68 countries is from ‘BPs Statistical Review of World Energy 2014’ (pdf, 48 pages).
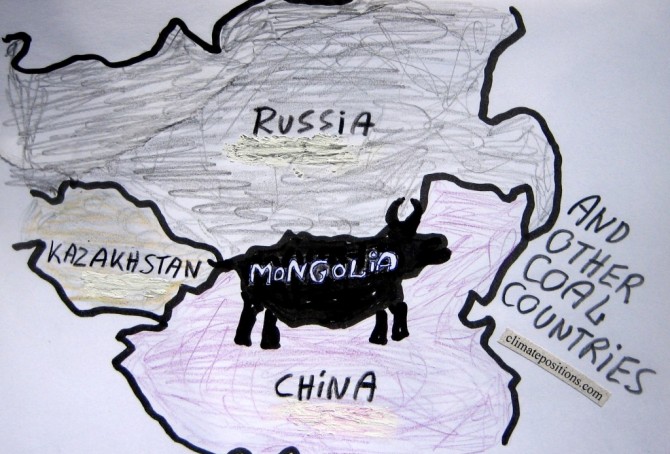
Mongolia and other coal producing countries (the thirteen most coal-dependent countries)
2015
Mongolia is the world’s second largest coal producer per capita (Btu, 2011) and coal is the world’s no. 1 carbon dioxide emitter. However, the flawed democracy (surrounded by the giant authoritarian regimes of China and Russia) is Contribution Free (no Climate Debt) in ClimatePositions – how is this possible?
The table below ranks the thirteen largest per capita coal producers (Btu, 2011), with the world average set at 1.0. The Mongolian coal production is almost ten times larger than the world average. For comparison, the table shows per capita values of CO2 Emissions (from fossil fuels), GDP(ppp-$) and Climate Debt. More comments below the table.
Greenhouse gas submissions of the United States, the European Union and Russia, by March 2015
Submissions of 33 countries (including ‘EU-28‘) with “intended nationally determined” greenhouse gas reductions have so far reached the United Nation’s ‘COP process website’. The greenhouse gas reductions proclaimed in the submissions include, besides carbon dioxide (CO2), gases such as methane, nitrous oxide, perfluorocarbons, hydrofluorocarbons, sulphur hexafluoride and nitrogen trifluoride – and changes in land-use and forestry. This mixture of different sources together with different parties, base years and target years, make the intended greenhouse gas reductions both muddy and incomparable between nations. None of the submissions so far include future financing to developing countries.
The following compares the submissions of the United States, the European Union (EU-28) and Russia – combined these 30 countries were responsible of 34% of the global carbon dioxide emissions from fossil fuels in 2012.
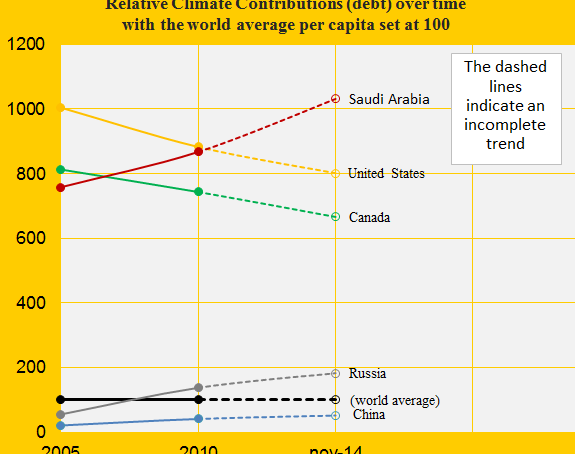
Climate change performance of Saudi Arabia and Canada
2014
The first diagram shows the relative Climate Contribution (debt) per capita of Saudi Arabia, Canada, China, the United States and Russia, with the world’s average set at 100. Around 2007 Saudi Arabia passed Canada and since then, the gap has grown considerably. Today, the climate debt per capita accumulated since 2000 are respectively $7,936 and $5,128 (see the ‘ranking’).
The Climate Contributions are calculated by using eleven ‘indicators’ of which national CO2 Emissions from the burning of fossil fuels is the principal. Extraction and export of fossil fuels is not one of the indicators which Saudi Arabia should be thankful for – wealth measured as ‘GDP(ppp-$)‘, however, is an indicator.
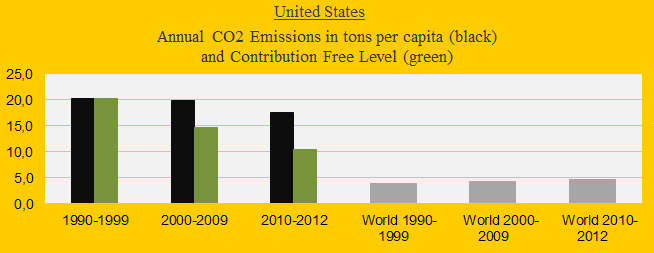
Climate change performance of the United States 2000-2013 (and the new emission target)
2014
Last week the United States ‘agreed’ with China to reduce US greenhouse gas emissions between 26% and 28% from the 2005-level by 2025. The agreement is legally non-binding and without the support of the Republicans. The following analyze the new US emission target (in the bottom) and the general performance in comparison with the spying buddies in Five Eyes Alliance¹: Canada, Australia, New Zealand and United Kingdom.
The United States is presently ranked 10th out of 147 countries in Climate Contribution (climate debt) per capita. See the ‘ranking’. The US ‘share of the global Climate Contributions’ is now 37.0%, compared to 40.7% in 2010. The first diagram shows the CO2 Emissions per capita in decades in comparison with the world average. The green bars are the Contribution Free Level, determined by the level of CO2 Emissions in the 1990s and the eleven ‘indicators’. The declining US share of the global climate debt is mainly due to reduced CO2 Emissions while the global emissions have increased.
New ranking 2014 – update of 147 countries’ climate debt
2014
The data in ClimatePositions are updated consecutively and since the data year 2010 the eleven ‘indicators’ have all been updated.
The new rankings of 147 countries are now available in the menu “Contributions” (with six categories).
All country data and diagrams are available in the menu ‘Calculations (Excel)’. In the coming months selected countries will be analyzed in articles. The following illustrates the latest updates in two ways: 1) The change of climate debt as a percentage of the global climate debt of the twelve largest CO2 emitters, and 2) The key-figures of the United Kingdom.
Carbon dioxide emissions 2013 – China, the United States, India and Russia
2014
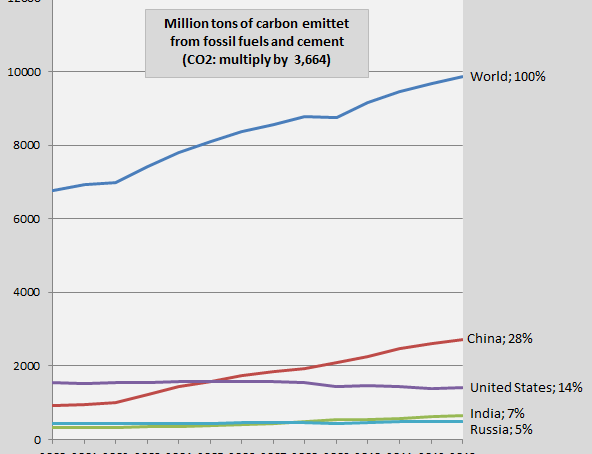
The diagram shows the global development of carbon dioxide emissions from fossil fuels and cement 2000-2013 (measured by pure carbon) and of the four largest emitters China, the United States, India and Russia. The 2013-emissions are preliminary with an enlarged uncertainty of ±5%. The national shares of the global emissions in 2013 are shown in percent to the right. The four countries accounted for 54% of the global emissions in 2013 (48% in 2000). The preliminary carbon dioxide emissions in 2013 of 216 countries is available ‘here’¹. Global emissions are on track of the worst out of four scenarios, likely heading for 3.2-5.4°C increase in temperature by 2100, since pre-industrial era (see the diagram below from ‘Global Carbon Project’, and ‘presentation (pdf)‘.
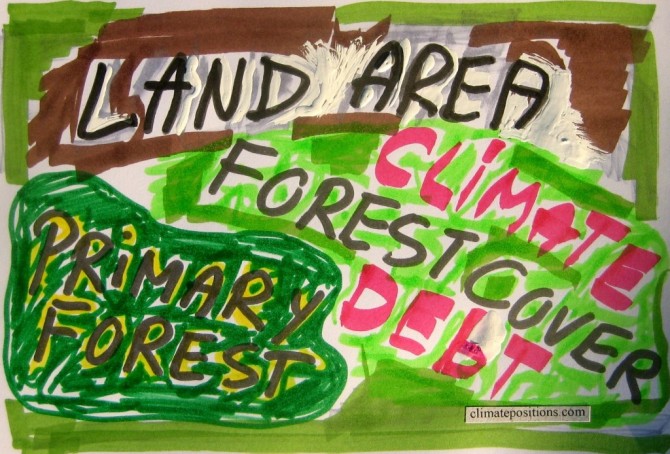
Forest Cover, Primary Forests and climate debt
2014
The national data of Forest Cover and Primary Forest are both included in the calculations of Climate Contributions (debt) in ClimatePositions. Primary Forest was included as an indicator in the worksheet in August 2014. The following describes selected findings on forests from FAO’s ‘The Global Forest Resources Assessments (FRA), 2010’ (main report, pdf, 378 pages). The Assessment is based on two primary sources of data: 1) ‘country reports’ and 2) remote sensing conducted by FAO and partners.