Study: National climate pledges and the resulting Global Warming by 2100 (The Pledged Warming Map)
2018
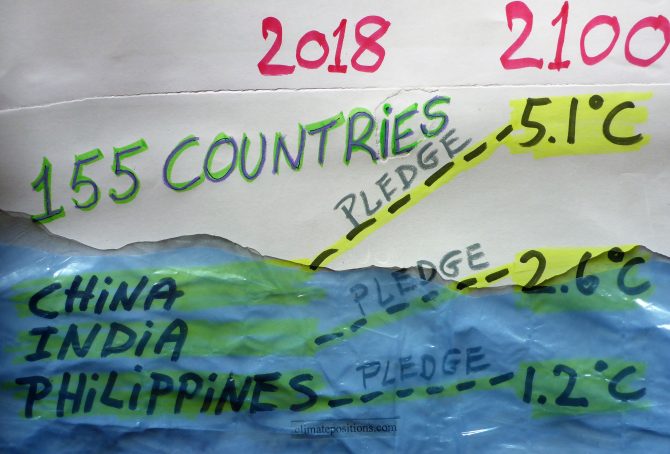
The Paris Agreement collectively committed the countries to limit Global Warming to well below 2°C and pursue efforts to limit warming to 1.5°C above preindustrial levels. However, how much Global Warming by 2100 is each country’s climate pledge leading to, if all countries adopted the same national approach and ambition? This question is being tried answered for the world’s countries on the new website ‘paris-equity-check.org‘ (Pledged Warming Map). The underlying ‘Peer-reviewed study‘ is published November 2018 in Nature Communications.
The site says: “The Paris Agreement includes bottom-up pledges and a top-down warming threshold. Under this setting where countries effectively choose their own fairness principle, Paris-Equity-Check.org presents scientifically peer-reviewed assessments the ambition of countries’ climate pledges (the Nationally Determined Contributions or NDCs) and address the question: What is a fair and ambitious contribution to achieving the Paris Agreement?” Read ‘Ambition of pledges‘ and ‘The science‘.
The table below shows 155 countries’ 1) ‘Per capita Climate Debt‘ in 2017, accumulated since 2000 in ClimatePositions, 2) per capita Fossil CO2 Emissions 2016, and 3) the pledges estimated effect on Global Warming by 2100 (Pledged Warming Map).
IPCC Report: Limiting Global Warming to 1.5ºC requires 45% CO2 reductions by 2030 compared to 2010 – and zero emissions by 2050 (but which countries are to reduce how much per capita?)
2018
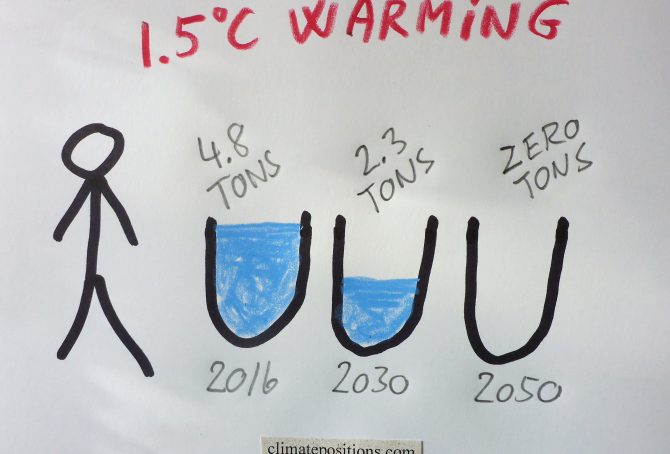
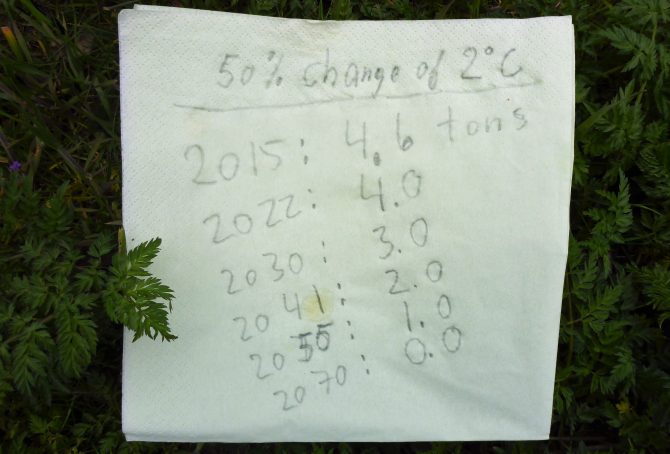
The IPCC Report ‘Global Warming of 1.5°C‘ released October 2018, finds that limiting global warming to 1.5°C would require reductions of global human-caused CO2 Emissions (carbon dioxide) of 45% by 2030 compared to 2010, and reach zero emissions around 2050¹.
However, since global Fossil CO2 Emissions increased 6.4% between 2010 and 2016, and the world population is expected to grow 1.2% annually the years to come, the required 45% global CO2 reductions by 2030, is equivalent to 53% reduction per capita by 2030 compared to 2016, or in only 14 years. In other words, an average world citizen must cut Fossil CO2 Emissions from 4.8 tons in 2016 to around 2.3 tons by 2030 and zero by 2050 (if limiting global warming to 1.5°C). Note that forest cover growth, removing CO2 from the air, etc. can substitute Fossil CO2 reductions in the IPCC scenarios².
Global Warming: Goodbye World Wildlife Heritage
2018
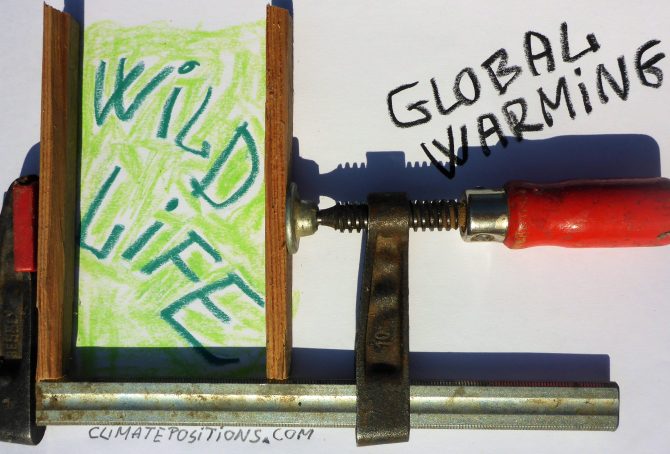
World Wildlife Heritage is miraculous. However, human caused Climate Change is a brutal attack on the biodiverse wildlife on Earth. In a recent analysis ‘Published in the journal Science‘ data were gathered on geographic ranges and current climate conditions of 31,000 insect species, 8,000 birds, 1,700 mammals, 1,800 reptiles, 1,000 amphibians and 71,000 plants. Then, it was calculated how the ranges change when global warming means some regions can no longer support particular species. The analysis only took global warming as such into consideration, not the impact of lost interactions between species or the impacts of more extreme weather events; nor the interaction with wildlife degradation for other reasons.
Research: A good life for all within planetary boundaries (all countries fail)
2018
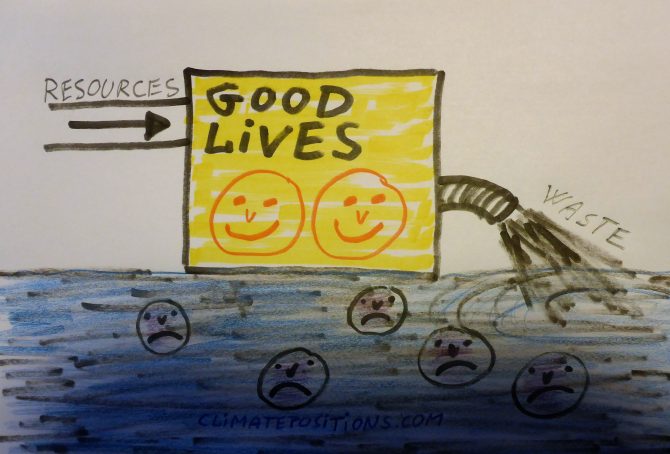
The website ‘https://goodlife.leeds.ac.uk/countries/’ let you visualize and compare the environmental and social performance of 151 countries. A total of 18 indicators – 7 environmental and 11 social – are included in the comparison. However, 81 of the included countries are missing data of between 1 and 9 indicators. The methods and results underpinning the data used on the website is the peer-reviewed article ‘A good life for all within planetary boundaries’ (abstract). It says that: “Physical needs such as nutrition, sanitation, access to electricity and the elimination of extreme poverty could likely be met for all people without transgressing planetary boundaries. However, the universal achievement of more qualitative goals (for example, high life satisfaction) would require a level of resource use that is 2–6 times the sustainable level, based on current relationships.”
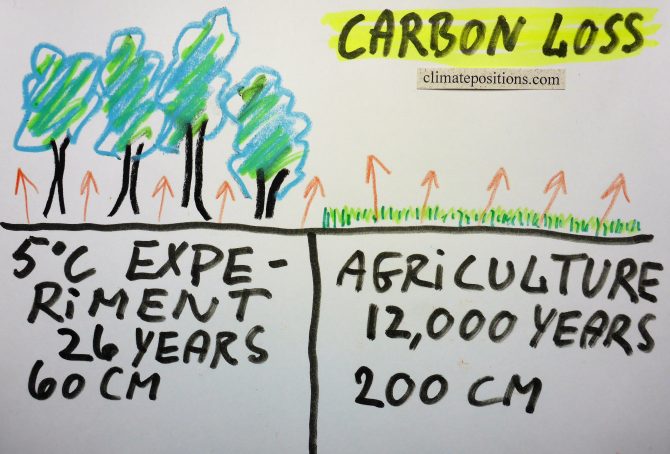
Two studies: 26-year soil warming experiment in a mid-latitude hardwood forest (possible self-reinforcing carbon emissions feedback loop) and 12,000 years of soil carbon losses from agriculture
2017
In continuation of the previous article about aboveground forest carbon losses, the following is about soil carbon losses due to warming and agriculture, respectively.
Melillo et al. performed a ‘26-year soil-warming experiment‘ in a mid-latitude mixed hardwood forest with results published October 2017 in the peer-review journal Science. Some forest areas (plots) were heated up with underground cables to 5°C above normal levels, while other forest areas were left as a control. The experiment then documented changes in soil carbon cycling in the top 60 cm and investigated the possible consequences for the climate system.
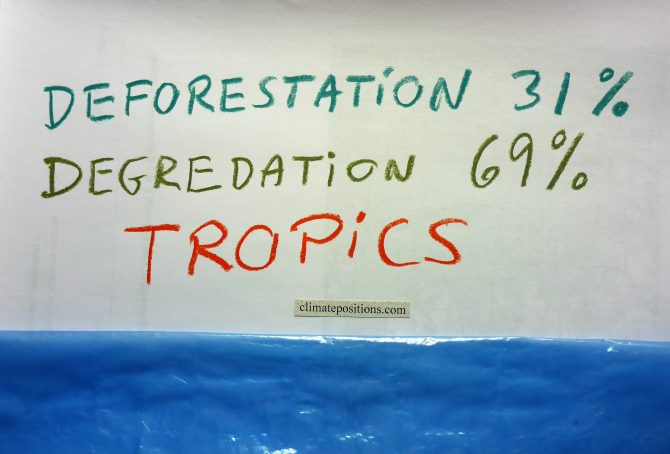
Study: Tropical forests now release twice as much carbon than they absorb
2017
A new ‘Study‘ from ‘Woods Hole Research Center‘ and Boston University reveals tropical forests now emit twice as much carbon than they capture. This is alarming news, since forests are the only carbon capture and storage “technology” that is safe, inexpensive and immediately available.
New approach to measuring forest carbon density using 1) satellite imagery 2003-2014, 2) laser remote sensing technology and 3) field measurements, were able to capture aboveground losses in forest carbon from full-scale deforestation as well as fine-scale degradation and disturbance. The latter has previously been a challenge to the scientific community over large areas. According to the study tropical forests in Americas, Africa and Asia are now releasing 425 (± 22%) teragrams (million tons) of carbon annually¹, equivalent to more than 4% (calculated by me) of global CO2 Emissions from Fossil Fuels and industrial processes. For perspectivation, global CO2 Emissions dropped 0.34% in 2016 compared to 2015.
Carbon Brief: Global Carbon Budget and CO2 Emission scenarios (50% risk of 1.5C, 2.0C and 3.0C warming)
Based on IPCC’s recent synthesis report, published 2014, ‘Carbon Brief‘ has calculated the number of years we can continue with today’s emission level (and then stop emissions), and still keep global average temperature rise to no more than 1.5°C, 2°C or 3°C above pre-industrial levels – with a 33% risk, a 50% risk, and a 66% risk of failure. One out of nine figures suggest that five more years with the current level of CO2 Emissions (and then total stop) leaves us with a 33% risk of 1.5°C temperature rise.
To frame the overall situation, the first diagram (below) shows three key graphs 1960-2015, with 1960 set at 100: 1) Global CO2 Emissions¹ from Fossil Fuels (without bunker) and cement, 2) Global Population (with projections to 2100), and 3) CO2 Emissions per capita. Even significant reductions of per capita emissions¹, will not necessary compensate for the projected population growth.
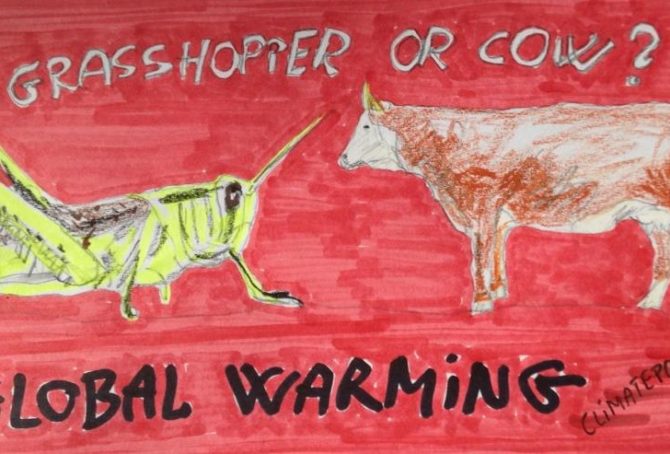
Reduce greenhouse gas emissions: Eat insects instead of meat
2016
The burning of fossil fuels (coal, oil and gas) is the major driving force for global warming¹. However, livestock rearing is responsible for around 18% of the anthropological greenhouse gas emissions (CO2 equivalent) and various edible insects are therefore excellent alternatives to meat in the fight against climate change. It is estimated that insects today is part of the diets of 25-30% of the global population and about 1,900 species are being used as human consumption. The following examine the climate- and environmental impact of different species of insects versus beef, pigs and chicken.

Study: Already developed fossil fuel reserves will potentially take us beyond the 2 degree warming limit
2016
A ‘Study (pdf, 60 pages)’ called “The Sky’s Limit” just released by ‘Oil Change International’ finds that already developed reserves¹ of coal, oil and gas, if extracted and burned, will take us beyond the Paris Agreement’s 2°C warming limit (and of cause far beyond the 1.5°C limit). Developed reserves is defined as currently operating fields and mines (projected to run to the end of their probable lifetimes), wells already drilled, pits that are dug, and pipelines, processing facilities, railways and export terminals already constructed. The developed reserves hold roughly 30% of the fossil fuel reserves.
The study finds that the potential CO2 Emissions from these already developed reserves – if extracted and burned – will exceed the 2°C carbon budget calculated by the Intergovernmental Panel on Climate Change (IPCC). The diagram below is copied from the study.
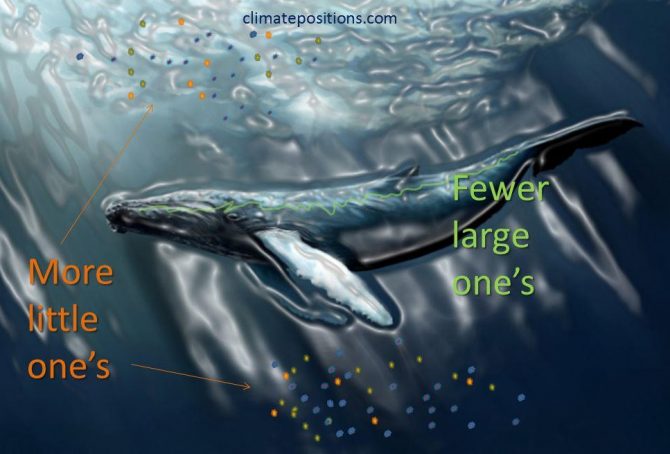
Research: The emerging mass extinction in the ocean threaten larger animals more compared to past mass extinctions (more bad news)
2016
The research ‘Ecological selectivity of the emerging mass extinction in the oceans‘ (pdf, 4 pages), published in the journal Science, show that “extinction threat in the modern oceans is strongly associated with large body size, whereas past extinction events were either nonselective or preferentially removed smaller-bodied taxa.” Or in other words: The balance between smaller animals and larger animals changes to the disadvantage of larger animals – due to human impact.

Report: Explaining Ocean Warming (the greatest hidden challenge of our generation)
2016
‘International Union for Conservation of Nature (IUCN)’ has recently published the report ‘Explaining Ocean Warming (pdf, 460 pages)‘ representing the most comprehensive review to date on ocean warming. IUCN is the world’s largest environmental network, harnessing the knowledge and research of around 1,300 organizations and 16,000 experts. The chapters and sections in the report tells in the scientist’s own words the scale and nature of changes being driven by ocean warming, often in association with other stressors such as ocean acidification and oxygen reductions. The following is an adapted summary of the report’s conclusions and recommendations.
Predicted impact of climate change: $369 trillion by 2200 (study)
2016
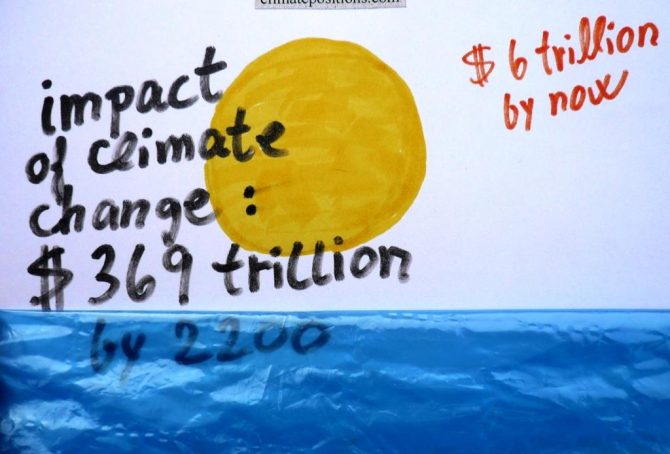
Nobody knows how high the costs of global warming will be in the future. However, ‘Studies’ predict a total of $369 trillion by 2200, assuming that humans will have stopped emitting greenhouse gases from burning Fossil Fuels around 2100 and atmospheric CO2 concentrations will have reached 700 ppm. The calculations include accelerating release of methane from melting permafrost (13% of the total costs).
ClimatePositions calculates the ‘Climate Debt’, accumulated since 2000, for 148 countries with full data. The global Climate Debt amounted to $0.8 trillion in 2005, $2.6 trillion in 2010 and around $6.0 trillion in 2015 (preliminary estimate). The diagram below illustrates the accumulated Climate Debts (red dots) “smooth climbing” towards the predicted costs of $369 trillion by 2200 (black dot) … all speculatively of course!
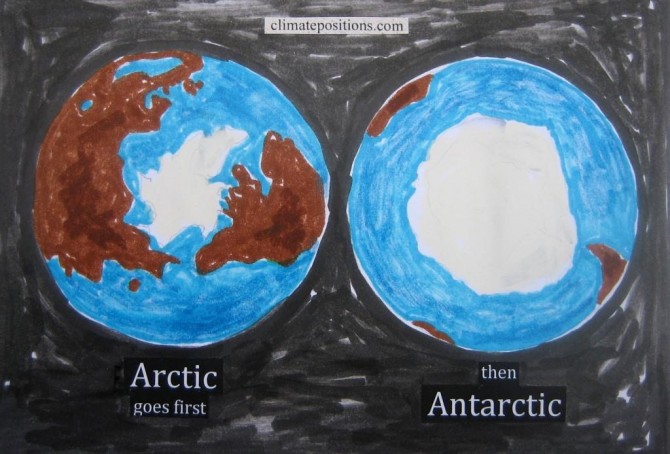
Sea level rises 58 m if all fossil fuels are extracted and burned
2015
A new ’simulation-study from Postdam Institute for Climate Impact Research’ shows that the Antarctic ice sheet would melt, causing the world’s sea level to rise about 58 m, if all the world’s resources of coal, oil and gas are extracted and burned. The following highlight some of the assumptions and outcomes of the study and besides visualize 30 m and 60 m sea level rise in fourteen of the world’s twenty largest cities (Tokyo, New York City, Seoul, Mumbai, Karachi, Osaka, Shanghai, Beijing, Calcutta, Cairo, London, Dhaka, Paris and Rio de Janeiro).
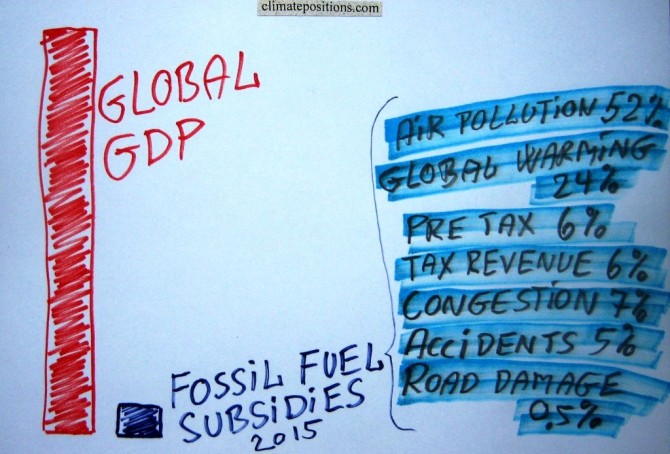
Fossil fuel subsidies: $5.3 trillion in 2015 (IMF survey)
2015
Estimates from the ‘International Monetary Fund’ (IMF) show that fossil fuel subsidies of 155 countries representing 98% of the world’s population, amounted $4.2 trillion (5.8% of global GDP) in 2011 and $4.9 trillion (6.5% of global GDP) in 2013. Projections for 2015 suggest $5.3 trillion (6.5% of global GDP). This huge amount of subsidies is of cause plain stupid.
For comparison, the total ‘Climate Debt of 147 countries‘ in ClimatePositions, accumulated between 2000 and 2013, amounted $5.2 trillion. Roughly speaking, one year of global subsidies equals the total accumulated Climate Debt. Note that global climate change funding is only around $0.14 trillion.

IPCC worst case scenarios from 1990 and 2014 (in comparison with the actual global warming)
2014
In October 2014 IPCC’s Fifth Assessment Synthesis Report 2014 was released (IPCC = Intergovernmental Panel on Climate Change). The Summary for Policymakers (40 pages), the Headline Statements (2 pages), the Presentation (PowerPoint, 26 dias) and a Longer Report (116 pages) are available ‘here’. The four sub-reports 2013-2014 (a total of 5622 pages) are available ‘here’. The presentation of the gloomy message is overwhelming and totally confusing to common people (is that really necessary?).
Carbon cycle for beginners
2014
Carbon is one out of 118 known chemical elements and symbolized with a “C” (as in CO2). Carbon is globally spread and essential for all life (18.5% of the human body mass is carbon). However, only around 0.003% of the carbon on earth is within living organisms and possibly the double occur in ancient organic deposits of coal, oil, gas and peat. Pure carbon can be chemically composed several ways, for example in the form of diamond, graphite, graphene or simply as amorphous carbon. See this short instructive video: ‘Carbon – Periodic Table of Videos (10:02)’. Carbon forms almost ten million known compounds with other chemical components, which is more than any other chemical element. Carbon dioxide (or CO2) is one compound, composed of one atom of carbon (C) and two atoms of oxygen (O2). Methane (or CH4) is another, composed of one atom of carbon and four atoms of hydrogen.

Invasive species, climate change and mass extinction
2014
There is a lack of standard terminology for invasive species. Some used definitions¹ seem artificially twisted so that Homo sapiens can’t be classified as an invasive species (which of cause is absurd since we are the worst). My own definition used in this article is this: “Invasive species are animals and plants introduced into places out of their natural range of distribution, where they have a tendency to spread and generate a negative impact on the local ecosystem and species.” This clarifies three disputes: a) A species can be invasive and not invasive at different times and different places, b) consequently, not all Homo sapiens are necessarily invasive, and certainly not all the time and c) transportation by plane, ship, train, vehicle, etc. often carry animals (including Homo sapiens) and plants further than their natural range of distribution. This opens up for analyzes.
Methane, greenhouse effect and feedback loops
2014
Methane (CH4) is the third most prevalent greenhouse gas after carbon dioxide (CO2) and water vapor. Approximately one fifth of the anthropogenic greenhouse gas effect is caused by methane and slightly over half of the total methane emissions are due to human activity¹. The data of methane and carbon dioxide in the atmosphere since 1980 is available ‘here’. Since the 1800s, atmospheric methane concentrations have increased annually at a rate of about 0.9% (doubled in 200 years) and the present concentration has not been higher for over 800,000 years (see the atmospheric contrations ‘here‘). However, 3-4 billion years ago there was 1,000 times more methane in the atmosphere and oxygen did not become a major part of the atmosphere until photosynthetic organisms evolved later in the world’s history. The following gives a brief introduction to methane with emphasis on the interaction with carbon dioxide and the potential global warming feedback loops.

Personal CO2 Emissions and instant reductions
2014
People ask: What can I do to reduce emissions? The following describes various sources of personal CO2 Emissions and suggest some instant reductions. In the bottom is a list of the 80 worst performing countries in ClimatePositions and their Contribution Free Level of CO2 Emissions per capita by 2014. By comparing the Contribution Free Level (for example 5.1 tons per person in the United Kingdom) and the effect of your personal reductions you get an idea of climate sustainability. In this way, you can calculate your own “carbon footprint” and then compare that with the calculated Contribution Free Level.
CO2 Emissions from flights
2014
Since the early 1990s the passenger-kilometers of flights worldwide has increased by 5-6% per year. The CO2 Emissions (carbon dioxide) per passenger kilometer vary due to difference in flight distances¹, aircrafts and load factors (percent of occupied seats) – with average load factors First Class and Business Class are causing nine- and three-times higher emissions per passenger than Economy Class, as one study suggests². Furthermore the mixed exhaust from flights causes 2-4 times more global warming than only CO2 emitted from engines on the ground³. The accumulated climate-effect from flights might be as high as 7-9% of the total effect from anthropogenic greenhouse gases4. However, the following examines only the CO2 Emissions from flights and the implied national costs in Climate Contributions (climate debt). But first see these three seductive animations (from ‘nats‘) with 24-hours flights over ‘Europe 1:59‘, ‘Middle East 1:11‘ and ‘North Atlantic 1:52‘.