
Update of GDP(ppp-$) 2013
2014
The Climate Contributions (climate debt) in ClimatePositions increases with growing GDP(ppp-$)¹. The 2013 updates and adjustments back in time have now been released (see the ‘World Bank’). For some countries, this means large growth of GDP(ppp-$) since 2000 and thus large increases in Climate Contributions. In other words, the previous data tended to be too modest with respect to the wealth of many countries, in particular Iraq, Jordan, Indonesia, Kazakhstan and Egypt, and the rich authoritarian oil regimes Kuwait, Oman, Saudi Arabia and Qatar. The updated Climate Contributions per capita worldwide are available ‘here’ and in the spreadsheet in the menu ‘Calculations‘. See the Climate Contributions as a percentage of the annual GDP(ppp-$) ‘here‘.
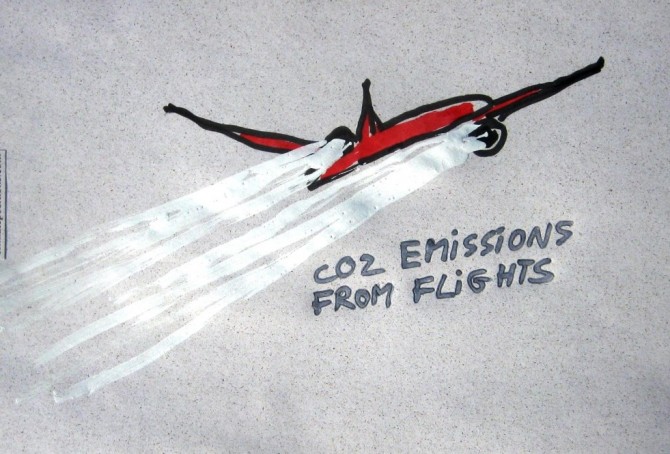
CO2 Emissions from flights
2014
Since the early 1990s the passenger-kilometers of flights worldwide has increased by 5-6% per year. The CO2 Emissions (carbon dioxide) per passenger kilometer vary due to difference in flight distances¹, aircrafts and load factors (percent of occupied seats) – with average load factors First Class and Business Class are causing nine- and three-times higher emissions per passenger than Economy Class, as one study suggests². Furthermore the mixed exhaust from flights causes 2-4 times more global warming than only CO2 emitted from engines on the ground³. The accumulated climate-effect from flights might be as high as 7-9% of the total effect from anthropogenic greenhouse gases4. However, the following examines only the CO2 Emissions from flights and the implied national costs in Climate Contributions (climate debt). But first see these three seductive animations (from ‘nats‘) with 24-hours flights over ‘Europe 1:59‘, ‘Middle East 1:11‘ and ‘North Atlantic 1:52‘.
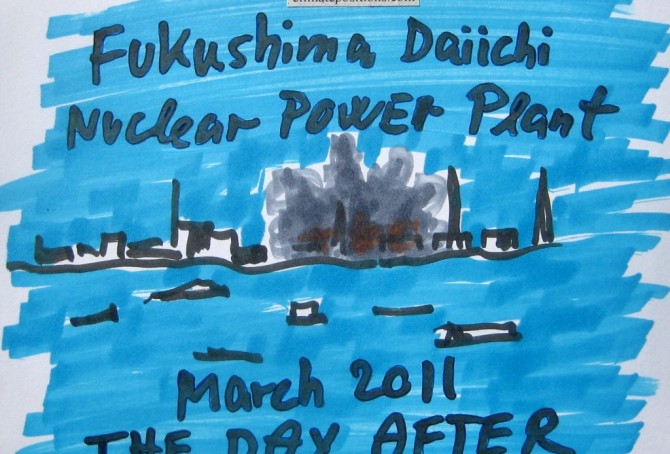
Nuclear Power updates 2013
2014
The world’s Nuclear Power generation increased marginally in 2013 compared to 2012. The last four years of generated global nuclear electricity was:
- 2010: 2,629 billion kWh
- 2011: 2,516 billion kWh
- 2012: 2,346 billion kWh
- 2013: 2,359 billion kWh
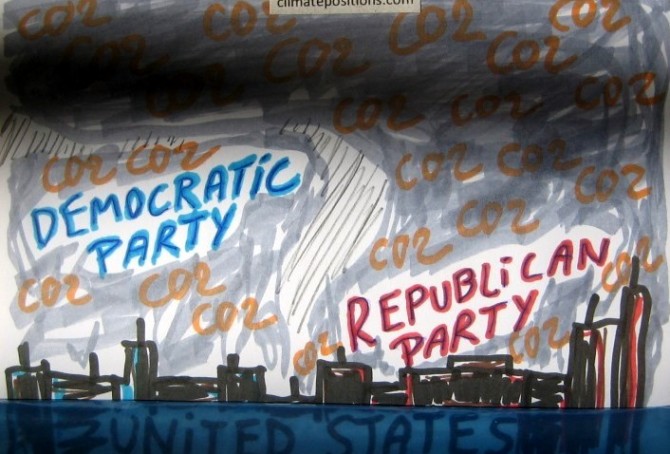
United States: Republican states double up in CO2 Emissions compared to Democratic states
2014
The United States was responsible for 42.8% of the global Climate Contribution (climate debt) of $2,834 billion in ClimatePositions 2010. The US climate debt as an annual percentage of GDP(ppp-$) since 2000 was 0.82% (the global ranking was 11th; see ‘here’). How the rich and diverse country will finance its climate debt and reduce CO2 Emissions is of course a domestic issue. The following examines the CO2 Emissions and average Climate Contributions (climate debt) of 27 Democratic and 24 Republican states (the presidential election in 2012).

Pisa scores, CO2 Emissions and climate debt
2014
510,000 15-year old students from 65 countries were Pisa tested and ranked in Mathematics, Reading and Science in 2012. The following compares the average Pisa scores with 1) CO2 Emissions per capita and 2) Increase in Climate Contributions (climate debt) since 2010. The question is this: Do the countries which successfully emphasize “clever students” also emphasize climate responsibility and reductions in CO2 Emissions? Or may the student’s impressive skills be aimed at other national goals, such as economic growth?
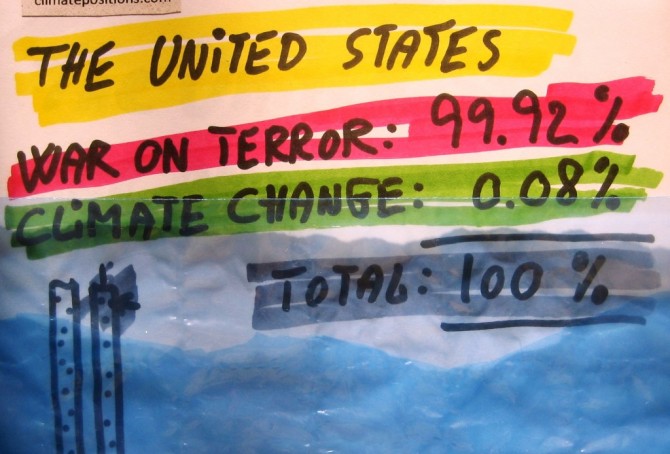
The United States’ war on terror and climate change
2014
Since dawn the United States has thwarted a binding global climate agreement – if necessary by the use of illegal spying on countries with opposing plans. The U.S. negotiating line is now the main track at the COP Summits and the rest is sadness. Now, U.S. Secretary of State John Kerry says that climate change ranks among the world’s most serious problems, such as disease outbreaks, poverty, terrorism and the proliferation of weapons of mass destruction (more about his speech ‘here’). But how much money has the United States spent on the so called “war on terror”? … And how much addressing the climate change disaster?
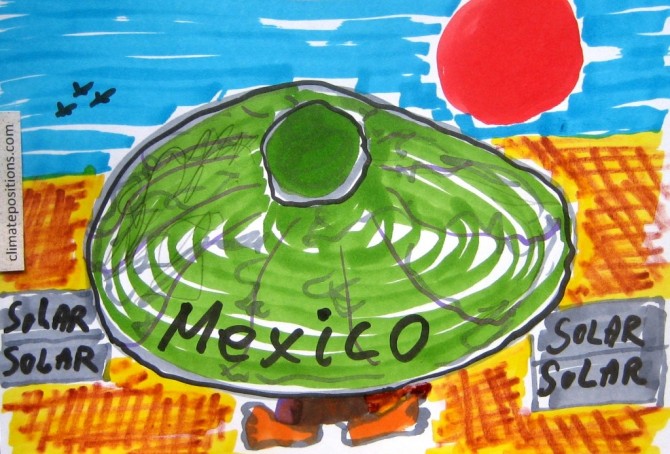
Climate performance of Mexico and neighboring countries
2014
The Mexican CO2 Emissions per capita over time are similar to the world trend (see the diagram) and Mexico is the world’s 12th largest CO2 emitter. Together with the neighboring countries Mexico represent the full range of Climate Contributions (climate debt) worldwide. The following examines the statistics of Mexico in comparison with United States, Guatemala, El Salvador and Honduras.

Outsourcing of CO2 Emissions from the United States to China
2014
If the United States reduced the CO2 Emissions produced inside its borders and the dirty productions as a competitive consequence moved to China (or elsewhere), the positive impact on the climate would vanish. This obvious dilemma can only be solved if both countries sign a binding climate agreement with solid and fair CO2 Emission targets – which the two countries reject (read more on their COP positions ‘here’). The position of the United States is particularly perverted: 1) Reduction-targets of national CO2 Emissions must be voluntary and 2) Investments in climate actions must be profitable. The bizarre U.S. vision is to create a new global commercial market for voluntary climate investments, a commercial market with parallels to the United States, the homeland of the climate chaos.
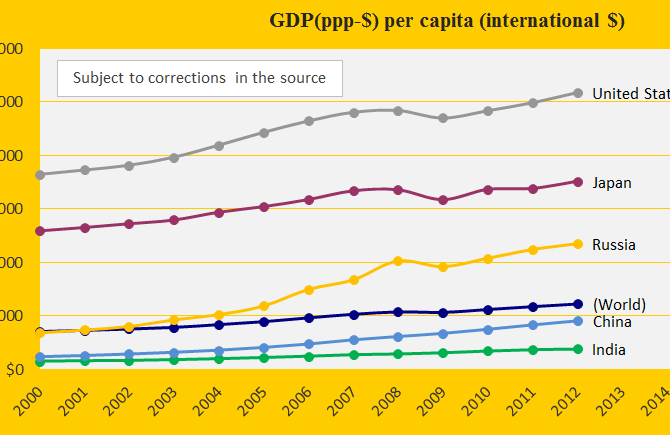
2012 update of GDP in ClimatePositions
2014
The annual national GDP(ppp-$) (standard of living measured by purchasing power) has a direct impact on the Climate Contributions. Updating of GDP for 2011 and 2012 are now entered ClimatePositions (Excel) and for most countries, this means considerable increases in the Climate Contribution (climate debt). In connection with the GDP update, a minor simplification of the calculation method has been made (recent years are still weighted more than previous years in GDP+).
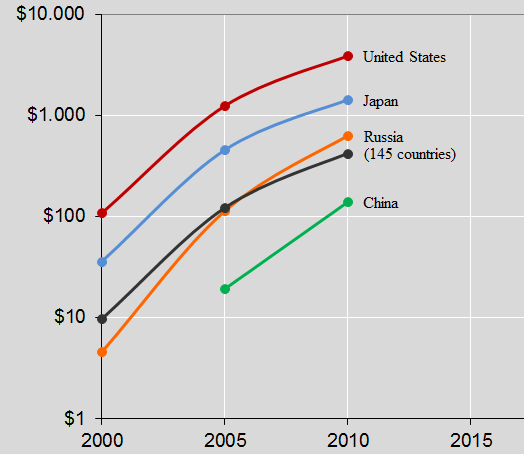
The diagram shows the updated (and revised) GDP(ppp-$) 2000-2012 for the five largest CO2 Emitters: China, United States, Russia, India and Japan.
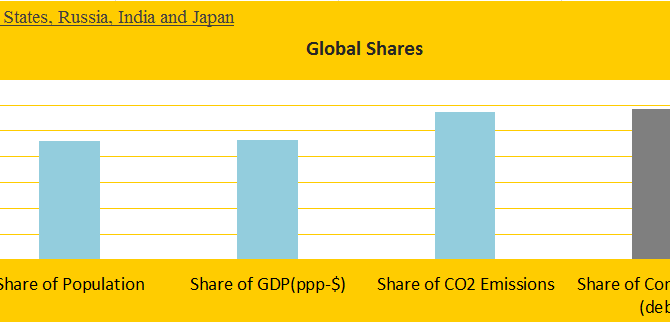
COP19 negotiating positions: China, United States, India, Russia and Japan
2014
The world’s five largest CO2 emitters – China, United States, Russia, India and Japan – are responsible for 57% of global CO2 Emissions (2006-2010) and 58% of the Climate Contributions (climate debt) in ClimatePositions 2010 (see the front diagram). Add to the group the populous Contribution Free countries Pakistan, Bangladesh, Nigeria, Philippines and Ethiopia and the total share would almost reflect the world average of Population (56%), CO2 Emissions (59%) and Climate Contributions (58%). Leaders of these ten countries sitting around an imaginary negotiating table should be able to create a global climate agreement with binding CO2 reductions and full financing – but it will not happen!
The following depicts the submissions, basic statistics and negotiating positions at COP19 in Warsaw of the five largest CO2 emitters. See the five countries’ Contributions over time ‘here‘, the Contributions as a percentage of GDP ‘here‘ and read about the COP19 country groups ‘here‘.
Climate Contributions as a percentage of GDP for the top ten CO2 Emitters
2013
The top ten CO2 Emitters were responsible for 67% of the global CO2 Emissions in 2006-2010. Adjusting the national Contributions (climate debt) for the size of the GDP(ppp-$) is essential. Allowing the wealthy United States get away with paying the same dollar price of a ton of CO2 (carbon dioxide) exceeded as China is of course absurd. The countries’ climate change performances are measured indirectly as the Contributions’ percentage of the national GDP(ppp-$).

Five Eyes Alliance is watching you
2013
Australia, Canada, New Zealand, United Kingdom and United States are secretly watching private mails, phone calls etc. worldwide – secretly until Snowden whistled. All five countries’ are defined as Full Democracies but the self-righteous surveillance activities take place in the closed Five Eyes Alliance (see ‘UKUSA Agreement‘ and ‘Echelon‘) with United States (read NSA) as Big Brother.
Climate performance: Canada versus United States
2013
North America’s 7% of the Global Population accounted for 47% of the global Climate Contributions (climate debt) in ClimatePositions 2010. Canada was the 8th worst performing country out of 145 and United States was the 7th. Most indicators on Canada and United States follow the same trends over time, some with slightly different levels, however.

Obama hoping for change
2013
United States is not only notorious for illegal surveillance, waterboarding, illegal wars and imprisonments without trial – the country is also primarily responsible for climate change. While the oceans are rising Barak Obama is hoping for change (see the Sea Level rise in the diagram below).

Global warming: China in its own CO2 Emission league
2013
Global warming is caused mainly by human CO2 Emissions.The diagram above shows China’s annual CO2 Emissions (carbon dioxide) in tons per capita 2000-2011 (the black bars). The green bars show the Contribution Free Levels in ClimatePositions. The free level of CO2 Emissions is dependent on various indicators (see the menu “Calculations/Indicators”). China was the 57th worst performing country out of 145, in terms of Contribution (climate debt) per capita. The total national Contribution increased from 26 billion US$ in 2005 to 185 billion in 2010. This explosive negative development is outstanding in the world and China is now by far the largest CO2 Emitter.
Top 5 CO2 Emitters’ Climate Contributions (climate debt) over time
2013
The 5 largest CO2 Emitters in 2006-2010 were 1. China (23,2%), 2. United States (19,7%), 3. Russia (5,3%), 4. India (5,1%) and 5. Japan (4,0%). These 5 countries accounted for 57,3% of the global CO2 Emissions (carbon dioxide). The diagram above shows the Contributions (climate debt) per capita in 2000, 2005 and 2010 (the black line is the global average). India was Contribution Free. Note the logarithmic scale. On the list of the worst performing countries (climate debt per capita) the ranking in 2010 was as follows: United States (no. 7), Japan (no. 18), Russia (no. 31), China (no. 57) and India (Contribution Free). See the full country list in the menu Contributions/Per Capita US$ Rank.
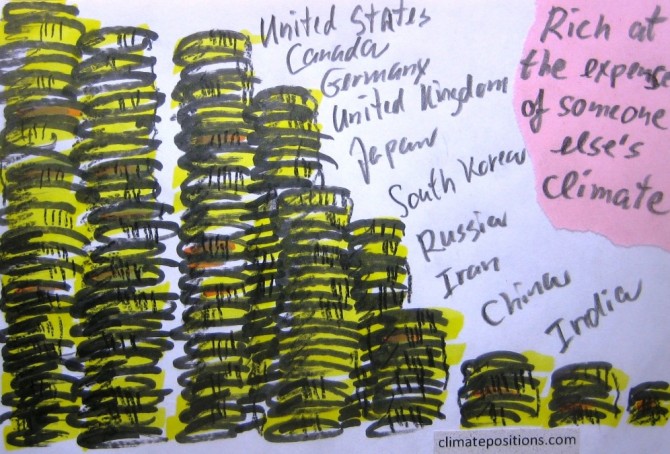
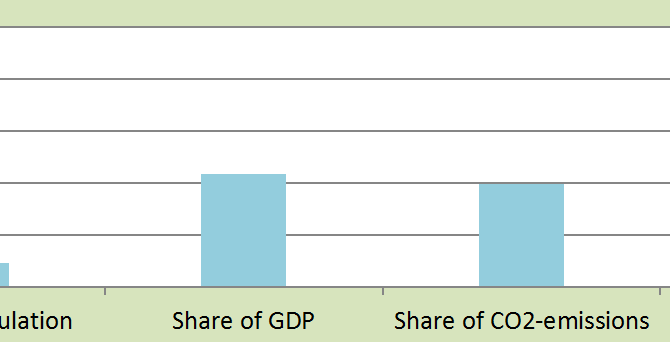
Full Democracies means large Climate Contributions (climate debt)
2013
The diagram shows 23 Full Democracy countries’ total share of the global: 1) Population (13%), 2) GDP(ppp-$) (51%), 3) CO2 Emissions (39%) and 4) Contributions (debt) (74%). Only 1/8 of the people on the planet live in other words in Full Democracies and they are accountable for 3/4 of the global Contributions (climate debt) in ClimatePositions 2010. Also the ecological footprint (excluding CO2 Emissions) of a majority of these 23 countries is very large, with an average of 2.7 EPI. Obviously democracies in general are still flawed when it comes to planet responsibility and climate change response. Costa Rica is the only Contribution Free country on the Full Democracy list (more about Costa Rica soon).
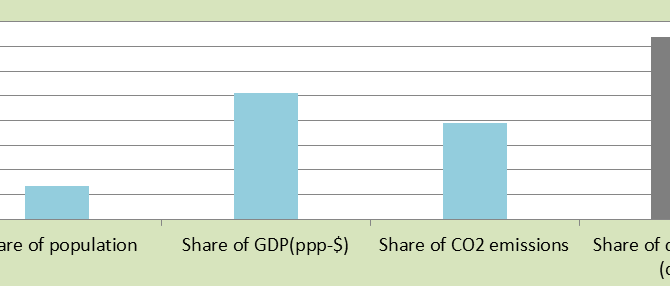
United States’ giant share of the global Climate Contributions (climate debt)
2013
United States was the 7th worst performing country out of 145 in ClimatePositions 2010 (see the menu Contributions/ Per Capita US$ Rank). What make United States the major climate problem on a global scale however, is the country’s size, wealth and failed performance.