
Climate Debt: The United Arab Emirates ranks 4th (climate destruction branded by sports!) … soon with Nuclear Power
The per capita Climate Debt of the United Arab Emirates (UAE), accumulated since 2000, is $11,865, which ranks the rich oil-state 4th among 148 countries (see the ‘Ranking‘ by January 2016). Before proceeding, read these ten pinpoints of the intolerable situation:
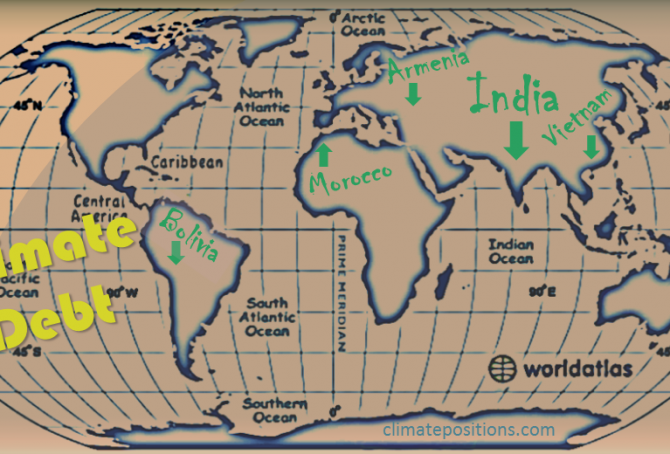
India’s Climate Debt is on track for something big
2016
India’s accumulated Climate Debt is $13 per capita which ranks the populous country 84th among 148 countries (see the ‘Ranking’). The current share of the fast growing global Climate Debt is 0.29%, compared to 0.04% in 2010. The following examines India’s CO2 Emissions (the increase-rates is compared to the historic Chinese rates), Environmental Performance, GDP(ppp-$) and Climate Debt in comparison with Vietnam, Morocco, Armenia and Bolivia, all ranked between 77th and 82nd.
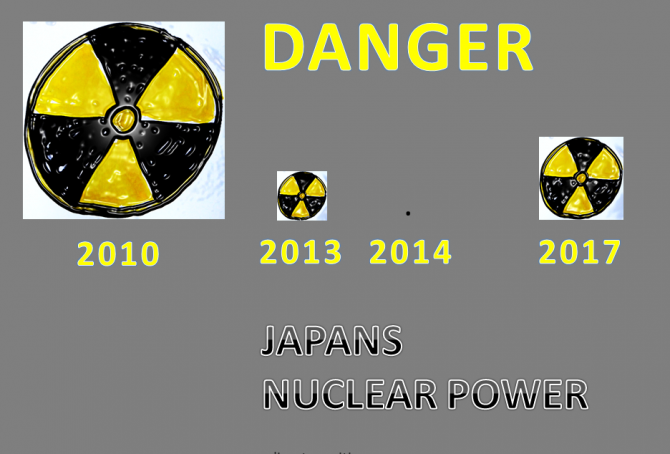
Japans Climate Debt after the Nuclear Power shutdown
In 2010 near 27% of Japans electricity supply was generated by Nuclear Power – in 2012, shortly after the Fukushima nuclear disaster in 2011, the percentage was below 2%. How did Japan respond to this energy shock and how did it influence the Climate Debt in ClimatePositions? The following examines the Nuclear Power (and electric energy mix), CO2 Emissions, GDP(ppp-$) and Climate Debt.
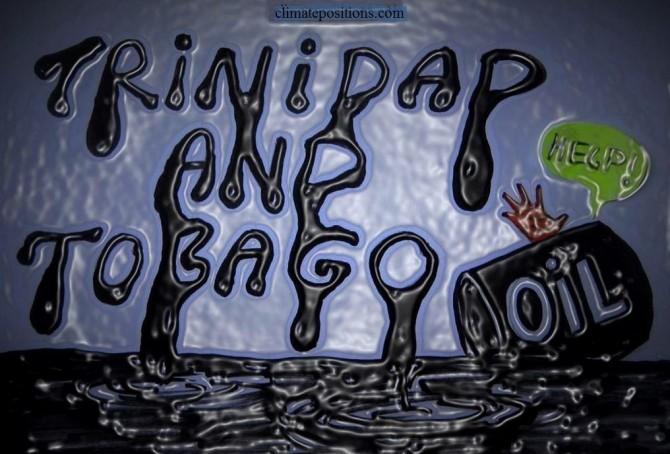
Climate Debt: Trinidad and Tobago ranks 3rd (the percentage of GDP is World’s highest)
Sometimes small countries behave extremely destructive, more or less unnoticed by the public. This article is about such a country. Each of the 1.2 million inhabitants of the islands Trinidad and Tobago emitted, on average, 37.1 tons of CO2 from Fossil Fuels (without bunker fuels) and cement production in 2011 … only Qatar emitted more. The islands close to Venezuella has the 3rd largest per capita Climate Debt and by far the world’s largest Climate Debt measured as percentage of GDP(ppp-$).

Climate Debt: Kuwait ranks 2nd … however, soon with “cleaner” fossil fuels!?
The current Kuwaiti Climate Debt, accumulated since 2000, is $26,347 per capita and the ‘Ranking’ is 2nd among 148 countries. However, the extremely wealthy authoritarian oil state plans to generate a “low carbon economy” by creating “refinery alternatives with lower emissions and produce cleaner fuels” … according to a Google translation of the COP21 Submission 2015, written only in Arabic, Kuwait claims to be a developing country and consequently it expects developed countries to pay for its climate change mitigation, technology transfer etc. All this is of course greedy nonsense and inconsistent with the collectively agreed “efforts to limit the temperature increase to 1.5°C.” Seriously, the Kuwaiti problem is this: Around 61% of all known extractable gas reserves in Middle East and 38% of all known oil reserves will have to stay in ground beyond 2010 if global warming is to be limited to 2°C¹. Once a schedule for such a genuine low carbon economy is on track, Kuwait might again become a developing country with reasonable funding wishes. The following examines Kuwait’s CO2 Emissions, Environmental Performance, GDP(ppp-$) and Climate Debt.
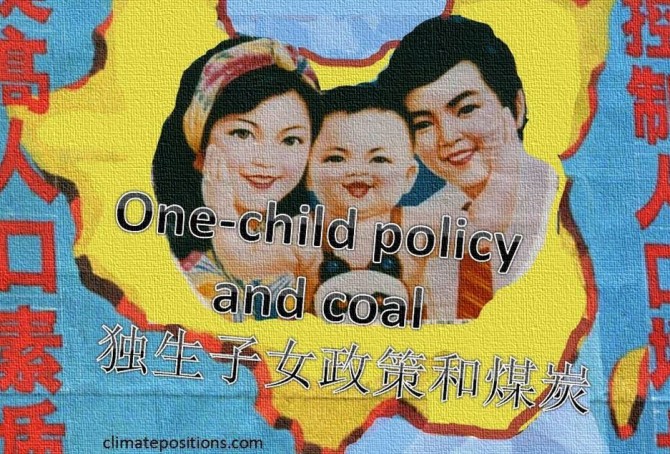
China’s share of the global Climate Debt is growing fast
In 2010 China’s share of the global Climate Debt was 7.4% and by January 2016 it has grown dramatically to 13.3% (see the ‘ranking’). Since 2000 the Chinese share of the growing global CO2 Emissions has grown from 13.7% to about 29.0% (preliminary emissions by 2014). Luckily, the populous superpower has committed itself to pursue “efforts to limit the temperature increase to 1.5 °C” … according to the COP21 Paris Agreement. The following examines the development of CO2 Emissions, Environmental Performance, GDP(ppp-$), Climate Debt and Population (with respect to the one-child policy).

The United States’ huge share of the growing global Climate Debt is decreasing
Worldwide, eyes are on the United States due to its massive historic greenhouse gas emissions and its sabotage of attempts to reach a fair and globally binding reduction agreement. Instead, the world is stocked with “intended nationally determined contributions towards achieving the objective […] consistent with holding the increase in the global average temperature to well below 2°C above preindustrial levels and pursuing efforts to limit the temperature increase to 1.5°C.” If this baloney-goal is to be taken seriously, then the United States must cut emissions from fossil fuels by around 80% (give and take), within fifteen years, or so. The following examines the development of CO2 Emissions, Environmental Performance, GDP(ppp-$) and accumulated Climate Debt.
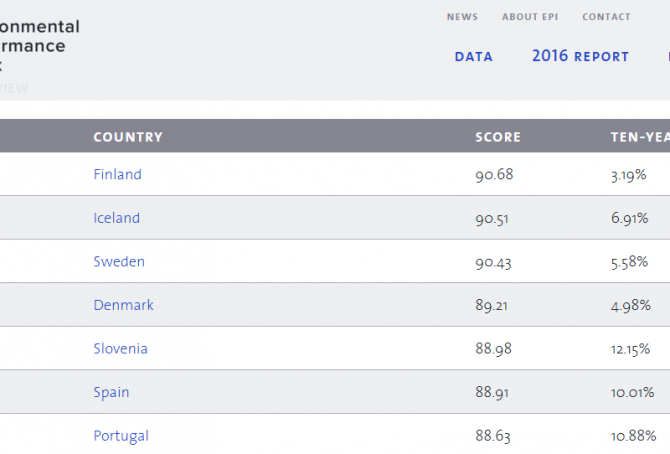
Environmental Performance Index 2016: Ranking of 180 countries
Every second year Yale and Colombia Universities, in collaboration with the World Economic Forum, publish an Environmental Performance Index (EPI) with global ranking. The 2016 edition with ‘Ranking of 180 countries‘ is now available – click on individual countries at the sourse to see more details on Biodiversity and Habitat, Forests, Climate and Energy, Fisheries, Agriculture, Water Resources, Water and Sanitation, Health Impacts and Air Quality. Scores are converted to a scale of 0 to 100, with 0 being the worst observed value and 100 the best. The seven best performing countries are ranked in the table (copied from the site).

Climate Debt: Qatar ranks 1st … while buying FC Barcelona branding with Fossil Fuel revenue
The authoritarian oil state of Qatar is a prime example of the titanic hypocrisy written into numerous ‘pledges (INDCs) prior to COP21‘ in Paris. The overall objective of the Paris Agreement is to limit global warming to 1.5-2°C compared to pre-industrial times. Consequently, the major part of all known global fossil fuel reserves will have to stay in ground. Today, Qatar is the largest per capita fossil fuel producer, the largest per capita fossil fuel CO2 emitter and the richest country in the world. Therefore, it comes as no surprise that Qatar also has the largest accumulated per capita Climate Debt in ClimatePositions (see the updated ‘ranking’ by January 2016).
Back in 2008 the ‘Qatar National Vision 2030’ stated that: “Qatar’s progress has depended primarily on the exploitation of its oil and gas resources. But the country’s hydrocarbon resource will eventually run out.” And then this monster of a fake statement: “Qatar will meet the needs of this generation without compromising the needs of future generations.” The fact is that Qatar since 2008 has increased CO2 Emissions from fossil fuels by 48% and fossil fuel production by around 67%. The following examines ‘Qatar’s 2015-pledges (INDCs)‘, CO2 Emissions, GDP(ppp-$), Climate Debt and the shiny branding bought with fossil fuel revenue.
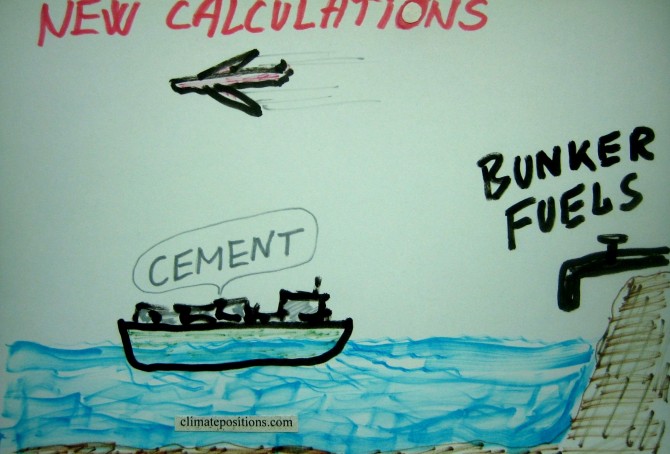
ClimatePositions: CO2 Emission-data now include cement production (and exclude bunker fuels)
So far, ‘EIA’ has been the source of national CO2 Emissions in ClimatePositions. EIA include emissions from burning of fossil fuel, including bunker fuels (fuels used for international aviation and maritime transport). Globally, bunker fuels account for about 3% of all fossil fuel CO2 Emissions.
By January 2016, the source of CO2 Emissions used in ClimatePositions switches to ‘Carbon Dioxide Information Analysis Center (CDIAC)’, or simply Global Carbon Project. CDIAC also include emissions from burning of fossil fuel, but exclude emissions from bunker fuels (fuels used for international aviation and maritime transport), and instead include ‘CO2 Emissions from cement production’. Emissions from cement production (and oxidation) amount to about 5% of all fossil fuel emissions, globally. The total annual national carbon emissions at the source are subsequently converted¹ to per capita CO2 Emissions for the use in ClimatePositions. Note that emissions 2012-2014 are preliminary estimates².
For comparison, the table below shows the national shares of the global Climate Debt, respectively, with CO2 Emission data from 1) Global Carbon Project (CDIAC) and 2) EIA. Countries with increased Climate Debt, relatively, due to the conversion of sources are marked in red. The global Climate Debt will only be slightly affected by the change (the global Climate Debt is 5.7 trillion by Januar 2016).
From today, Global Carbon Project will be used as source of CO2 Emissions in ClimatePositions. New rankings are available in the menu “Climate Debt”. More comments below the table.

Update 2015: Warmest year on record … mother Earth with fever
The year 2015 was the warmest on Earth since measurements began in 1880. Both global Air Temperature and Ocean Temperature was the warmest on record. See the development in Air Temperature between 1960 and 2015 in the diagram below; the average temperature rise 1880-1937 is set at 0°C and 2015 was 1.64°C warmer.

Update 2015: Global Population now 7.35 billion (life expectancy, births rates and an alarming prediction)
The estimated Global Population increased from 7.26 billion in 2014 to 7.35 billion in 2015 – an increase of 1.2%, or 87 million, in one year. See the population growth 1960-2015 in the diagram below. Some surprising demographic trends of life expectancy and births rates, and a long term Global Population prediction, are included.

Update 2015: CO2 Content in the atmosphere has passed 400 ppm
The carbon dioxide content in the atmosphere passed 400 ppm (parts per million) in 2015 (mean). In 2014 the content was 398.61 ppm and in 2015 it was 400.83 ppm – the annually updated figure is used in ClimatePositions.
See the alarming development 1960-2015 in the diagram below. The pre-industrial level was below 300 ppm and 350 ppm is considered the relatively safe limit. Human-caused CO2 Emissions is the main cause of global warming, melting ice sheets, sea level rise and escalation of extreme weather events.
Update 2015: Sea Level rise slowly accelerates
During 2015 the average estimated rate of global Sea Level rise since 1993 increased from 3.2 mm (±0.4 mm) annually to 3.3 mm (±0.4 mm). This indicates a slowly continually accelerating rate of Sea Level rise. In ClimatePositions the Sea Level rise between 1880 and 1993 is set at 1.2 mm annually, or 14.00 cm in total, and combined this adds up to a total estimated Sea Level rise between 1880 and 2015 of 21.26 cm (this figure is used in ClimatePositions).
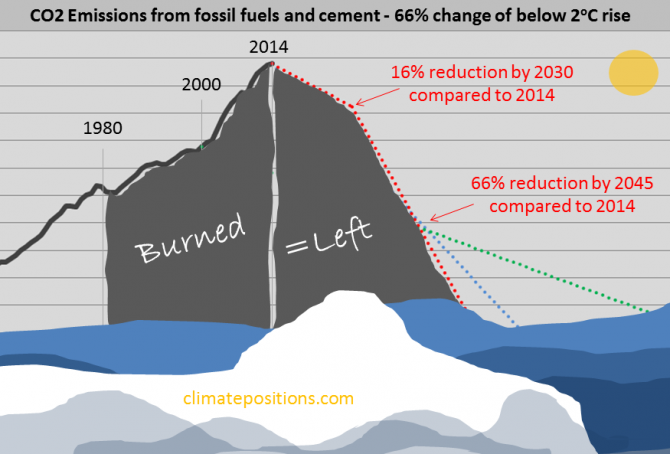
The COP21 Paris Agreement: Diplomatic triumph, self-applause … and the carbon budget
2015
The COP21 ‘Paris Agreement’ (31 p), backed by 196 countries, emphasizes the urgent need to address the greenhouse gas emission gap between the aggregate effect of the 187 intended nationally defined contributions (INDCs/pledges) and the “aggregate emission pathways consistent with holding the increase in the global average temperature to well below 2°C above preindustrial levels and pursuing efforts to limit the temperature increase to 1.5°C”. This feverish understatement about the emission gab is clarified in the ‘Synthesis report (UN)’ on the aggregate effect of the pledges. The report says that the aggregate effect of the submitted pledges (INDCs) will bring the global cumulative CO2 Emissions up to around 72%–77% of the remaining carbon budget by 2030 (emitting 100% will leave the planet with 66% change of a temperature rise of less than 2°C). In other words: If the pledges are fulfilled perfectly, then three quarters of the remaining carbon budget will be used within 15 years … and thereafter emissions will have to dive deeply to zero before 2040. The critical situation is envisioned graphically below.

Preliminary Carbon Dioxide Emissions 2014, by country
2015
’The Global Carbon Project’ at Carbon Dioxide Information Analysis Center (CDIAC) has published preliminary CO2 Emissions from fossil fuels and cement for 2014, for more than 200 countries. The data is being used in a preliminary calculation of accumulated Climate Debt in ClimatePositions¹. The table below shows the estimated per capita emissions plus the updated Climate Debts, of the twenty largest total emitters (responsible for 77% of the global emissions in 2014).
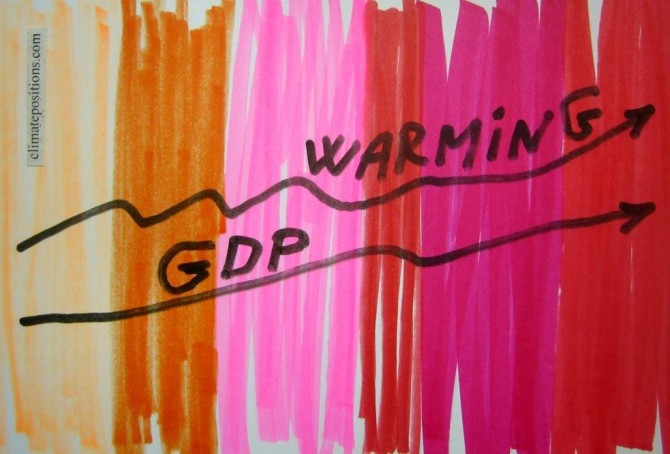
2014-updates of GDP(ppp-$) … rising along with the temperature
2015
The national Climate Debt in ClimatePositions increases with growing GDP(ppp-$)¹. 2014-updates of GDP from ‘World Bank’ are now available in ‘Calculation (Excel)’. The world’s average per capita GDP(ppp-$) grew from $14,417 in 2013 to $14,939 in 2014. The diagram below shows the development in GDP(ppp-$) in 2000-2014 of the world average and five of the world’s largest per capita fossil fuel CO2 Emitters (in 2012): Qatar (50.8 tons of CO2), United Arab Emirates (44.0 tons), Singapore (38.8 tons), Bahrain (25.8 tons) and Saudi Arabia (22.0 tons).
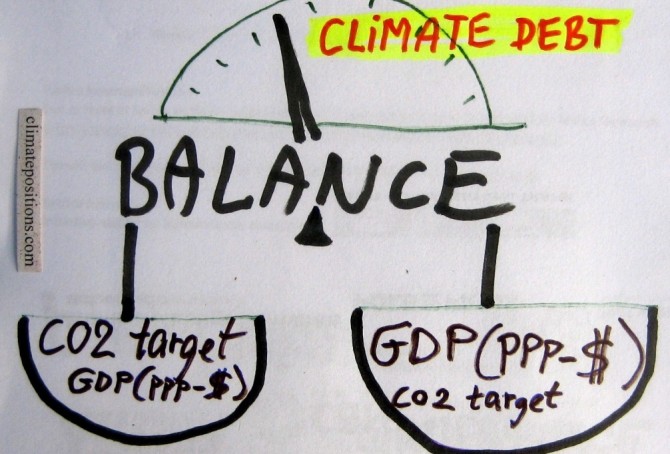
Analyses of the global CO2 target and GDP(ppp-$)
2015
The calculation of Climate Debt in ClimatePositions is based on a balance between many ‘indicators’ and a common global per capita CO2 target. To illustrate the nature of this balance twelve countries are analyzed in this article in terms of the indicator of GDP(ppp-$) and the global CO2 target. The 12-Countries Group represents 38% of the global population, 65% of the global CO2 Emissions from fossil fuels and around 70% of the global Climate Debt.

Update: Climate funding as share of Climate Debt, by country
2015
‘Climate Funds Update’ is an independent website providing information on climate finance designed for developing countries to address climate change. The data is based on information received from 25 multilateral, bilateral, regional and national climate funds and the funding is largely up to date by the end of June 2015. A total of $17 billion has currently been funded (money deposited), of which 96% is country-sourced¹. The updated table below shows the level of national climate financing to developing countries, as percentage of the accumulated Climate Debt. The values are based on the latest available updates.
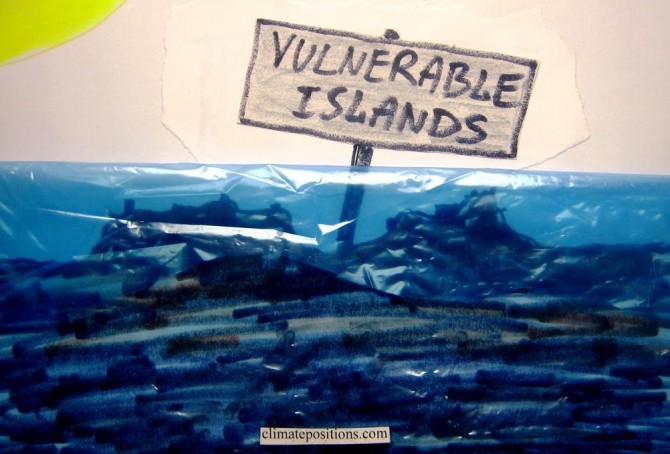
New at COP21: The Vulnerable Twenty Group (V20)
2015
Prior to COP21 in Paris in December twenty countries most at risk from the effects of global warming has formed ‘The Vulnerable Twenty Group (V20)’. Unified, the new group hopes for greater access to climate finance for adaptation and mitigation. The twenty countries representing almost one-tenth of the world’s population are: Bangladesh, Philippines, Ethiopia, Vietnam, Tanzania, Kenya, Afghanistan, Nepal, Ghana, Madagascar, Rwanda, Costa Rica, Bhutan, Timor-Leste, Maldives, Barbados, Vanuatu, Saint Lucia, Kiribati and Tuvalu. The first thirteen on the list have full data in ClimatePositions and they are all Contribution Free (no Climate Debt) among 147 countries (see the ‘ranking’). The last seven are examined below in terms of climate change performance.