Finland: Per Capita Climate Debt $2,504 (Ranked 25) – Fossil CO2 Emissions
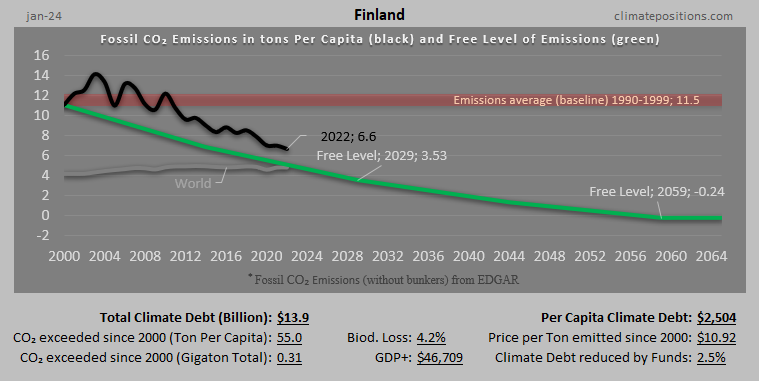
In 2024, Finland is responsible for 0.18% of the Global Climate Debt accumulated since 2000. Below are some key figures in the calculations.
Kazakhstan: Per Capita Climate Debt $2,501 (Ranked 26) – Fossil CO2 Emissions
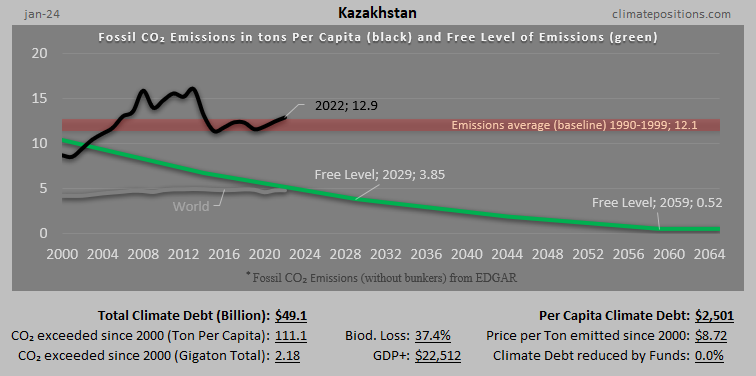
In 2024, Kazakhstan is responsible for 0.63% of the Global Climate Debt accumulated since 2000. Below are some key figures in the calculations.
Estonia: Per Capita Climate Debt $2,417 (Ranked 27) – Fossil CO2 Emissions

In 2024, Estonia is responsible for 0.042% of the Global Climate Debt accumulated since 2000. Below are some key figures in the calculations.
Slovenia: Per Capita Climate Debt $2,336 (Ranked 28) – Fossil CO2 Emissions
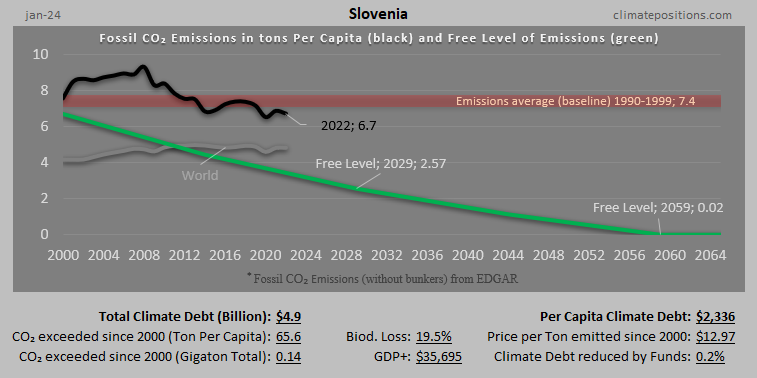
In 2024, Slovenia is responsible for 0.063% of the Global Climate Debt accumulated since 2000. Below are some key figures in the calculations.
Malaysia: Per Capita Climate Debt $2,145 (Ranked 29) – Fossil CO2 Emissions

In 2024, Malaysia is responsible for 0.93% of the Global Climate Debt accumulated since 2000. Below are some key figures in the calculations.
Russia: Per Capita Climate Debt $2,058 (Ranked 30) – Fossil CO2 Emissions
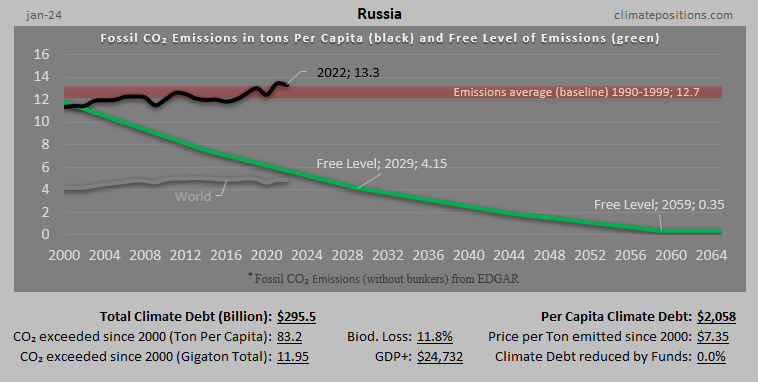
In 2024, Russia is responsible for 3.78% of the Global Climate Debt accumulated since 2000. Below are some key figures in the calculations.
Spain: Per Capita Climate Debt $1,972 (Ranked 31) – Fossil CO2 Emissions

In 2024, Spain is responsible for 1.20% of the Global Climate Debt accumulated since 2000. Below are some key figures in the calculations.
Equatorial Guinea: Per Capita Climate Debt $1,935 (Ranked 32) – Fossil CO2 Emissions
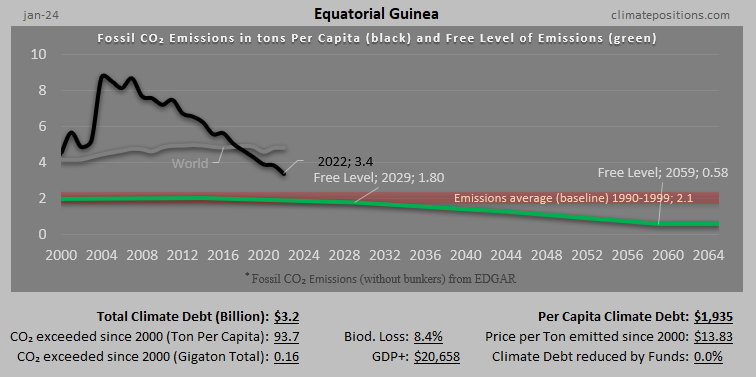
In 2024, Equatorial Guinea is responsible for 0.041% of the Global Climate Debt accumulated since 2000. Below are some key figures in the calculations.
Hong Kong: Per Capita Climate Debt $1,895 (Ranked 33) – Fossil CO2 Emissions
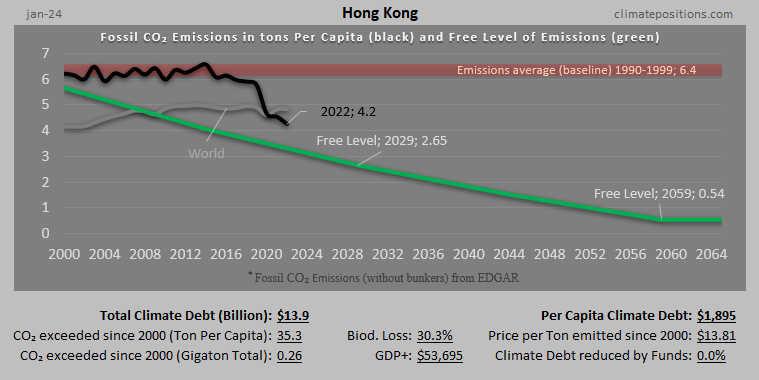
In 2024, Hong Kong is responsible for 0.18% of the Global Climate Debt accumulated since 2000. Below are some key figures in the calculations.
Switzerland: Per Capita Climate Debt $1,797 (Ranked 34) – Fossil CO2 Emissions
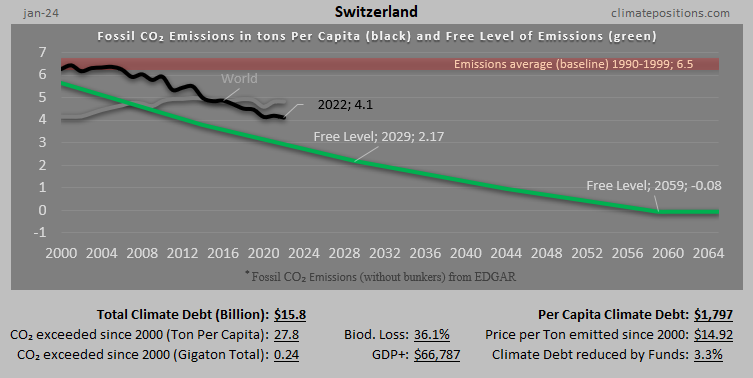
In 2024, Switzerland is responsible for 0.20% of the Global Climate Debt accumulated since 2000. Below are some key figures in the calculations.
Italy: Per Capita Climate Debt $1,747 (Ranked 35) – Fossil CO2 Emissions

In 2024, Italy is responsible for 1.31% of the Global Climate Debt accumulated since 2000. Below are some key figures in the calculations.
France: Per Capita Climate Debt $1,707 (Ranked 36) – Fossil CO2 Emissions

In 2024, France is responsible for 1.48% of the Global Climate Debt accumulated since 2000. Below are some key figures in the calculations.
United Kingdom: Per Capita Climate Debt $1,584 (Ranked 37) – Fossil CO2 Emissions

In 2024, United Kingdom is responsible for 1.36% of the Global Climate Debt accumulated since 2000. Below are some key figures in the calculations.
Libya: Per Capita Climate Debt $1,558 (Ranked 38) – Fossil CO2 Emissions

In 2024, Libya is responsible for 0.14% of the Global Climate Debt accumulated since 2000. Below are some key figures in the calculations.
Greece: Per Capita Climate Debt $1,543 (Ranked 39) – Fossil CO2 Emissions
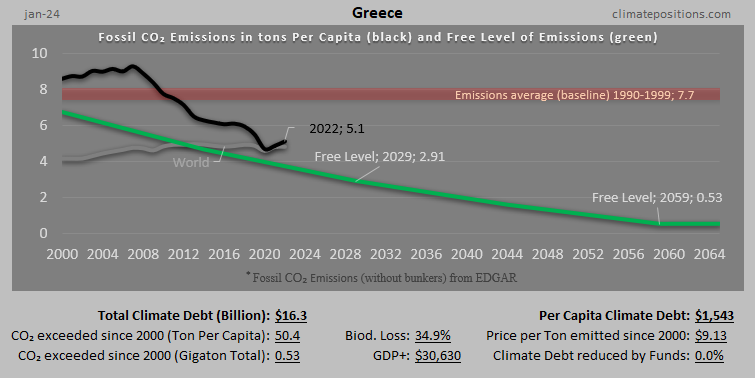
In 2024, Greece is responsible for 0.21% of the Global Climate Debt accumulated since 2000. Below are some key figures in the calculations.
Turkmenistan: Per Capita Climate Debt $1,507 (Ranked 40) – Fossil CO2 Emissions

In 2024, Turkmenistan is responsible for 0.12% of the Global Climate Debt accumulated since 2000. Below are some key figures in the calculations.
Cyprus: Per Capita Climate Debt $1,364 (Ranked 41) – Fossil CO2 Emissions
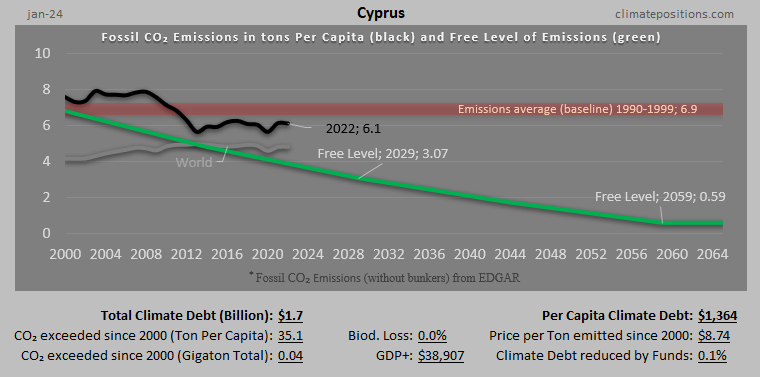
In 2024, Cyprus is responsible for 0.022% of the Global Climate Debt accumulated since 2000. Below are some key figures in the calculations.
Poland: Per Capita Climate Debt $1,343 (Ranked 42) – Fossil CO2 Emissions
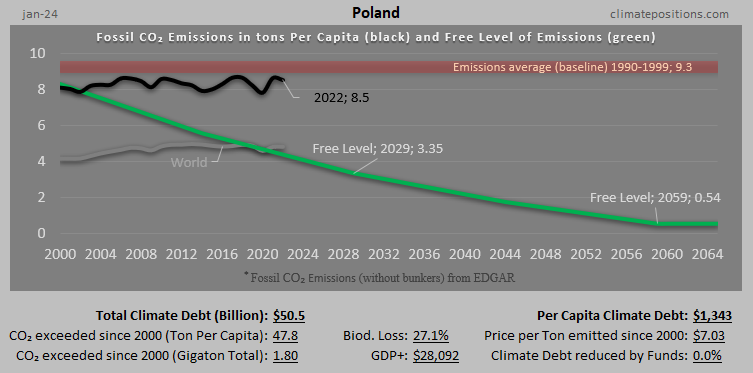
In 2024, Poland is responsible for 0.64% of the Global Climate Debt accumulated since 2000. Below are some key figures in the calculations.
Iran: Per Capita Climate Debt $1,321 (Ranked 43) – Fossil CO2 Emissions
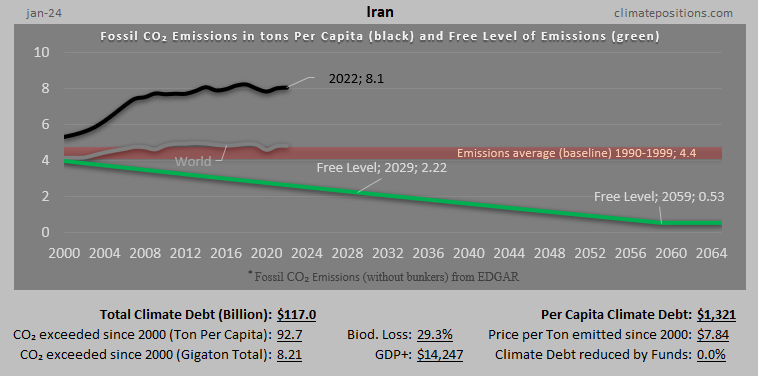
In 2024, Iran is responsible for 0.49% of the Global Climate Debt accumulated since 2000. Below are some key figures in the calculations.
China: Per Capita Climate Debt $1,240 (Ranked 44) – Fossil CO2 Emissions
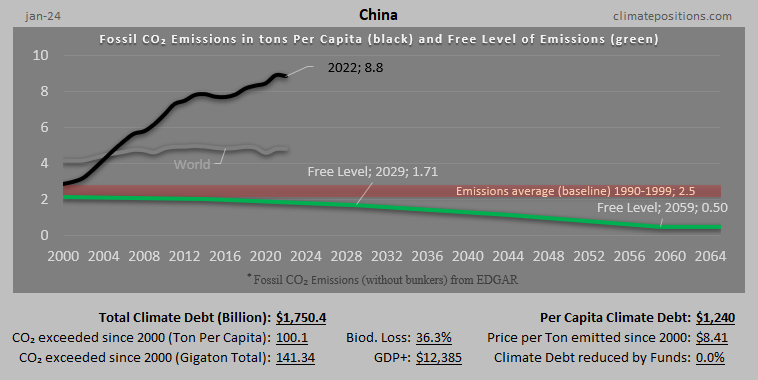
In 2024, China is responsible for 22.37% of the Global Climate Debt accumulated since 2000. Below are some key figures in the calculations.