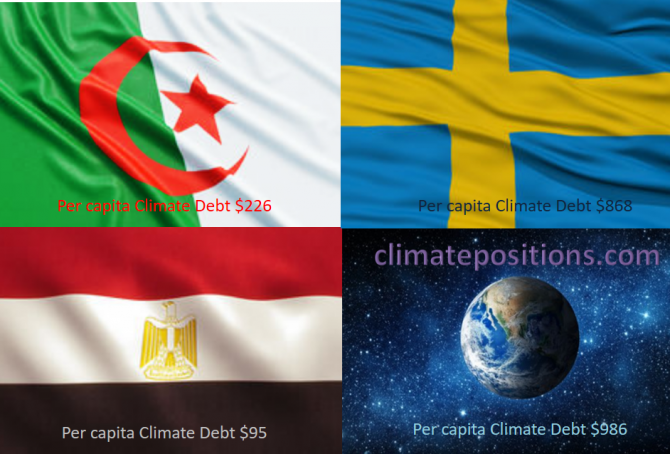
Share of global Climate Debt rank 46th, 47th and 48th: Algeria, Egypt and Sweden (combined responsible for 0.37% of Climate Debt and 1.18% of Fossil CO2 Emissions 2016)
2017
The diagram below shows ‘Share of global Climate Debt‘ in 2010, 2015 and 2017 of Algeria, Egypt and Sweden (ranked 46th, 47th and 48th). The Algerian share has increased continuously, whereas the Egyptian and the Swedish shares appear to have peaked around 2015.
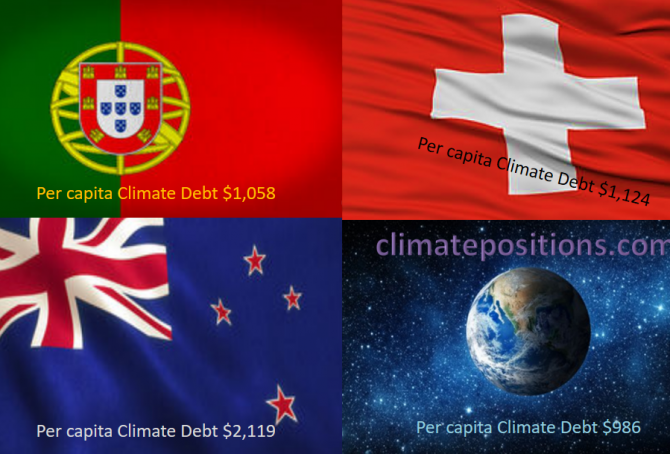
Share of global Climate Debt rank 43rd, 44th and 45th: Portugal, New Zealand and Switzerland (combined responsible for 0.42% of Climate Debt and 0.34% of Fossil CO2 Emissions 2016)
2017
The diagram below shows ‘Share of global Climate Debt‘ in 2010, 2015 and 2017 of Portugal, New Zealand and Switzerland (ranked 43rd, 44th and 45th). The shares of Portugal and New Zealand are decreasing, whereas the Swiss share is stable.
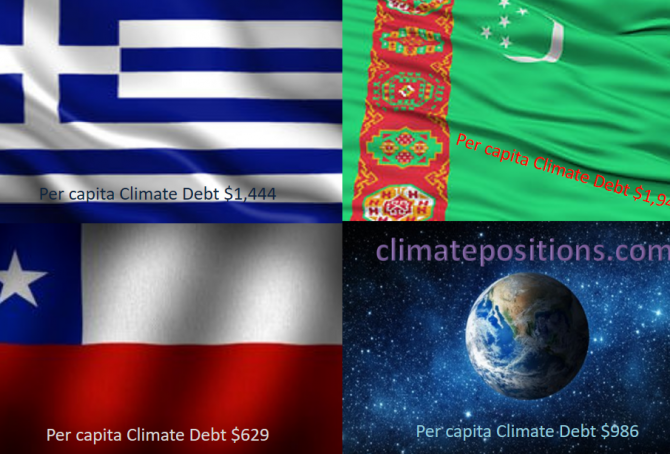
Share of global Climate Debt rank 40th, 41st and 42nd: Greece, Chile and Turkmenistan (combined responsible for 0.52% of Climate Debt and 0.64% of Fossil CO2 Emissions 2016)
2017
The diagram below shows ‘Share of global Climate Debt‘ in 2010, 2015 and 2017 of Greece, Chile and Turkmenistan (ranked 40th, 41st and 42nd). The share of Greece is decreasing, while the shares of Chile and Turkmenistan are increasing.
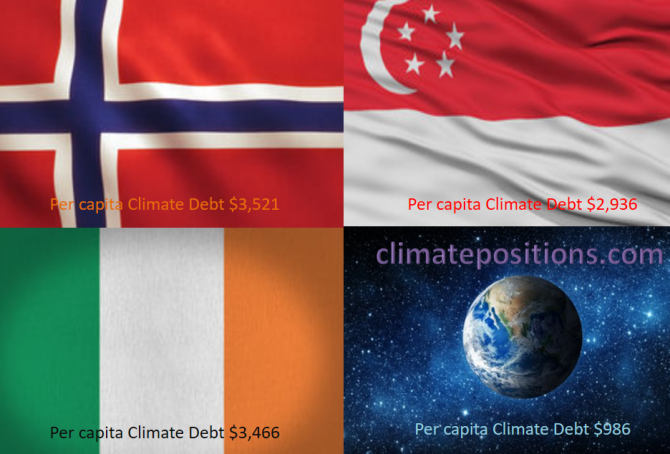
Share of global Climate Debt rank 37th, 38th and 39th: Norway, Ireland and Singapore (combined responsible for 0.71% of Climate Debt and 0.37% of Fossil CO2 Emissions 2016)
2017
The diagram below shows ‘Share of global Climate Debt‘ in 2010, 2015 and 2017 of Norway, Ireland and Singapore (ranked 37th, 38th and 39th). Norway’s share is decreasing, whereas Singapore’s is increasing. Ireland’s impressive decrease seems to have reversed lately.
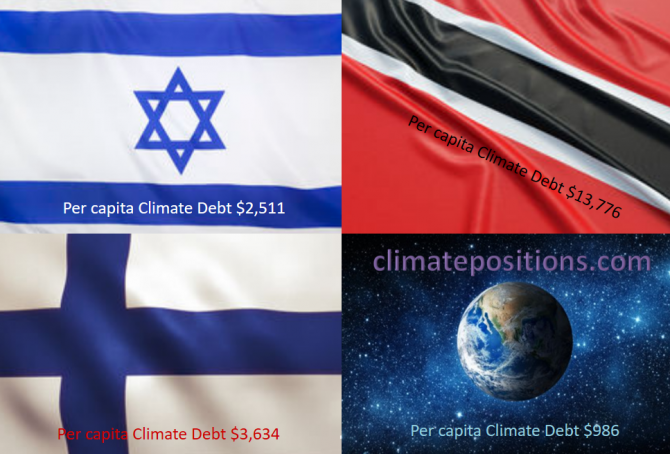
Share of global Climate Debt rank 34th, 35th and 36th: Israel, Finland and Trinidad and Tobago (combined responsible for 0.83% of Climate Debt and 0.42% of Fossil CO2 Emissions 2016)
2017
The diagram below shows ‘Share of global Climate Debt‘ in 2010, 2015 and 2017 of Israel, Finland and Trinidad and Tobago (ranked 34th, 35th and 36th). The shares of Israel and Finland have decreased continuously, whereas the one of Trinidad and Tobago is nearly stable.
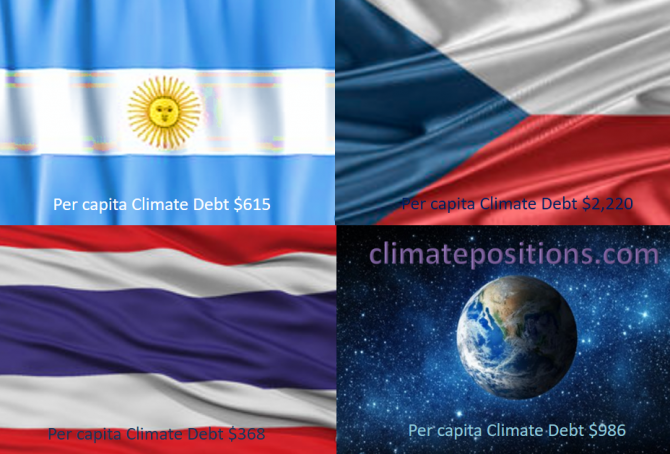
Share of global Climate Debt rank 31st, 32nd and 33rd: Argentina, Thailand and Czech Republic (combined responsible for 1.0% of Climate Debt and 1.6% of Fossil CO2 Emissions 2016)
2017
The diagram below shows ‘Share of global Climate Debt‘ in 2010, 2015 and 2017 of Argentina, Thailand and Czech Republic (ranked 31st, 32nd and 33rd). The share of Argentina is increasing while the share of Thailand has flattened out.
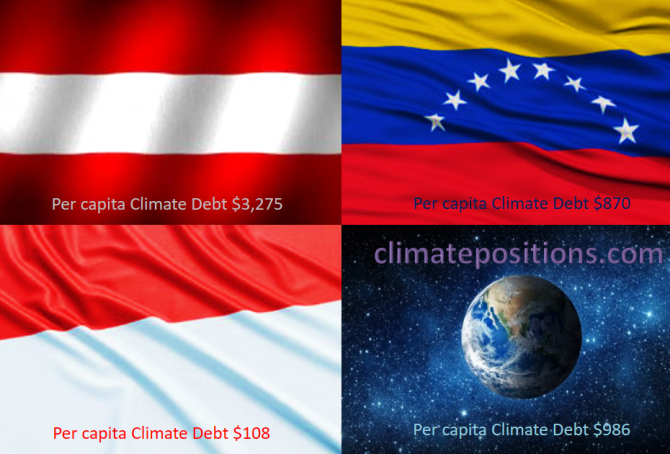
Share of global Climate Debt rank 28th, 29th and 30th: Austria, Indonesia and Venezuela (combined responsible for 1.2% of Climate Debt and 2.2% of Fossil CO2 Emissions 2016)
2017
The diagram below shows ‘Share of global Climate Debt‘ in 2010, 2015 and 2017 of Austria, Indonesia and Venezuela (ranked 28th, 29th and 30th). In 2015, the shares of each of the three countries were 0.40 or 0.41% of global Climate Debt.
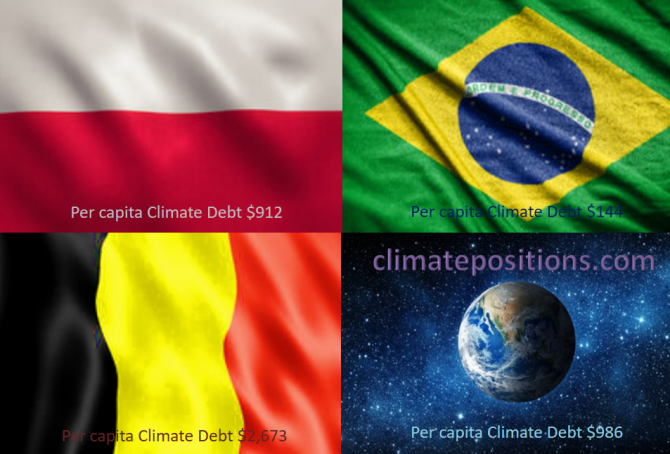
Share of global Climate Debt rank 25th, 26th and 27th: Poland, Belgium and Brazil (combined responsible for 1.3% of Climate Debt and 2.4% of Fossil CO2 Emissions 2016)
2017
The diagram below shows ‘Share of global Climate Debt‘ in 2010, 2015 and 2017 of Poland, Belgium and Brazil (ranked 25th, 26th and 27th). By 2015, the shares of the three countries were similar. Since then, the Polish performance has declined, relatively.
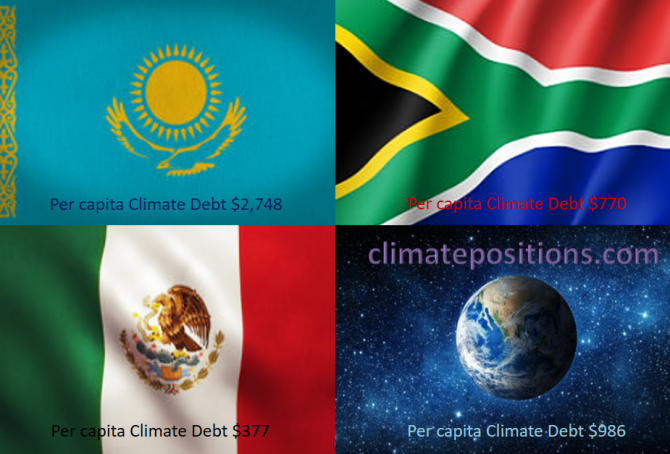
Share of global Climate Debt rank 22nd, 23rd and 24th: Kazakhstan, Mexico and South Africa (combined responsible for 1.9% of Climate Debt and 3.0% of Fossil CO2 Emissions 2016)
2017
The diagram below shows ‘Share of global Climate Debt‘ in 2010, 2015 and 2017 of Kazakhstan, Mexico and South Africa (ranked 22nd, 23rd and 24th). Kazakhstan’s share increased dramatically in a short period of time due to growing Fossil CO2 Emissions.
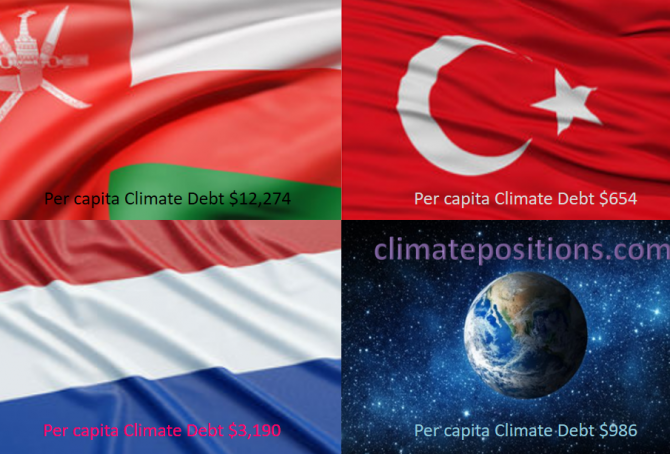
Share of global Climate Debt rank 19th, 20th and 21st: Oman, Netherlands and Turkey (combined responsible for 2.2% of Climate Debt and 1.7% of Fossil CO2 Emissions 2016)
2017
The diagram below shows ‘Share of global Climate Debt‘ in 2010, 2015 and 2017 of Oman, Netherlands and Turkey (ranked 19th, 20th and 21st). The share Netherlands is decreasing steadily, whereas Turkey’s is increasing.
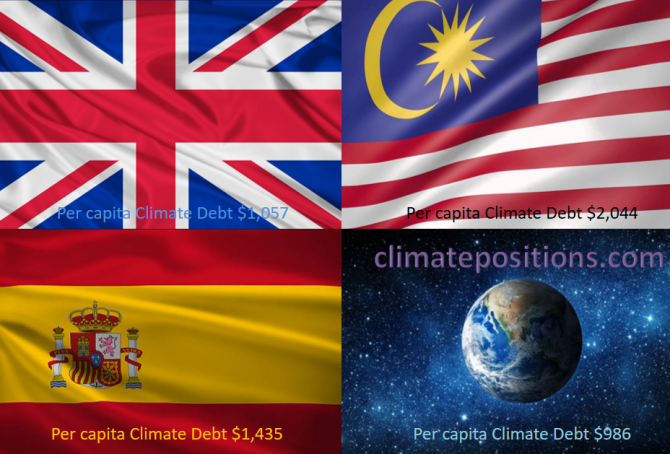
Share of global Climate Debt rank 16th, 17th and 18th: The United Kingdom, Spain and Malaysia (combined responsible for 2.8% of Climate Debt and 2.5% of Fossil CO2 Emissions 2016)
2017
The diagram below shows ‘Share of global Climate Debt‘ in 2010, 2015 and 2017 of the United Kingdom, Spain and Malaysia (ranked 16th, 17th and 18th). The shares of the United Kingdom and Spain are decreasing, while the Malaysian share is increasing.
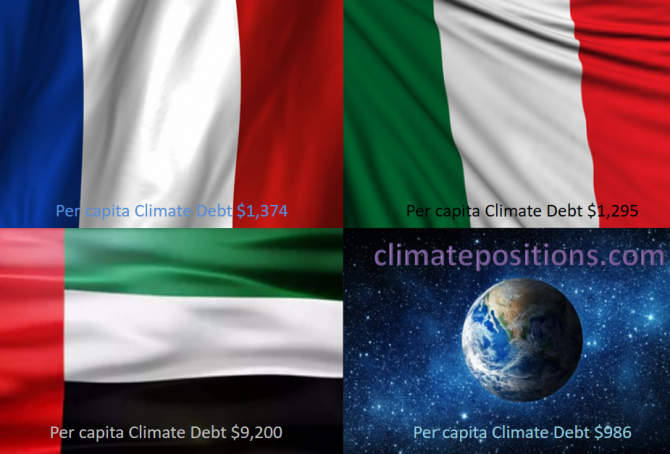
Share of global Climate Debt rank 13th, 14th and 15th: France, United Arab Emirates and Italy (combined responsible for 3.5% of Climate Debt and 2.5% of Fossil CO2 Emissions 2016)
2017
The diagram below shows ‘Share of global Climate Debt‘ in 2010, 2015 and 2017 of France, United Arab Emirates and Italy (ranked 13th, 14th and 15th). The share of United Arab Emirates has increased along with an extreme population growth.
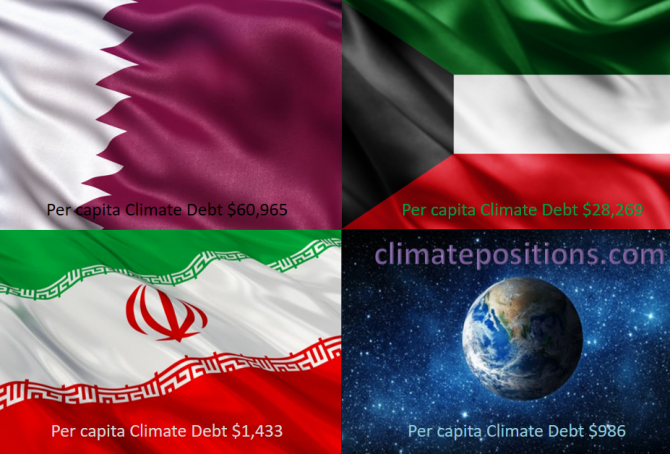
Share of global Climate Debt rank 10th, 11th and 12th: Qatar, Iran and Kuwait (combined responsible for 5.4% of Climate Debt and 2.4% of Fossil CO2 Emissions 2016)
2017
The diagram below shows ‘Share of global Climate Debt‘ in 2010, 2015 and 2017 of Qatar, Iran and Kuwait (ranked 10th, 11th and 12th). The share of Qatar has increased fast along with the extreme population growth. All three countries seem to have peaked on global shares around 2015.
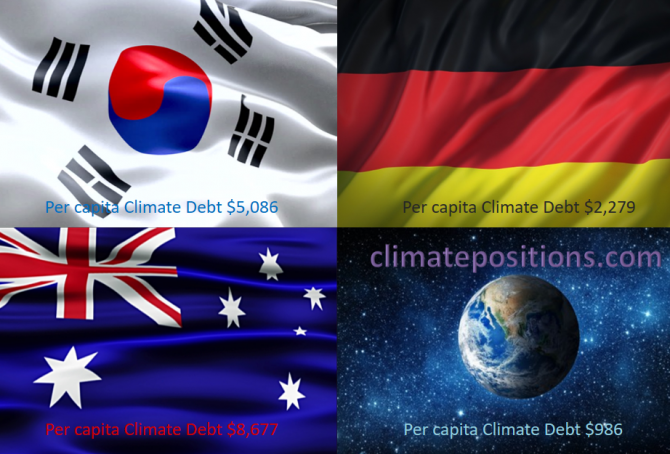
Share of global Climate Debt rank 7th, 8th and 9th: South Korea, Australia and Germany (combined responsible for 9% of Climate Debt and 5% of Fossil CO2 Emissions 2016)
2017
The diagram below shows ‘Share of global Climate Debt‘ in 2010, 2015 and 2017 of South Korea, Australia and Germany (ranked 7th, 8th and 9th). The South Korean share is stable over time, Australia’s is decreasing although at a slower rate lately, while Germany’s is increasing.
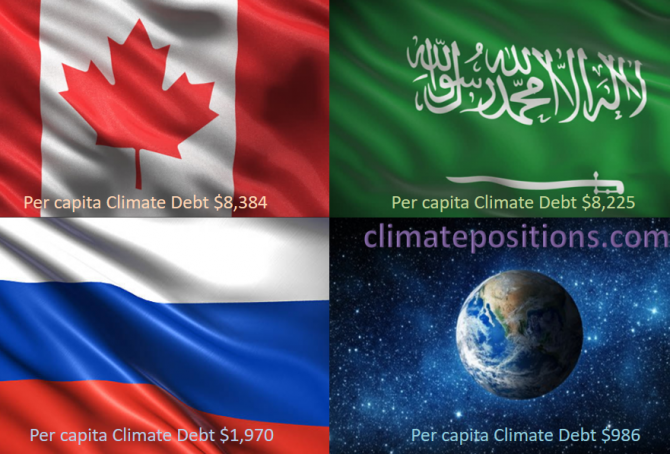
Share of global Climate Debt rank 4th, 5th and 6th: Canada, Russia and Saudi Arabia (combined responsible for 12% of Climate Debt and 8% of Fossil CO2 Emissions 2016)
2017
The diagram below shows ‘Share of global Climate Debt‘ in 2010, 2015 and 2017 of Canada, Russia and Saudi Arabia (ranked 4th, 5th and 6th). Canada’s share is decreasing, while Russia’s and Saudi Arabia’s are increasing. Global Climate Debt accumulated since 2000 is $7.2 Trillion.
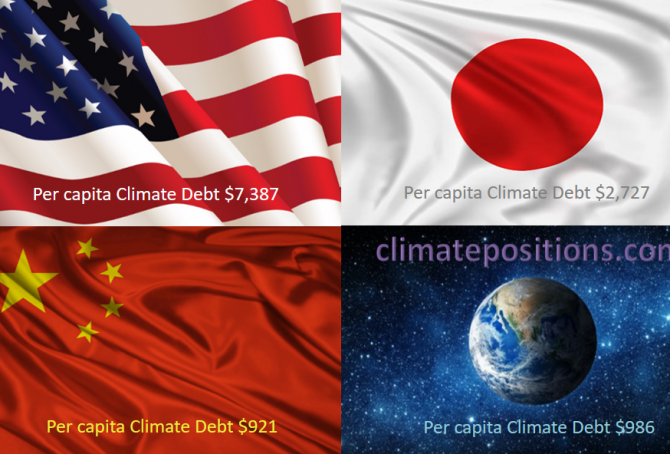
Share of global Climate Debt rank 1st, 2nd and 3rd: The United States, China and Japan (combined responsible for 55% of Climate Debt and 47% of Fossil CO2 Emissions 2016)
2017
The diagram below shows ‘Share of global Climate Debt‘ in 2010, 2015 and 2017 of the United States, Japan and China (ranked 1st, 2nd and 3rd). The shares of the United States and Japan are decreasing at slower rates lately, whereas China’s is increasing fast. Global Climate Debt accumulated since 2000 is $7.2 Trillion.
ClimatePositions has been updated with Fossil CO2 Emissions data from EDGAR
2017
As announced in the previous ‘Article‘ the calculations of Climate Debt by country in ClimatePositions has now been updated with CO2 Emissions data from ‘EDGAR‘ (European Commission), instead of data from Global Carbon Project (CDIAC).
At the same time, the global CO2 target has been raised by 0.2 tons per capita by 2025, and the indicators of Ecological Footprint (without carbon) and GDP (ppp-$) 2016 have been updated as well. New updated rankings are available in the menu “Climate Debt” above. Updated data and diagrams with all ‘Indicators‘ and all countries are available in the submenu ‘Calculations (Excel)‘.
The table below shows the new ranking of 163 countries in comparison with the previous (last) ranking (159 countries) with emission data from Global Carbon Project (CDIAC). No Climate Debt is marked “free”. Only Montenegro is excluded from the new ranking due to missing CO2 Emission data (ranks 69th in the previous ranking).
Indicator updates: GDP-ppp 2016 and Climate Change Financing (now only Multilateral Funds)
2017
2016-updates of national per capita GDP(ppp-$) from ‘World Bank‘ is now available in ‘Calculation (Excel)‘. The world’s average per capita GDP(ppp-$) grew from $15,668 in 2015 to 16,136 in 2016 (3.0% growth). The diagram below shows the development in per capita GDP(ppp-$) 2000-2016 of the world’s five largest per capita emitters of CO2 from Fossil Fuel and cement: Qatar, Trinidad and Tobago, Kuwait, Bahrain and Brunei; in comparison with the world average.
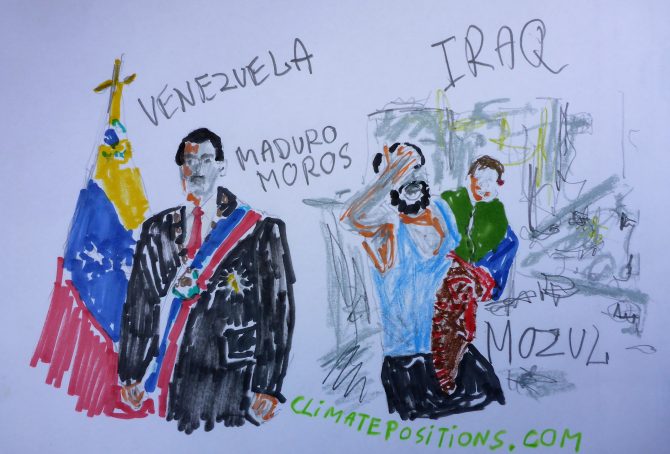
Climate change performance: Venezuela vs. Iraq (world’s proven reserves of oil and natural gas)
2017
Venezuela holds the world’s largest proven oil reserves and the 8th largest proven natural gas reserves, while Iraq ranks 5th on oil and 12th on gas. Together, the two countries hold nearly 27% of the world’s proven reserves of oil and 5% of its natural gas.
The two tables below rank the 15 countries with the largest proven oil and natural gas reserves and their world shares. Combined, the 19 Fossil Fuel countries listed below hold 93% of the world’s proven oil reserves and 88% of the proven natural gas reserves. They represent 38% of the global population, 62% of the global CO2 Emissions from Fossil Fuels (2015) and 74% of the current global Climate Debt in ClimatePositions (the combined share of the global Climate Debt of the 15 countries has increased by 3.6% since 2012; see the ‘Ranking‘.

Climate Change Performance: Vietnam vs. United Arab Emirates (UAE)
2017
The difference in climate change performance of Vietnam and United Arab Emirates (UAE) is somewhat educational. Vietnam’s Climate Debt is $14 per capita, while the authoritarian oil state of UAEs is $10,884 (see the latest ‘Ranking‘). The two countries are the world’s 27th and 28th largest emitters of CO2 from Fossil Fuels (without bunker) and cement – combined, they emitted 0.52 % of the global CO2 in 2015. The following examines the ‘Indicators‘ of CO2 Emissions, Population, GDP(ppp-$) and Forest Cover (including Primary Forest).
First, the diagram below shows the national shares of the global Climate Debt, in 2017 and 2012. Both countries increased their shares in recent years, although at completely different levels and in unalike ways.