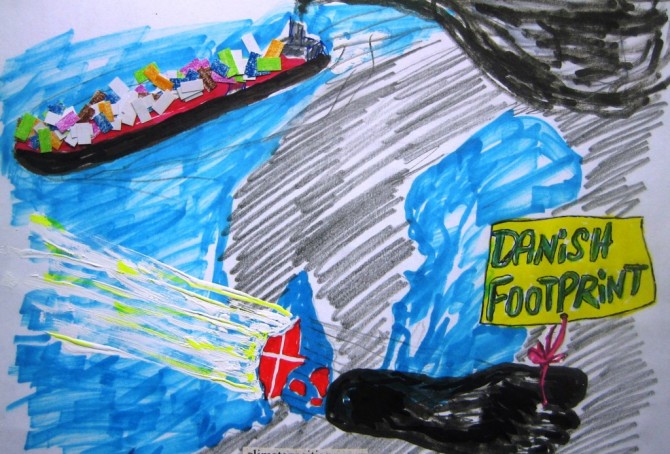
Slowdown of Denmark’s accumulating Climate Debt, but..!
2015
Denmark’s updated Climate Debt is $806 per capita. In the latest ‘ranking’ the Scandinavian country is 41st out of 147 countries (where no. 1 is worst) and is often referred to as a green transition pioneer. However, according to various rankings and surveys the picture is somewhat more complicated:
- Denmark’s per capita ‘Ecological Footprint’ – without carbon emissions – is the largest among 152 countries.
- Denmark is ranked 1st among 29 countries (those with data) on organic (ecological) share of all domestic sales¹.
- In the ‘Climate Change Performance Index’ (from Germanwatch and Climate Action Network Europe) Denmark performs best of 58 countries.
- CO2 Emissions would be around 46% higher than the usual statistics show, if emissions from Danish-controlled overseas ships, sailing goods around the world, were included² (in 2011 the Danish per capita CO2 Emissions would be around 15.0 tons instead of 8.2 tons).
- In addition, Denmark’s CO2 Emissions would be around 18% higher (in 1996-2009), than the usual statistics show, if emissions were consumption-based³ (inclusive CO2 Emissions from the production of imported goods) instead of production-based (inclusive CO2 Emissions from domestic production of goods for export).
However, the following examines only the indicators of CO2 Emissions from fossil fuels (production-based and without emissions from overseas ships), GDP(ppp-$) and Ecological Footprint without carbon emissions.

Top five in Climate Debt: Qatar, Kuwait, Singapore, United Arab Emirates and Trinidad and Tobago
2015
The updated Climate Debt per capita accumulated since 2000 of the five worst performing countries are:
- Qatar $35,565
- Kuwait $31,828
- Singapore $24,828
- United Arab Emirates $18,386
- Trinidad and Tobago $14,131
See the ‘ranking’ of 147 countries. The total population of the five small countries is 0.24% of the global population but the total Climate Debt is overwhelmingly 7.44% of the global Climate Debt (in 2012). The following analyses the indicators of GDP(ppp-$) and CO2 Emissions from fossil fuels (read about the issues of marine bunkers e.g. in Singapore at the bottom).
Climate change performance of Spain, France and Italy
2015
2.5% of the global population live in Spain, France or Italy and together they emitted 3.3% of the global CO2 from fossil fuels in 2012 – the combined share of the global Climate Debt is 4.3%. Spain’s updated Climate Debt per capita is $1,692 (ranked 25th), France’s is $1,352 (ranked 31st) and Italy’s is $1,034 (ranked 35th). See the ‘ranking’. The following examines the Climate Debt trends and the indicators of CO2 Emissions (carbon dioxide from fossil fuels), GDP(ppp-$), Forests, Marine Protection and Nuclear Power.
Climate change performance: Australia vs. New Zealand
2015
The two diagrams below show Australia’s and New Zealand’s CO2 Emissions from fossil fuels per capita in decades. The green bars show the Contribution Free Level and the grey bars are the world average. The average Australian per capita emissions were 16.7 tons in 1990s and 19.7 tons in 2000-2012 (18% increase). The corresponding figures of New Zealand were 8.7 tons and 9.5 tons (10% increase).
Climate change performance of Malaysia, Thailand, Indonesia and the Philippines
2015
6.4% of the world population lives in Malaysia, Thailand, Indonesia or the Philippines – they emitted 3.2% of the global carbon dioxide from fossil fuels in 2012. The four diagrams below show the emissions per capita 2000-2013 (preliminary estimates of 2013) of the four populous countries of which only the Philippines is Contribution Free (no climate debt) in ClimatePositions. The green bars are the Contribution Free Level of CO2 Emissions calculated from emissions in 1990s and a number of continuously updated ‘indicators’.
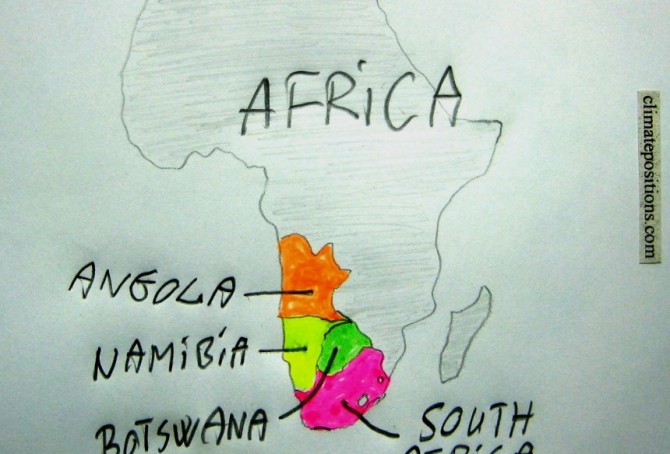
Climate change performance of South Africa, Botswana, Angola and Namibia
2015
36 out of 44 African countries in ClimatePositions are Contribution Free and the total climate debt of the African continent is 1.1% of the global climate debt – the share of the global population and CO2 Emissions from fossil fuels is respectively around 13.8% and 3.7%. The eight countries ranked below stand out in Africa by having a climate debt. This article analyses the performance of South Africa, Botswana, Angola and Namibia.

65 Contribution Free countries…GDP-ranked (with Income Equality, Life Expectancy and Environmental Performance)
2014
65 out of 147 countries with full data in ClimatePositions are Contribution Free (no climate debt). 41% of the world’s population lives in these Contribution Free countries and they emitted only 9% of the global carbon dioxide from fossil fuels in 2012 – without India the corresponding figures are 24% of the global population and 3% of the emissions.
The table below shows the 65 Contribution Free countries ranked by GDP(ppp-$) per capita, with Income Equality (‘Atkinson Index‘), Life Expectancy and Environmental Performance. The world’s average GDP(ppp-$) per capita was $13.791 in 2012. Analysis and comments see below the table – the color codes are explained in the bottom.
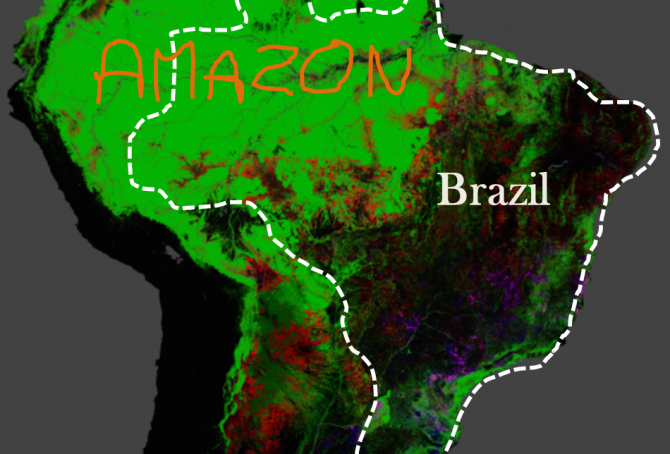
Brazil’s rainforests and climate change performance
2014
The Google map of the Amazon is from the new interactive ‘Global Forest Change‘ developed by The University of Maryland (read ‘more’). The red is Forest Loss from 2000 to 2012, the blue is Forest Gain and the green is Forest Extent (unchanged). The purple is areas of mixed Forest Loss and Forest Gain. According to Brazil’s environment minister the lowest recorded deforestation of Brazil since 1988, was in 2012. Furthermore, up to a third of the cleared rainforest over the past decades may be on the way back (regrowth).
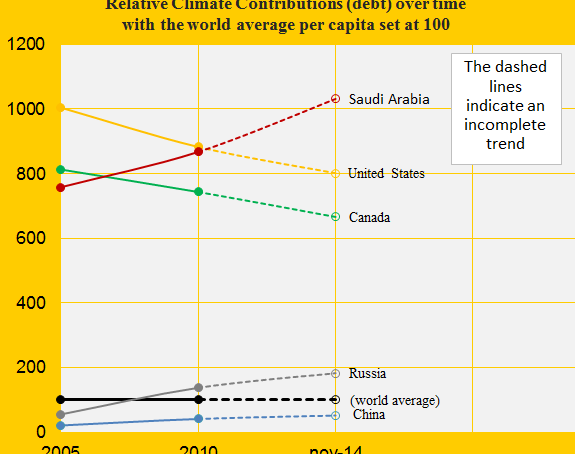
Climate change performance of Saudi Arabia and Canada
2014
The first diagram shows the relative Climate Contribution (debt) per capita of Saudi Arabia, Canada, China, the United States and Russia, with the world’s average set at 100. Around 2007 Saudi Arabia passed Canada and since then, the gap has grown considerably. Today, the climate debt per capita accumulated since 2000 are respectively $7,936 and $5,128 (see the ‘ranking’).
The Climate Contributions are calculated by using eleven ‘indicators’ of which national CO2 Emissions from the burning of fossil fuels is the principal. Extraction and export of fossil fuels is not one of the indicators which Saudi Arabia should be thankful for – wealth measured as ‘GDP(ppp-$)‘, however, is an indicator.
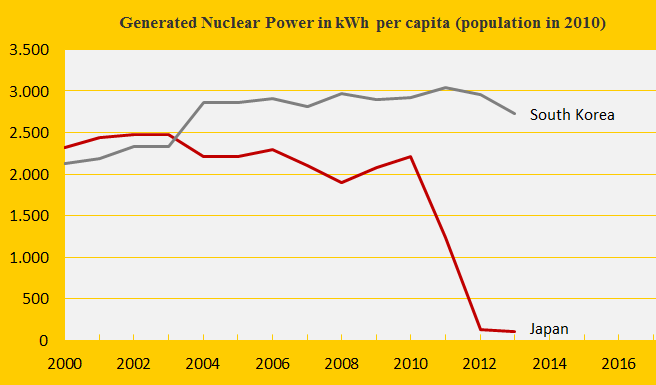
Climate change performance: Japan vs. South Korea
2014
The first diagram shows the nuclear power generation per capita of the two countries. The Fukushima nuclear disaster in Japan in 2011 has caused a remarkable shutdown of generation – while CO2 Emissions from the burning of petroleum, coal and natural gas have increased (from 2011 to 2012 respectively by 6%, 5% and 3%) to close the energy gap. Nuclear power generation produce dangerous radioactive waste to deal with for thousands of future generations (10,000 to 250,000 years) and in ClimatePositions nuclear power is not accepted as a national CO2 Emission reduction instrument (read ‘more’). The following analyzes the indicator trends of Japan and South Korea.
Climate change performance of Russia (compared to other BRICS countries)
2014
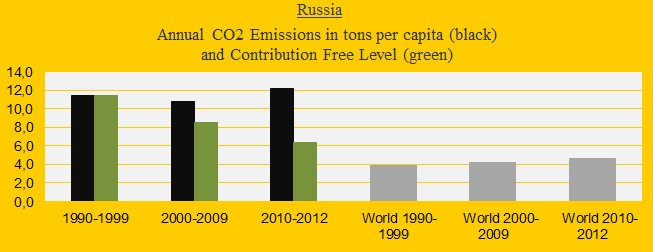
Russia was the 4th largest carbon dioxide emitter in 2012 with 5.6% of the global emissions, after China (26.9%), the United States (16.6%) and India (5.8%). The first diagram shows Russia’s CO2 Emissions per capita in decades in comparison with the world average (the green bars are the Contribution Free Level). After the COP summit in 2009 (at which China and the United States rejected a globally binding reduction agreement) the Russian emissions have increased dramatically and today the Russian Climate Contribution (climate debt) is $1,410 per capita (ranked 28th), compared to $627 in 2010 (ranked 32nd). See the ‘ranking’. The following analyzes the development in Putin’s Russia since 2000 in comparison with the other ‘BRICS‘ countries China, India, Brazil and South Africa – jointly emitting 41% of global carbon dioxide in 2012.
CO2 Emissions 2013: India is still Contribution Free (but how long?)
2014
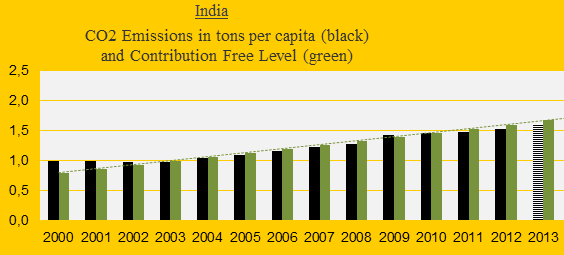
India was the 3rd largest emitter of carbon dioxide in 2013 (preliminary estimate), but the per capita emissions were only about one-third of the world average. The first diagram shows India’s CO2 Emissions per capita 2000-2013 (2013-emissions are preliminary estimates). The green bars are the Contribution Free Level in ClimatePositions. As long as emissions remain below the free level, on average, the climate debt is zero dollars. However, India balances close to the limit.
Climate change performance of the United States 2000-2013 (and the new emission target)
2014
Last week the United States ‘agreed’ with China to reduce US greenhouse gas emissions between 26% and 28% from the 2005-level by 2025. The agreement is legally non-binding and without the support of the Republicans. The following analyze the new US emission target (in the bottom) and the general performance in comparison with the spying buddies in Five Eyes Alliance¹: Canada, Australia, New Zealand and United Kingdom.
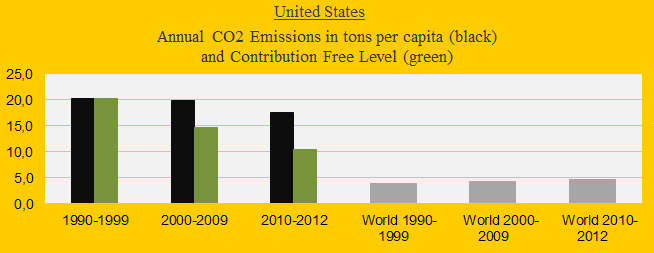
The United States is presently ranked 10th out of 147 countries in Climate Contribution (climate debt) per capita. See the ‘ranking’. The US ‘share of the global Climate Contributions’ is now 37.0%, compared to 40.7% in 2010. The first diagram shows the CO2 Emissions per capita in decades in comparison with the world average. The green bars are the Contribution Free Level, determined by the level of CO2 Emissions in the 1990s and the eleven ‘indicators’. The declining US share of the global climate debt is mainly due to reduced CO2 Emissions while the global emissions have increased.
China’s growing climate debt and carbon dioxide emissions is catastrophic
2014
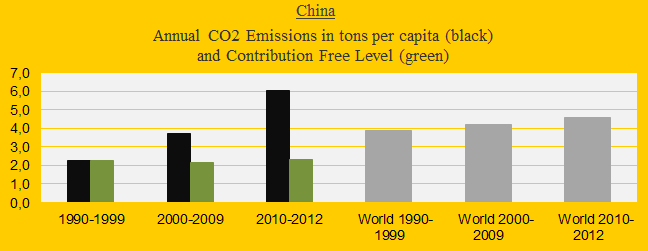
Today, China ‘agreed‘ with the United States (without the Republicans!?) that the Chinese CO2 Emissions can increase by 2030, after which emissions shall decrease. The agreement is legally non-binding and can almost be seen as a confirmation of the ‘worst case climate scenario‘. The first diagram shows the CO2 Emissions of China (the black bars) in decades in comparison with the world average (the grey bars). The green bars show the Chinese Contribution Free Levels in ClimatePositions. Today the Climate Contribution (climate debt) is $402 per capita and the ranking is 52nd out of 147 countries (see the ‘ranking’). The updated Chinese Climate Contribution is 10.3% of the global contribution, second only to the United States (see the ‘ranking’).
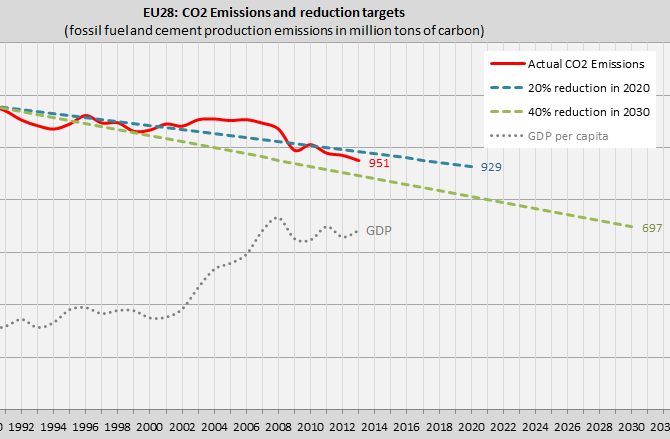
New greenhouse gas targets of the European Union: 40% reductions in 40 years
2014
The 28 countries in the European Union (EU) have recently decided three new greenhouse gas reduction targets of the EU by 2030 in comparison with 1990 levels:
- Binding reduction of greenhouse gas emissions by 40%.
- Binding increase of the share of renewable energy to 27% of the energy consumption.
- Indicative (optional) increase of energy efficiency by 27%.
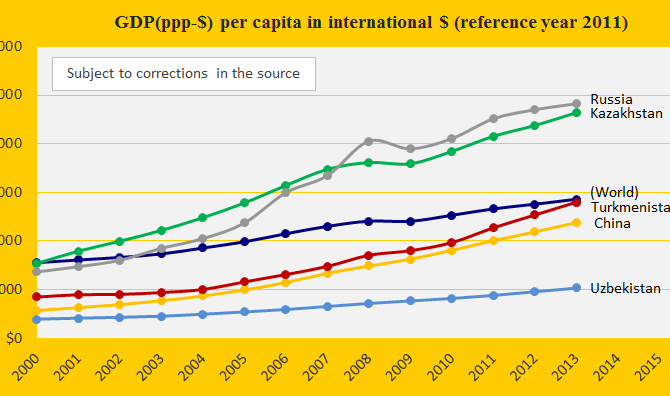
Climate change performance of Turkmenistan, Kazakhstan and Uzbekistan
2014
The three authoritarian regimes Turkmenistan, Kazakhstan and Uzbekistan were ranked respectively 31st, 40th and 71st on the worst performing list in ClimatePositions 2010. Their updated Climate Contributions (climate debt) are $1,043, $797 and $60 per capita. See the ranking ‘here’. The first diagram shows the GDP(ppp-$) per capita of the three neighboring countries located in the region Eurasia where the Middle East, Asia and Europe meet, in comparison with China, Russia and the world average.
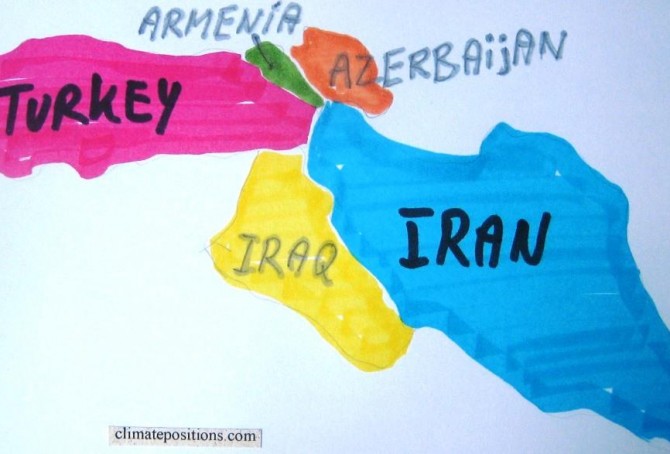
Climate change performance: Iran versus Turkey
2014
The CO2 Emissions of the authoritarian Islamic regime Iran have doubled from 4.0 tons per capita in the 1990s to 8.0 tons in 2011, while the Turkish emissions have increased from 2.5 tons in the 1990s to 3.8 tons in 2011. See the emissions since 2000 in the two diagrams below.

The Philippines beats Malaysia in climate change performance (what about the rainforests?)
2014
The Philippines is Contribution Free in ClimatePositions while Malaysia was the 36th worst performing country out of 145 in 2010. In 2014, the Malaysian Climate Contribution (climate debt) increased to $997 per capita and the present ranking is 31st (see ‘here’). The first diagram (below) illustrates the typical correlation between rapid economic growth and loss of sustainability that increases climate debt. The Malaysian climate debt, computed as a percentage of GDP(ppp-$) annually since 2000 increased from 0.38% in 2010 to 0.41% in 2014 (see the ranking ‘here’). This clearly demonstrates the lack of sustainable growth. The following examines the indicators of CO2 Emissions, Ecological Footprint, Forest Area and Marine Protection of the Philippines and Malaysia.

Climate change performance of Saudi Arabia and Yemen
2014
Saudi Arabia was the 12th worst performing country in ClimatePositions 2010 (see the ‘ranking’). In 2014 the total Climate Contribution (climate debt) of the rich authoritarian Islamic oil regime rose to $148 billion or 1.06% of the national GDP(ppp-$) annually since 2000 (ranked number 7; see ‘here’). The neighboring Yemen, the poor authoritarian Islamic regime is Contribution Free. The first diagram shows the development of GDP(ppp-$) of Saudi Arabia, Yemen, Oman, United Arab Emirates, Qatar and the world average. The following examines the indicators: CO2 Emissions, Ecological Footprint and Environmental Performance of Saudi Arabia and Yemen.

Update of GDP(ppp-$) 2013
2014
The Climate Contributions (climate debt) in ClimatePositions increases with growing GDP(ppp-$)¹. The 2013 updates and adjustments back in time have now been released (see the ‘World Bank’). For some countries, this means large growth of GDP(ppp-$) since 2000 and thus large increases in Climate Contributions. In other words, the previous data tended to be too modest with respect to the wealth of many countries, in particular Iraq, Jordan, Indonesia, Kazakhstan and Egypt, and the rich authoritarian oil regimes Kuwait, Oman, Saudi Arabia and Qatar. The updated Climate Contributions per capita worldwide are available ‘here’ and in the spreadsheet in the menu ‘Calculations‘. See the Climate Contributions as a percentage of the annual GDP(ppp-$) ‘here‘.