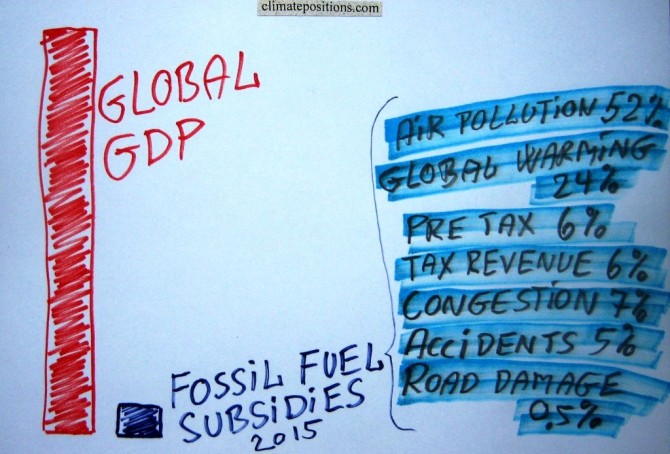
Fossil fuel subsidies: $5.3 trillion in 2015 (IMF survey)
2015
Estimates from the ‘International Monetary Fund’ (IMF) show that fossil fuel subsidies of 155 countries representing 98% of the world’s population, amounted $4.2 trillion (5.8% of global GDP) in 2011 and $4.9 trillion (6.5% of global GDP) in 2013. Projections for 2015 suggest $5.3 trillion (6.5% of global GDP). This huge amount of subsidies is of cause plain stupid.
For comparison, the total ‘Climate Debt of 147 countries‘ in ClimatePositions, accumulated between 2000 and 2013, amounted $5.2 trillion. Roughly speaking, one year of global subsidies equals the total accumulated Climate Debt. Note that global climate change funding is only around $0.14 trillion.
Giving up on future generations is real (about COP Submissions 2015)
2015
COP Submissions with intended national emission targets of 44 countries¹, responsible for 70% of the global CO2 Emissions from fossil fuels, are now available for study. Among the seven largest emitters only India’s submission is still missing. China, the world’s largest emitter, intends to reach its maximum emissions by 2030 (maybe earlier) and then reduce … which leaves global scenarios open to assumptions. The calculations in this article are based on 10% and 30% increase of the Chinese emissions by 2030, compared to 2013.
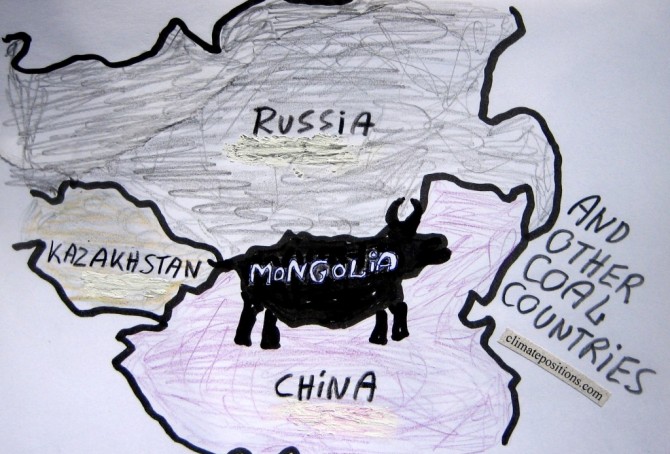
Mongolia and other coal producing countries (the thirteen most coal-dependent countries)
2015
Mongolia is the world’s second largest coal producer per capita (Btu, 2011) and coal is the world’s no. 1 carbon dioxide emitter. However, the flawed democracy (surrounded by the giant authoritarian regimes of China and Russia) is Contribution Free (no Climate Debt) in ClimatePositions – how is this possible?
The table below ranks the thirteen largest per capita coal producers (Btu, 2011), with the world average set at 1.0. The Mongolian coal production is almost ten times larger than the world average. For comparison, the table shows per capita values of CO2 Emissions (from fossil fuels), GDP(ppp-$) and Climate Debt. More comments below the table.
Climate change performance of Saudi Arabia and Canada
2014
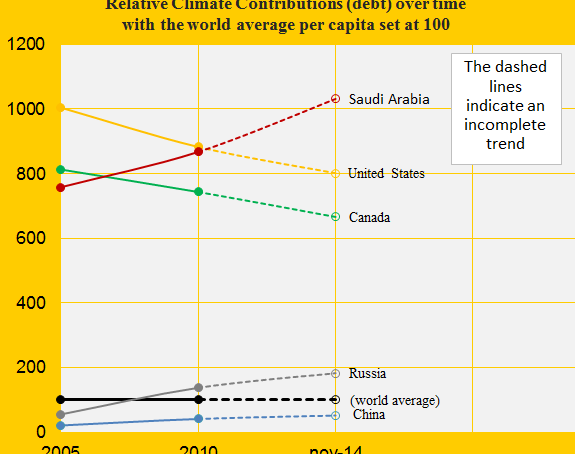
The first diagram shows the relative Climate Contribution (debt) per capita of Saudi Arabia, Canada, China, the United States and Russia, with the world’s average set at 100. Around 2007 Saudi Arabia passed Canada and since then, the gap has grown considerably. Today, the climate debt per capita accumulated since 2000 are respectively $7,936 and $5,128 (see the ‘ranking’).
The Climate Contributions are calculated by using eleven ‘indicators’ of which national CO2 Emissions from the burning of fossil fuels is the principal. Extraction and export of fossil fuels is not one of the indicators which Saudi Arabia should be thankful for – wealth measured as ‘GDP(ppp-$)‘, however, is an indicator.
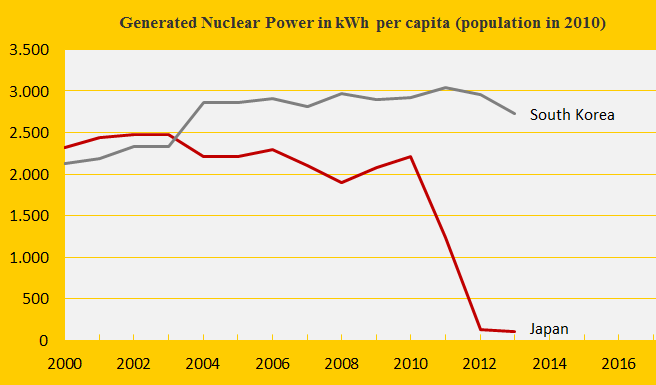
Climate change performance: Japan vs. South Korea
2014
The first diagram shows the nuclear power generation per capita of the two countries. The Fukushima nuclear disaster in Japan in 2011 has caused a remarkable shutdown of generation – while CO2 Emissions from the burning of petroleum, coal and natural gas have increased (from 2011 to 2012 respectively by 6%, 5% and 3%) to close the energy gap. Nuclear power generation produce dangerous radioactive waste to deal with for thousands of future generations (10,000 to 250,000 years) and in ClimatePositions nuclear power is not accepted as a national CO2 Emission reduction instrument (read ‘more’). The following analyzes the indicator trends of Japan and South Korea.
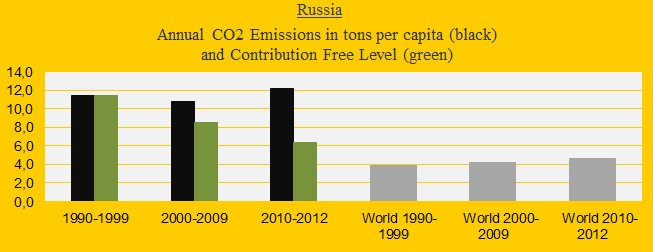
Climate change performance of Russia (compared to other BRICS countries)
2014
Russia was the 4th largest carbon dioxide emitter in 2012 with 5.6% of the global emissions, after China (26.9%), the United States (16.6%) and India (5.8%). The first diagram shows Russia’s CO2 Emissions per capita in decades in comparison with the world average (the green bars are the Contribution Free Level). After the COP summit in 2009 (at which China and the United States rejected a globally binding reduction agreement) the Russian emissions have increased dramatically and today the Russian Climate Contribution (climate debt) is $1,410 per capita (ranked 28th), compared to $627 in 2010 (ranked 32nd). See the ‘ranking’. The following analyzes the development in Putin’s Russia since 2000 in comparison with the other ‘BRICS‘ countries China, India, Brazil and South Africa – jointly emitting 41% of global carbon dioxide in 2012.
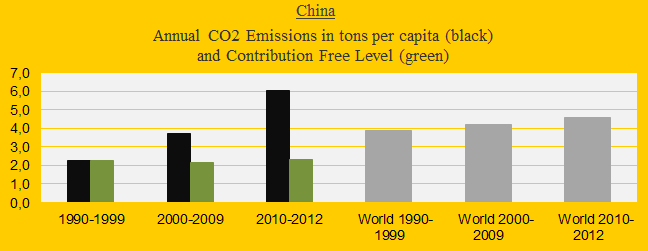
China’s growing climate debt and carbon dioxide emissions is catastrophic
2014
Today, China ‘agreed‘ with the United States (without the Republicans!?) that the Chinese CO2 Emissions can increase by 2030, after which emissions shall decrease. The agreement is legally non-binding and can almost be seen as a confirmation of the ‘worst case climate scenario‘. The first diagram shows the CO2 Emissions of China (the black bars) in decades in comparison with the world average (the grey bars). The green bars show the Chinese Contribution Free Levels in ClimatePositions. Today the Climate Contribution (climate debt) is $402 per capita and the ranking is 52nd out of 147 countries (see the ‘ranking’). The updated Chinese Climate Contribution is 10.3% of the global contribution, second only to the United States (see the ‘ranking’).
New ranking 2014 – update of 147 countries’ climate debt
2014
The data in ClimatePositions are updated consecutively and since the data year 2010 the eleven ‘indicators’ have all been updated.
The new rankings of 147 countries are now available in the menu “Contributions” (with six categories).
All country data and diagrams are available in the menu ‘Calculations (Excel)’. In the coming months selected countries will be analyzed in articles. The following illustrates the latest updates in two ways: 1) The change of climate debt as a percentage of the global climate debt of the twelve largest CO2 emitters, and 2) The key-figures of the United Kingdom.
Carbon dioxide emissions 2013 – China, the United States, India and Russia
2014
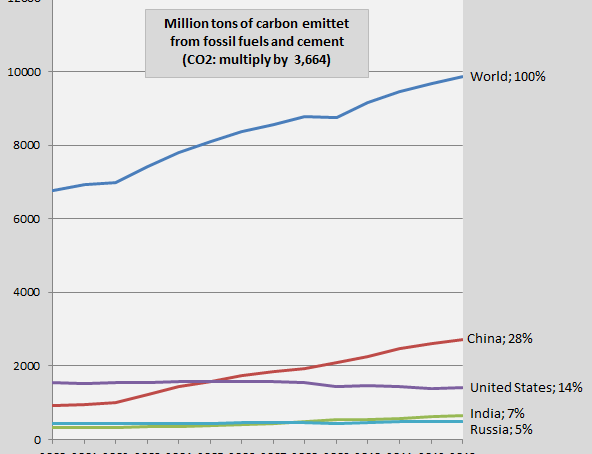
The diagram shows the global development of carbon dioxide emissions from fossil fuels and cement 2000-2013 (measured by pure carbon) and of the four largest emitters China, the United States, India and Russia. The 2013-emissions are preliminary with an enlarged uncertainty of ±5%. The national shares of the global emissions in 2013 are shown in percent to the right. The four countries accounted for 54% of the global emissions in 2013 (48% in 2000). The preliminary carbon dioxide emissions in 2013 of 216 countries is available ‘here’¹. Global emissions are on track of the worst out of four scenarios, likely heading for 3.2-5.4°C increase in temperature by 2100, since pre-industrial era (see the diagram below from ‘Global Carbon Project’, and ‘presentation (pdf)‘.

Forest Cover, Primary Forests and climate debt
2014
The national data of Forest Cover and Primary Forest are both included in the calculations of Climate Contributions (debt) in ClimatePositions. Primary Forest was included as an indicator in the worksheet in August 2014. The following describes selected findings on forests from FAO’s ‘The Global Forest Resources Assessments (FRA), 2010’ (main report, pdf, 378 pages). The Assessment is based on two primary sources of data: 1) ‘country reports’ and 2) remote sensing conducted by FAO and partners.

Update of GDP(ppp-$) 2013
2014
The Climate Contributions (climate debt) in ClimatePositions increases with growing GDP(ppp-$)¹. The 2013 updates and adjustments back in time have now been released (see the ‘World Bank’). For some countries, this means large growth of GDP(ppp-$) since 2000 and thus large increases in Climate Contributions. In other words, the previous data tended to be too modest with respect to the wealth of many countries, in particular Iraq, Jordan, Indonesia, Kazakhstan and Egypt, and the rich authoritarian oil regimes Kuwait, Oman, Saudi Arabia and Qatar. The updated Climate Contributions per capita worldwide are available ‘here’ and in the spreadsheet in the menu ‘Calculations‘. See the Climate Contributions as a percentage of the annual GDP(ppp-$) ‘here‘.
CO2 Emissions from flights
2014
Since the early 1990s the passenger-kilometers of flights worldwide has increased by 5-6% per year. The CO2 Emissions (carbon dioxide) per passenger kilometer vary due to difference in flight distances¹, aircrafts and load factors (percent of occupied seats) – with average load factors First Class and Business Class are causing nine- and three-times higher emissions per passenger than Economy Class, as one study suggests². Furthermore the mixed exhaust from flights causes 2-4 times more global warming than only CO2 emitted from engines on the ground³. The accumulated climate-effect from flights might be as high as 7-9% of the total effect from anthropogenic greenhouse gases4. However, the following examines only the CO2 Emissions from flights and the implied national costs in Climate Contributions (climate debt). But first see these three seductive animations (from ‘nats‘) with 24-hours flights over ‘Europe 1:59‘, ‘Middle East 1:11‘ and ‘North Atlantic 1:52‘.

Outsourcing of CO2 Emissions from the United States to China
2014
If the United States reduced the CO2 Emissions produced inside its borders and the dirty productions as a competitive consequence moved to China (or elsewhere), the positive impact on the climate would vanish. This obvious dilemma can only be solved if both countries sign a binding climate agreement with solid and fair CO2 Emission targets – which the two countries reject (read more on their COP positions ‘here’). The position of the United States is particularly perverted: 1) Reduction-targets of national CO2 Emissions must be voluntary and 2) Investments in climate actions must be profitable. The bizarre U.S. vision is to create a new global commercial market for voluntary climate investments, a commercial market with parallels to the United States, the homeland of the climate chaos.
2012 update of GDP in ClimatePositions
2014
The annual national GDP(ppp-$) (standard of living measured by purchasing power) has a direct impact on the Climate Contributions. Updating of GDP for 2011 and 2012 are now entered ClimatePositions (Excel) and for most countries, this means considerable increases in the Climate Contribution (climate debt). In connection with the GDP update, a minor simplification of the calculation method has been made (recent years are still weighted more than previous years in GDP+).
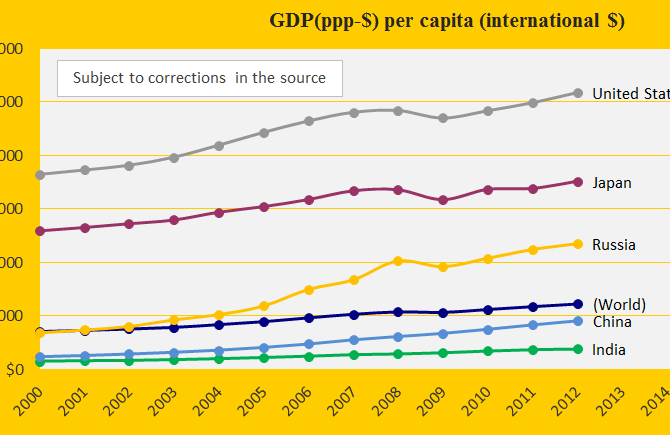
The diagram shows the updated (and revised) GDP(ppp-$) 2000-2012 for the five largest CO2 Emitters: China, United States, Russia, India and Japan.
COP19 negotiating positions: China, United States, India, Russia and Japan
2014
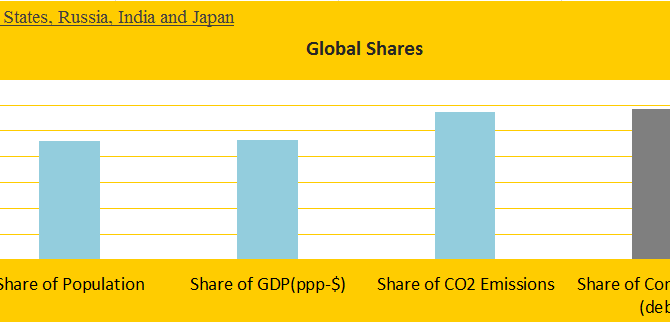
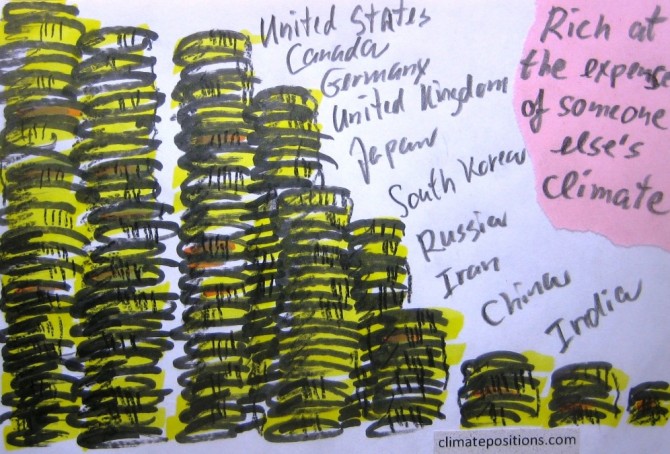
The world’s five largest CO2 emitters – China, United States, Russia, India and Japan – are responsible for 57% of global CO2 Emissions (2006-2010) and 58% of the Climate Contributions (climate debt) in ClimatePositions 2010 (see the front diagram). Add to the group the populous Contribution Free countries Pakistan, Bangladesh, Nigeria, Philippines and Ethiopia and the total share would almost reflect the world average of Population (56%), CO2 Emissions (59%) and Climate Contributions (58%). Leaders of these ten countries sitting around an imaginary negotiating table should be able to create a global climate agreement with binding CO2 reductions and full financing – but it will not happen!
The following depicts the submissions, basic statistics and negotiating positions at COP19 in Warsaw of the five largest CO2 emitters. See the five countries’ Contributions over time ‘here‘, the Contributions as a percentage of GDP ‘here‘ and read about the COP19 country groups ‘here‘.
Climate Contributions as a percentage of GDP for the top ten CO2 Emitters
2013
The top ten CO2 Emitters were responsible for 67% of the global CO2 Emissions in 2006-2010. Adjusting the national Contributions (climate debt) for the size of the GDP(ppp-$) is essential. Allowing the wealthy United States get away with paying the same dollar price of a ton of CO2 (carbon dioxide) exceeded as China is of course absurd. The countries’ climate change performances are measured indirectly as the Contributions’ percentage of the national GDP(ppp-$).

Australia perform worst of democratic countries
2013
Australia was the 6th worst performing country in the world in ClimatePositions 2010 with a Climate Contribution of $4,387 per capita. In the latest calculation it had increased to $5,081. The total national Contribution (climate debt) is now 109 billion US$. Since no country in top 5 is Full Democracies, Australia is the worst performing democratic country. It can be assumed that the majority of the Australian voters are pleased with this destructive approach to the planet.
India keeps the balance between growth and CO2 emissions
2013
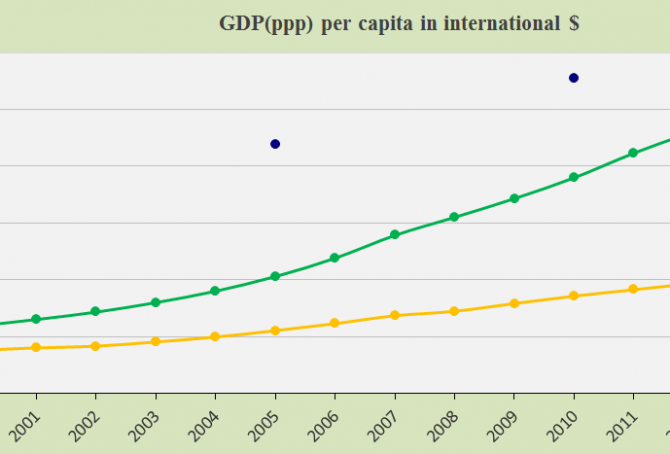
India is the 4th largest CO2 Emitter in the world (in 2006-2010) but Contribution Free due to a balanced increase in economic growth and CO2 Emissions per capita. The front diagram show India’s annual GDP(ppp-$) in comparison with China and the global average (the blue dots). Subject to modifications in the data source. Economic growths in these two countries are causing an increasing proportion of the global CO2 Emissions (28.3% in 2006-2010) and thus climate change.

Global warming: China in its own CO2 Emission league
2013
Global warming is caused mainly by human CO2 Emissions.The diagram above shows China’s annual CO2 Emissions (carbon dioxide) in tons per capita 2000-2011 (the black bars). The green bars show the Contribution Free Levels in ClimatePositions. The free level of CO2 Emissions is dependent on various indicators (see the menu “Calculations/Indicators”). China was the 57th worst performing country out of 145, in terms of Contribution (climate debt) per capita. The total national Contribution increased from 26 billion US$ in 2005 to 185 billion in 2010. This explosive negative development is outstanding in the world and China is now by far the largest CO2 Emitter.
Top 5 CO2 Emitters’ Climate Contributions (climate debt) over time
2013
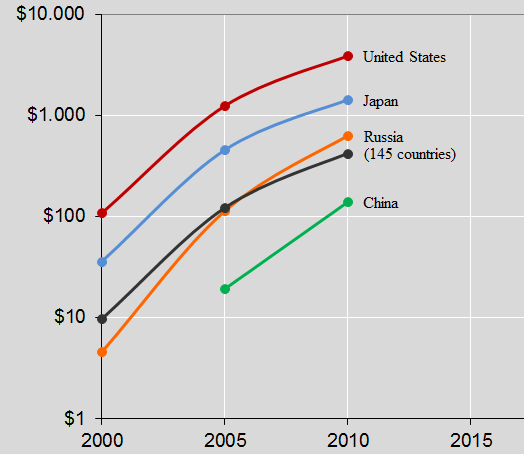
The 5 largest CO2 Emitters in 2006-2010 were 1. China (23,2%), 2. United States (19,7%), 3. Russia (5,3%), 4. India (5,1%) and 5. Japan (4,0%). These 5 countries accounted for 57,3% of the global CO2 Emissions (carbon dioxide). The diagram above shows the Contributions (climate debt) per capita in 2000, 2005 and 2010 (the black line is the global average). India was Contribution Free. Note the logarithmic scale. On the list of the worst performing countries (climate debt per capita) the ranking in 2010 was as follows: United States (no. 7), Japan (no. 18), Russia (no. 31), China (no. 57) and India (Contribution Free). See the full country list in the menu Contributions/Per Capita US$ Rank.